At first glance, when comparing PostHog vs Amplitude, you’ll see a similar suite of tools for product teams. Both provide product analytics, experimentation, and feedback mechanisms. However, their underlying philosophies and target users create distinct experiences.
Amplitude has been a long-standing leader, often seen as the enterprise-grade choice for deep behavioral analytics. PostHog, a newer, open-source contender, takes an all-in-one approach, bundling more features under one roof and often appealing more to developer-centric teams.
So if you’ve been hesitating over these two tools, let me walk you through both!
What is Posthog, and who is it for?
PostHog is an open-source platform built for technical users who want one place to track events, run experiments, ship feature flags, and dig into session recordings without juggling other tools.
It’s a flexible all-in-one platform you can self-host, customize, and tailor to your data setup.

I find that PostHog works best for technical teams that like to instrument data their own way and don’t mind getting a little hands-on.
If you want to run A/B tests, roll out features safely, or track user behavior in depth, PostHog gives you all the building blocks. The downside is that the learning curve can feel steep if you don’t have the technical expertise or time to configure it properly.
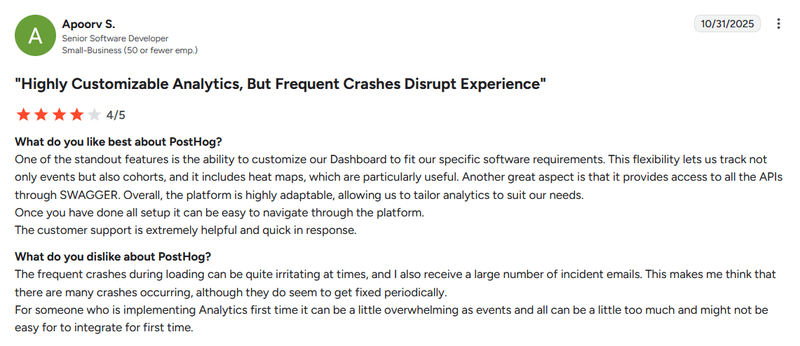
Here’s a G2 review I found that captures this really well:
“One of the standout features is the ability to customize our Dashboard to fit our specific software requirements… heat maps, cohorts, APIs through SWAGGER… But the frequent crashes during loading can be irritating, and for someone implementing analytics for the first time, it can feel a little overwhelming.” – Apoorv S., Senior Software Developer
What is Amplitude, and who is it for?
Amplitude is a product analytics heavyweight designed for teams that need depth, scale, and a wide range of visualization options.
It’s a popular enterprise pick because Amplitude focuses heavily on advanced analytics, governance, and reliability. If you want to map user journeys, explore richer data analysis, or build detailed reports, Amplitude gives you that structure.

However, I’ve noticed that the flip side is that Amplitude can feel complex if you’re not already accustomed to larger, enterprise-grade analytics platforms. Many users mention that the setup takes time, patience, and sometimes more technical familiarity than you’d expect.
Then there’s pricing. Amplitude’s model is tied to event volume, which can make teams think twice about sending all the data they’d ideally want to track. For smaller companies, this becomes the biggest friction point.
This review sums up the pros and cons really well:
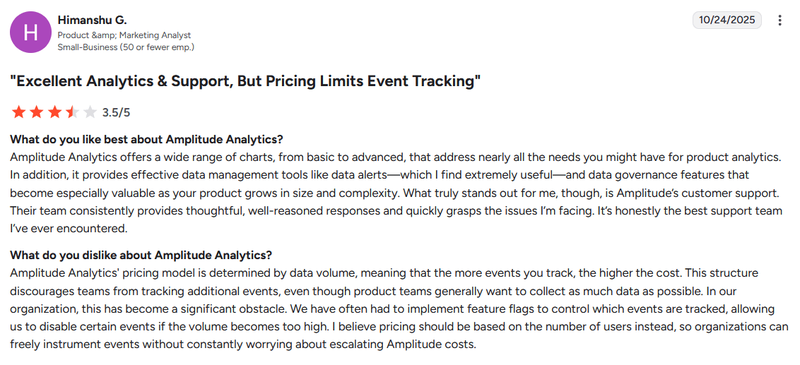
“Amplitude offers a wide range of charts… and data governance features that become especially valuable as your product grows. Their customer support is the best I’ve encountered. But pricing is determined by data volume, discouraging teams from tracking additional events. We’ve even had to implement feature flags to reduce event load so costs don’t escalate.” – Himanshu G., Product & Marketing Analyst
PostHog vs. Amplitude: The big picture
Here’s how I think about it: both tools cover the core analytics basics, but they’re built for different kinds of teams. Amplitude feels more polished and structured. That works great if you want something that works out of the box and fits neatly into an enterprise workflow.
PostHog is more flexible and transparent, especially if you like having control over your data, pricing, and setup.
The table below breaks down the differences at a glance:
| Amplitude (Amplitude Analytics) | PostHog (Product OS) | |
|---|---|---|
| Core analytics features | ✔ Rich product analytics – Funnels, retention cohorts, user flows, engagement metrics, custom dashboards. | ✔ Full product analytics – Funnels, retention, cohorts, paths, dashboards all included. Also offers correlation analysis for funnels and built-in SQL queries for advanced analysis. |
| Visual analytics (heatmaps, click/scroll maps, session replays) | ✔ Available as Add-on on Growth and Enterprise plans | ✔ All PostHog plans (including the free tier) |
| In-app engagement and surveys | ✔ Basic guides (modal, tooltips, etc.) and Surveys are available as add-ons for the Plus plan or bundled with Growth/Enterprise plans | ✔ Surveys only |
| Self-hosting | ✖ Cloud SaaS only | ✔ Cloud or self-hosted – Can use PostHog Cloud or deploy on your own infrastructure. |
| Pricing model | Tiered by MTUs (Monthly Tracked Users) – Free plan available (e.g. 50k MTUs on Starter) then paid Growth/Enterprise plans based on number of unique users tracked. | Usage-based (events & features) – Generous free usage (e.g. 1 million events/month free) then pay per event, recording, etc. |
| Integration ecosystem | Hundreds of integrations – Native connectors to CDPs, data warehouses, marketing automation, ad platforms, customer support, and more. Has HTTP API and SDKs for custom integration. | Built-in CDP functionality – Import and export data to hundreds of tools via plugins. |
| Target users & use cases | Product & growth teams at scale – Used by product managers, analysts, and marketers at tech companies and enterprises to understand digital experiences and drive product-led growth. | Developers and data-savvy startups – Loved by engineering-led teams, technical founders, and analysts who code. Popular in startups and mid-size companies looking to save cost and have full flexibility. |
PostHog vs Amplitude for product analytics
PostHog offers a robust set of analytics features, often including what Amplitude reserves for paid plans, right in its free and starter plans. This includes SQL query builders, custom formulas, and group/account analytics.
From a pure product analytics standpoint, both tools give you the basics: event tracking, autocapture, funnels, paths, and retention. So in terms of core features, you’re mostly getting the same level of analysis no matter which tool you pick.
The real difference is in the experience of using those features. Personally, I find Amplitude more polished on the UI side.
This is especially convenient when you’re building custom dashboards, running funnel analysis, or pulling together custom reports. It’s friendlier for product managers, analysts, and marketing teams who want to explore data without getting technical.
PostHog, on the other hand, is more flexible. If your team prefers having control over instrumentation, needs to track custom events quickly, or works heavily with engineers, PostHog gives you that freedom.
| Feature | PostHog | Amplitude |
| Event tracking (manual/custom) | ✔ | ✔ |
| Autocapture of events | ✔ | ✔ |
| Funnels | ✔ | ✔ |
| Path analysis | ✔ | ✔ |
| Retention cohorts | ✔ | ✔ Predictive analytics available for retention cohorts |
| SQL access / warehouse sync | ✔ SQL-based queries via PostHog Warehouse or external sync | ✔ SQL schema explorer (Enterprise), Data Tables (Plus+) but SQL queries require plan upgrade |
| Mobile analytics support | ✔ | ✔ |
PostHog vs Amplitude for feature flags and A/B testing
PostHog offers built-in feature flags and A/B testing, even in its free tier. This tightly integrated approach means you can roll out features safely, target specific user cohorts, and measure their impact directly within the platform. From my experience, PostHog feels easier to experiment with and see how users interact.
In contrast, Amplitude also provides A/B testing, but it often comes as a separate product (Amplitude Experiments) with a less transparent pricing structure. Sometimes it requires direct sales contact.
It has all the enterprise features and advanced capabilities you’d expect: mutual exclusion groups, holdouts, and flag dependencies.
And while I like how well it scales for complex setups, it can feel like overkill if you’re just getting started or don’t have much technical expertise in-house.
So, who wins?
- If you’re looking for an affordable, lightweight way to run quick experiments for testing new features, PostHog takes the win.
- But if you’re at the stage where precision for making data-driven decisions and governance matter more than cost, Amplitude’s the better fit.
| Features | PostHog | Amplitude (Experiment) |
|---|---|---|
| Feature flags (core) | ✔ | ✔ |
| Targeting & % rollouts | ✔ | ✔ |
| A/B/n experiments (flag variants) | ✔ | ✔ |
| Results UI for experiments | ✔ | ✔ |
| Mutual exclusion groups | ✖ | ✔ |
| Holdout groups | ✖ | ✔ |
| Flag prerequisites / dependencies | ✖ | ✔ Set flag dependencies (incl. prerequisites) to orchestrate complex rollouts |
| Session replay context for experiments | ✔ Ties session replay directly to experiment variants | ✖ Replays are an optional/separate module |
PostHog vs Amplitude for qualitative analytics (session replays, surveys, etc.)
If you want replays tightly woven into product analytics workflows and native in-app/hosted surveys with granular display logic, PostHog is strong.
Everything sits close to your events and funnels, so it’s easy to move from a spike in churn to the recordings that explain it. If your priority is spotting friction quickly across screens, PostHog makes that loop feel pretty natural.
Amplitude counters with deep replay integration inside charts (Microscope), AI-assisted replay insights, and a mature Guides & Surveys system with rich triggers, throttling, and localization.
Its Microscope view lets you click into almost any chart and instantly open the relevant replays or AI-generated summaries. Plus, the insights show up right where you’re already doing analysis.
So who wins here? It depends on how your workflow looks day to day.
- If you want simple, fast troubleshooting and a tight connection between qualitative and quantitative analytics to understand user behavior.
- If you want qualitative data built directly into your analysis flow, with stronger AI support and more scalable survey control, Amplitude is the one.
| Features | PostHog | Amplitude |
|---|---|---|
| Session replay: Platforms | ✔ Web, iOS, Android, React Native, Flutter. | ✔ Web, iOS, Android, React Native (standalone SDKs & plugins). |
| Replay retention (defaults / max) | ✔ Cloud: Free up to 30d, Pay-as-you-go up to 90d, Boost/Scale up to 1y, Enterprise up to 5y. | ✔Default 30d, purchasable up to 12 months. |
| Heatmaps | ✔ Also includes rage/dead-click indicators for marketing use cases | ✔ |
| Replay → AI insights | ✖ | ✔ AI-powered summaries & recommendations. |
| Surveys: Availability & types | ✔ Native surveys with templates: NPS, CSAT, CES, churn, etc.; multiple question types (emoji/number ratings, single/multi-select, free-text). | ✔ Guides & Surveys with blocks: NPS, rating (stars/numbers/emoji), long & short answer, list, conditional logic. |
Amplitude or Posthog fits your budget?
For smaller teams and startups, PostHog’s usage-based model with its generous free tiers is often more forgiving. It lets you grow into the tool without massive upfront costs.
Amplitude’s MTU model is generally better for established enterprises with predictable user counts. When considering free vs. paid analytics platforms, it’s vital to assess which model aligns with your current and projected user activity.
For me, the biggest trade-off between these two pricing models is the amount of effort you’re willing to invest upfront. PostHog is flexible, but the setup can feel more complex, especially if you’re trying to replace other platforms with a single stack.
Amplitude, meanwhile, is simpler to start with but can get expensive quickly as your product grows.
So, if you’re a new team or small business still figuring out instrumentation, PostHog is the kinder option for experimentation. If you already have stable usage and a clear data pipeline, Amplitude’s predictability might make it the right analytics platform for you.
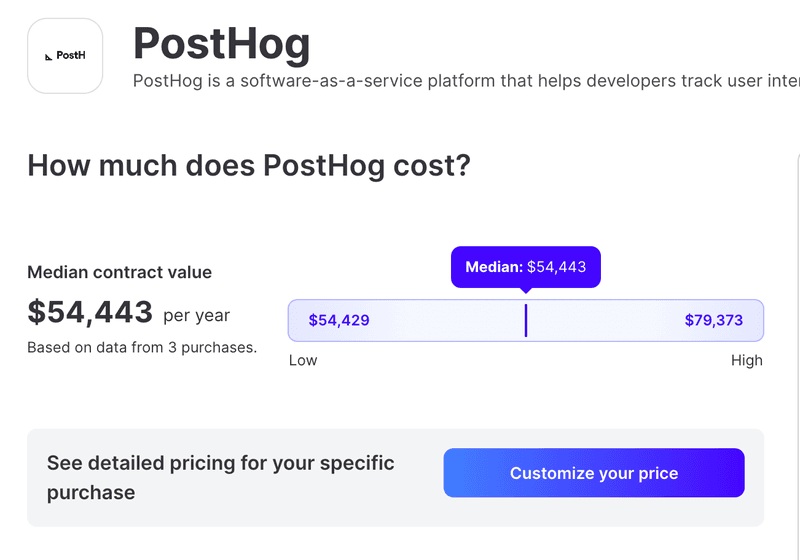
PostHog pricing
PostHog uses a true usage-based pricing model. This means you pay for what you use across different products like analytics events, session replays, and feature flag calls.
The free tier is genuinely generous: 1M analytics events, 5,000 session replays, 1M feature flag requests, and 1,500 survey responses each month, plus free historical warehouse data.
Once you exceed those limits, PostHog’s pricing is clearly published per unit (e.g., $0.00005 per analytics event and $0.0001 per feature flag request), and billing scales according to your usage.
What I like: This model is very flexible. For startups testing product-market fit, where usage can fluctuate wildly, it keeps initial costs low. If you have many users generating a few events, it’s often more economical. The transparency is also a huge plus; as a PM, I appreciate knowing exactly what I’m paying for without hidden fees. I’ve seen this model work well for many early-stage companies.
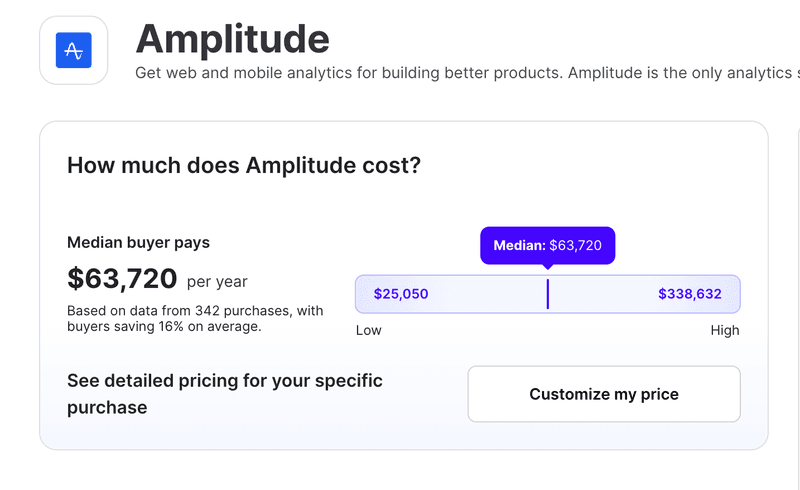
Amplitude Pricing
Amplitude’s current plans include:
- Starter: Free (up to 50K MTUs and 10M events).
- Plus: Starts at $49/month (paid annually).
- Growth: Custom quote.
- Enterprise: Custom quote with more governance, priority support, and advanced permissions.
Amplitude’s pricing primarily charges based on Monthly Tracked Users (MTUs). An MTU is counted once per month, regardless of how many events they generate. Plans scale with your MTU count, with higher tiers unlocking more advanced features and enterprise capabilities.
Amplitude also has real contractual considerations, which I think are important to call out. According to Vendr:
- Renewal caps typically fall between 3–8%, depending on volume.
- Some companies reported cohort limits unless they upgraded.
- Additional services can sometimes be negotiated at low or zero cost, but only with pushback.
All of this aligns with what I’ve seen: Amplitude is powerful, but it becomes expensive once your usage grows past the free tier. And because pricing is tied to MTUs, high engagement doesn’t help you save the way it does in usage-based models.
What I like: This model offers predictability, especially for large, established products with stable user bases. If your users generate many events, but your unique user count remains consistent, an MTU model can offer more stable costs. However, it can be less flexible for products with high user churn or a very active, but small, user base, where every user is counted equally regardless of their value.
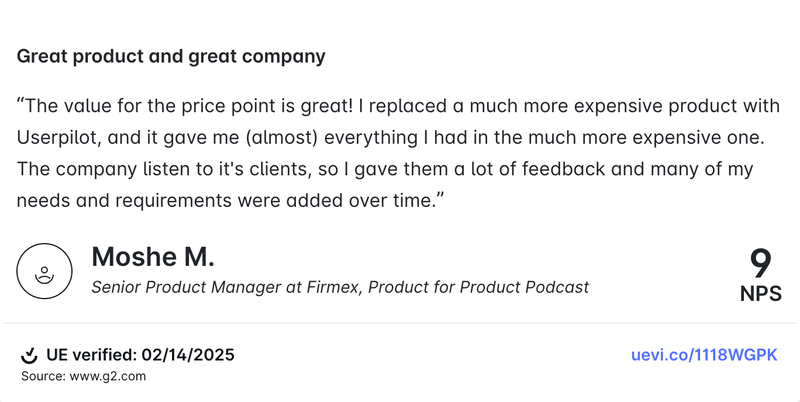
Try Userpilot – A more intuitive alternative to Posthog and Amplitude!
I’ll be honest: after spending time inside both PostHog and Amplitude, what I appreciate most about Userpilot is how straightforward everything feels.
You get the essentials of modern product analytics platforms, but without the setup drag or the SQL learning curve. It just feels easier, especially if you want one tool that handles analytics, in-app experiences, and feature management without the usual setup headaches.
Here’s what makes Userpilot more intuitive:
- Core analytics, with less effort: Userpilot gives you the full analytics stack out of the box: autocapture, session replay, reports, funnels, dashboards, and all the behavioral data you need.
One of the biggest key differences I’ve noticed is how easy it is to answer the everyday questions product teams care about. Want to compare data across periods or spot a drop in conversion rates? In PostHog, some of that quickly turns into a SQL exercise. In Amplitude, it’s often a premium feature. Meanwhile, in Userpilot, it’s all just there, and it’s all no-code.

- Richer in-app engagement than most analytics tools: PostHog and Amplitude are great at analytics, but they aren’t built for end-to-end in-app experiences. That’s where Userpilot pulls ahead.
You get a full library of in-app UI patterns (modals, tooltips, banners, checklists, slideouts) customizable with your brand colors, fonts, and copy. The targeting conditions are deeper, too, so you can personalize flows based on behaviors, segments, roles, or actions taken inside the product.
This combination of analytics, in-app experiences, and personalization means you can drive business growth right where it happens: inside the product itself.

- Predictable pricing: Userpilot is straightforward in its pricing. There are no surprise add-ons, no complex module math, no sudden jumps when you cross an event threshold.
Product teams mention this a lot in reviews: how refreshing it is to know exactly what they’re paying for without all the guessing.
We’re also adding AI to make all these capabilities even more powerful! You’ll get instant, automatic insights to help build flows, analyze user paths, and support smarter decision-making without drowning in dashboards.
If you want early access to try all this out, you can join the beta here.

So Amplitude or Posthog?
If you’re deciding between the two, it really comes down to how your team prefers to work. Amplitude is great if you want a polished, structured analytics setup and guardrails for things like privacy regulations. PostHog is a better fit if you prefer flexibility, transparency, and a more hands-on approach to your data.
But if you want something that feels easier day-to-day, with clear insights, intuitive analytics, and in-app experiences built right in, Userpilot is the option that keeps things simple without limiting what you can do. If you want to see it in action, book a Userpilot demo.
About the author