Customer Retention Strategies in 2026: Keep More, Spend Less, Grow Faster


There’s a number that should bother every SaaS team right now: the median New Customer CAC Ratio reached $2.00 in 2024. This means teams spend two dollars for every new ARR they bring in, up 14% in a single year.
Now, I hear the same question from CS and growth leads constantly: how do we grow more efficiently when acquisition keeps getting more expensive?
The answer most teams overlook is their customer retention strategy, or whatever passes for one. Keeping a customer costs somewhere between 5x and 10x less than winning a new one in B2B SaaS. Yet most growth teams still point the majority of their energy at acquisition, because new logos feel exciting and visible in a way that retention rarely does.
In this article, I discuss the way out: building retention as a deliberate system, the strategies that work, and where AI fits in.
The quick summary
- Why retention is your highest-ROI growth move: Acquiring a new SaaS customer costs $2 for every $1 of new ARR. Keeping one costs roughly half that. In 2026, retention is the most efficient growth channel that most teams aren’t fully using.
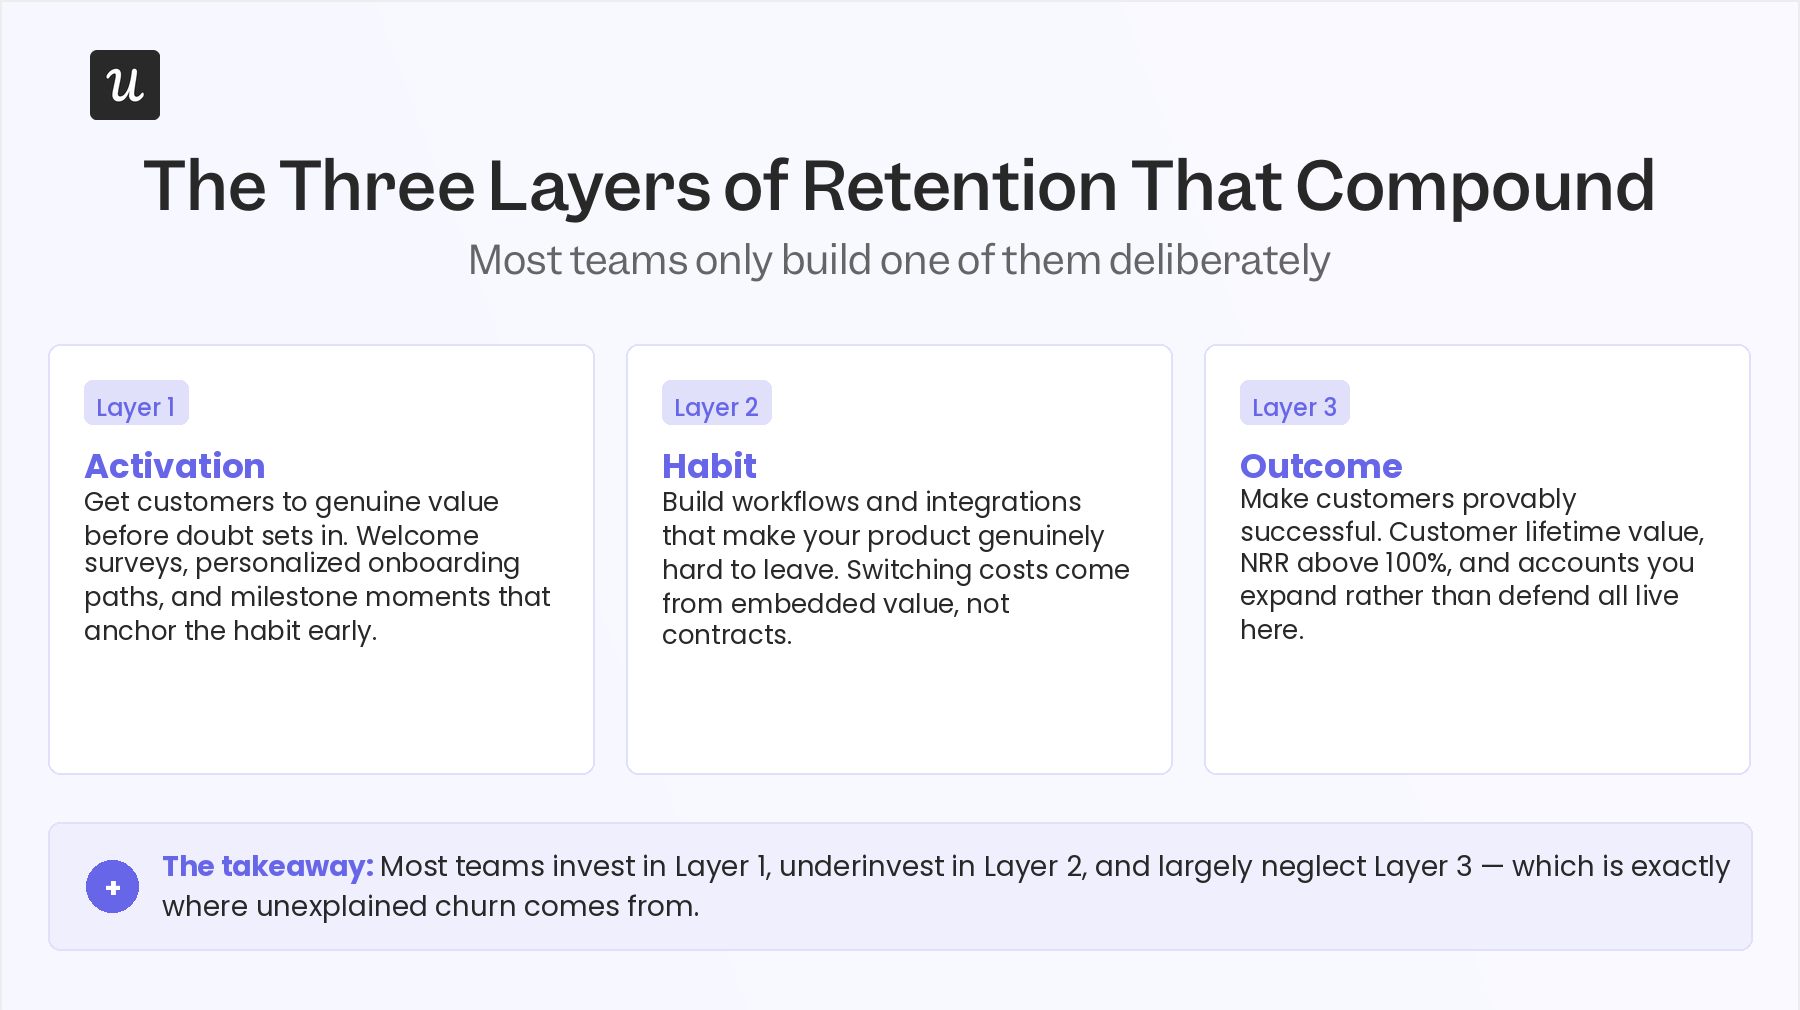
- The three layers of retention that compound: Retention breaks into three layers, activation, habit, and outcome, each requiring different strategies. Most teams only build one of them deliberately.
- Layer 1, getting to value fast: Welcome surveys, personalized onboarding, usability testing, and milestone moments that anchor the habit before customers start second-guessing their decision.
- Layer 2, building a product they’d hate to leave: Feedback loops, behavioral monitoring, integrations, and in-product feature announcements that turn initial adoption into embedded workflows.
- Layer 3, making customers provably successful: Proactive in-app support, community, education, loyalty programs, and advocacy that create the kind of outcome evidence that makes renewal feel obvious.
- How Lia and AI feed every strategy: Lia monitors the signals that precede churn across hundreds of accounts simultaneously, surfaces at-risk customers before they voice dissatisfaction, and catches the right intervention moment before it closes.

Why retention is your highest-ROI growth move in 2026
The economics have shifted decisively in retention’s favor, and most teams haven’t recalibrated their resource allocation to match. While the median New Customer CAC Ratio reached $2.00 in 2024, the Expansion CAC Ratio, the cost of growing revenue from existing accounts, sits at just $1.00. Growing inside an account you already have costs half as much as landing a new one, and it compounds from a foundation of trust rather than from a cold start.
The full cost differential is wider than CAC alone suggests. Research on B2B SaaS specifically puts the gap between acquiring and retaining at 5x to 10x, depending on your segment and deal size. A subscription product with high annual churn has almost no window to recover acquisition spend before the customer leaves. A product with 95% annual retention compounds its customer base in ways that make each new logo significantly more valuable than it would be otherwise.
Teresa Anania, Chief Customer Officer at Sophos, frames this well in her conversation with Sophos Partner News: customer success is not a department, it’s a mindset focused on helping every customer get real outcomes from their investment throughout their entire journey. The word “throughout” is the operative one. Retention is not built at the renewal conversation. It’s built in every interaction from day one, and the teams that understand this tend to show up in the top quartile of the benchmarks below.
The SaaS Capital 2025 retention benchmarks show median Net Revenue Retention for private B2B SaaS ranging from 97% to 111% across mid-market ACV tiers, with top performers pushing above 120%. At 95% NRR, you compound. At 80%, depending on your acquisition pace, you tread water or go backward. That gap is where the rest of this article lives.
The three layers of retention that compound (and why most teams only build one)
Retention is not a single problem. It’s three problems stacked in sequence, and the fix for each one is different.
- Layer 1 is activation retention: Getting the customer to their first real outcome before they decide whether the product is worth their time. This is the most visible layer, and it’s the one most teams already have some version of. The question is whether it’s fast and personalized enough to land before doubt sets in.
- Layer 2 is habit retention: Building the workflows, integrations, and routines that make your product genuinely hard to leave. Switching costs in SaaS are real, and they come from the embedded value the customer would have to rebuild from scratch somewhere else, not from contracts.
- Layer 3 is outcome retention: Making the customer provably successful in their own terms. Customer lifetime value grows here. Expansion revenue lives here. Loyal customers come from here. A team that only runs Layer 1 and 2 strategies sees churn spike at renewal when customers audit whether the product has actually delivered ROI. Layer 3 closes that loop before the audit starts.
Layer 1 strategies: Getting customers to value before they start doubting
Everything in Layer 1 is about shortening the distance between “signed up” and “this is clearly worth my time.” The tactics here are well-known. What makes the difference is the specificity with which they’re executed and how early they start working.
Run usability and preference tests before you launch
The fastest path to Layer 1 retention failure is shipping something that works in theory but creates confusion in practice. Usability and preference testing before a product launch lets you catch UX friction before it costs you customers, not after. The key is running it early, in small increments, so you’re not redesigning something users have already formed opinions about.
Beable, an education platform, used in-app surveys to collect user preference data during a product redesign and used the insights to inform their roadmap before any changes went live. The result was a redesign grounded in what their users actually wanted, rather than what the team assumed.

Collect user data at signup to personalize from day one
You can’t tailor an experience you haven’t asked about. Welcome surveys at signup capture the role, goal, and context of each new user before you’ve had a single conversation with them, and they make it possible to route users toward the version of the product that’s most relevant to what they’re trying to accomplish. The activation rate impact is direct: users who see a product configured for their use case reach their first “aha” moment faster than those who have to navigate a generic interface.
ClearCalcs, a structural analysis platform for engineers, uses a welcome survey to capture role and objective data from every new signup. That data feeds directly into their onboarding path and informs future product decisions without requiring a CS conversation for every new account.

Build personalized onboarding paths by role and use case
A generic product tour is a missed opportunity to show users their version of value. Personalization at the onboarding stage, based on the welcome survey data you just collected, is where Time-to-Value gets compressed meaningfully. The goal isn’t to show users everything the product can do. It’s to show them the one thing most relevant to why they signed up, as quickly as possible.
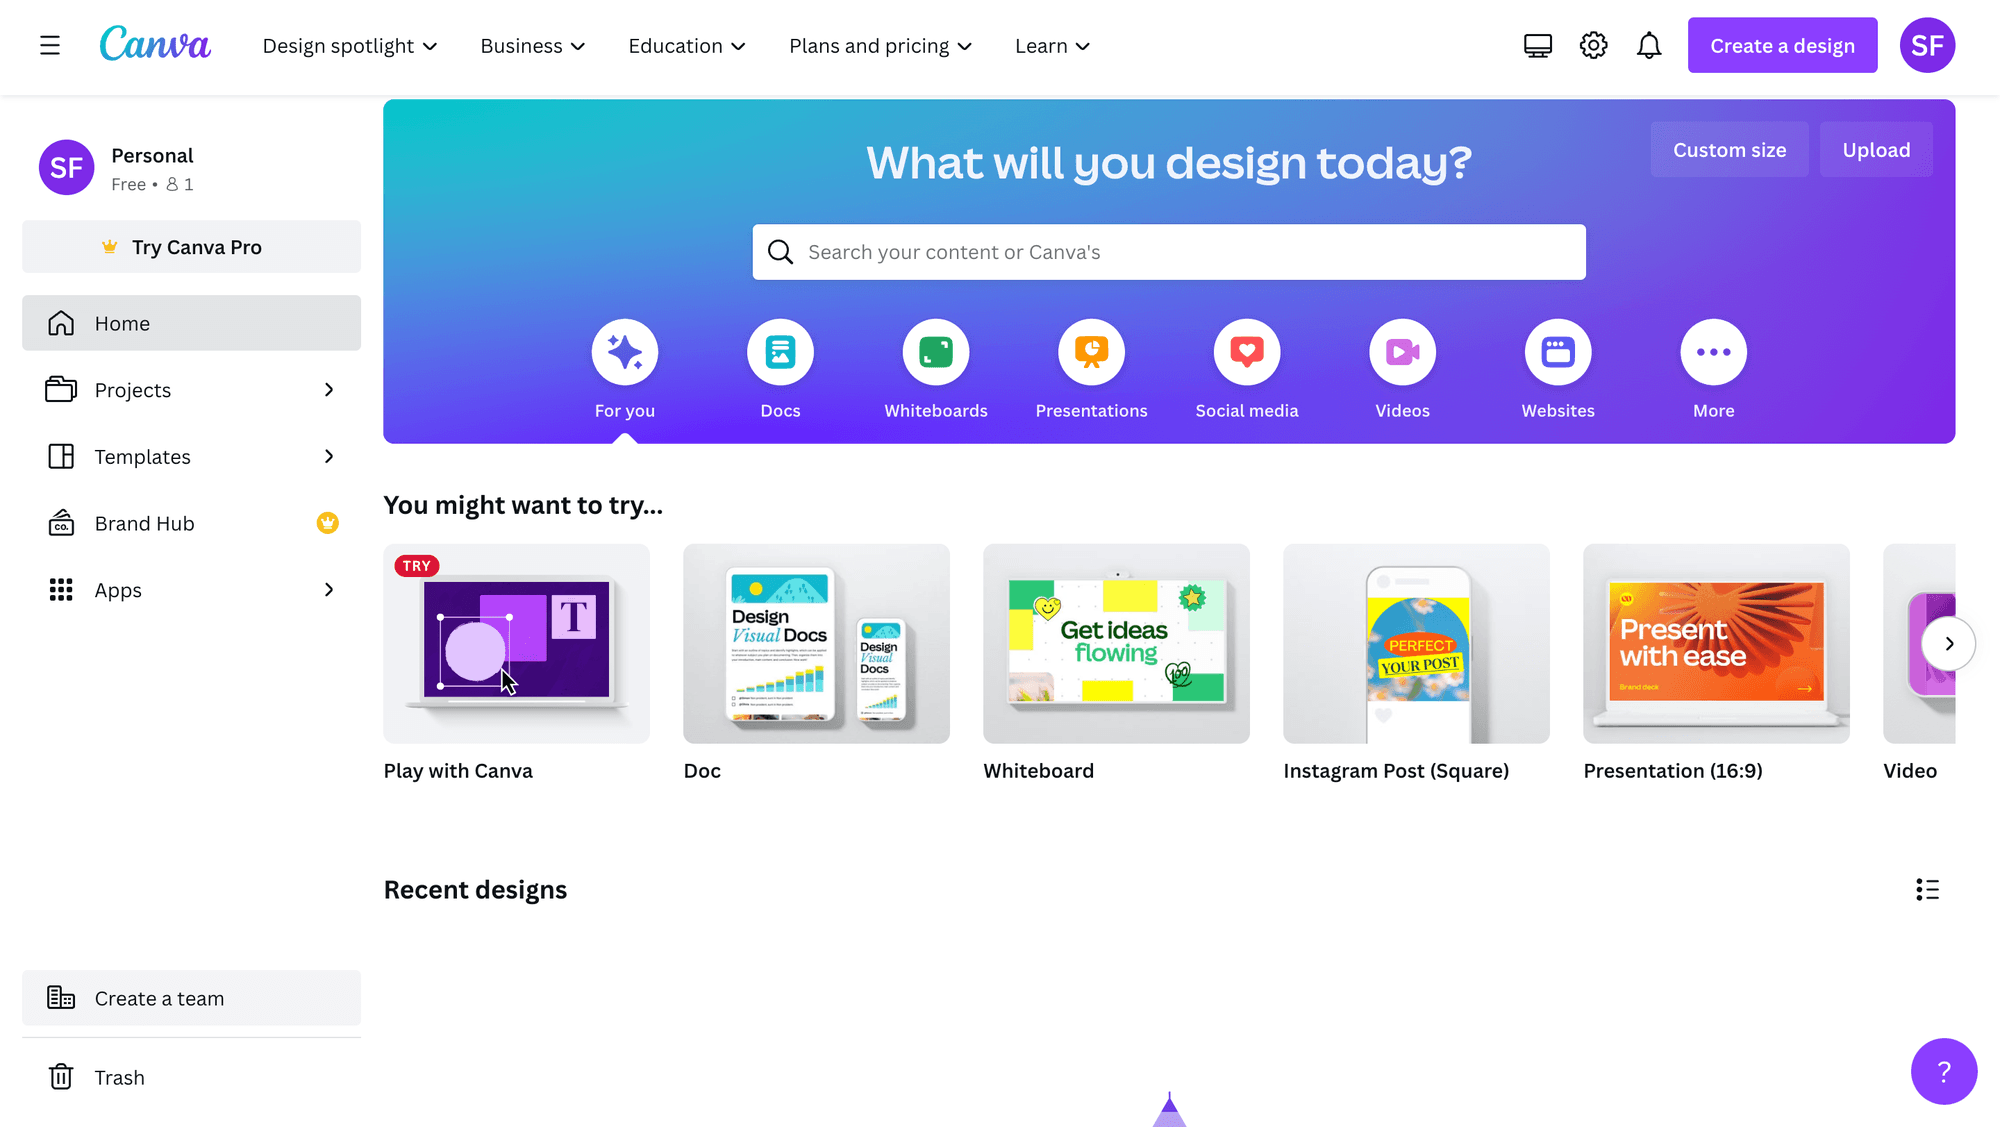
Canva’s onboarding is a clean example of this at scale. After users indicate their role in the welcome flow, Canva populates their dashboard with the templates most relevant to that role. A social media manager sees social graphics. A small business owner sees pitch decks and invoices. Same product, completely different first session.
At Userpilot, Lia now builds these onboarding flows autonomously. Rather than manually building separate paths for each user segment, product teams describe the outcome they want each persona to reach, and Lia builds the in-app experience to get them there.
Use gamified elements and milestone moments to anchor the habit
Gamification in onboarding works because it taps into the same reward mechanisms that make any habit stick: progress that’s visible, milestones that feel earned, and social reinforcement that makes reaching them feel worth sharing. Applied to activation, these elements turn a passive first session into something a user actively wants to complete.
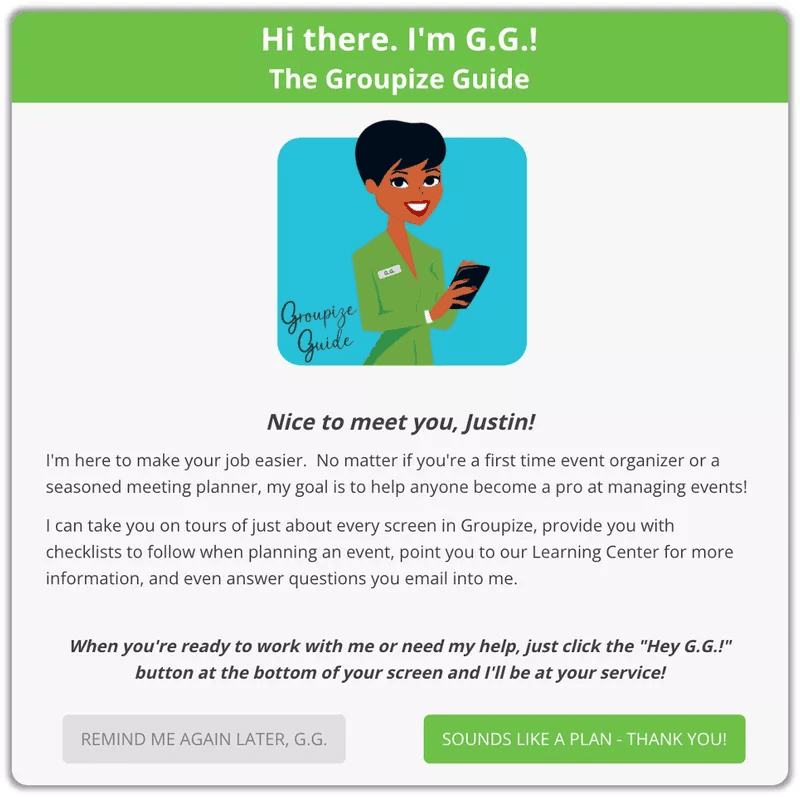
Groupize, a business travel management platform, gamified their entire onboarding experience through an AI guide called G.G. (short for the Groupize Guide). G.G. walks new users through the product via checklists, guided tours, and contextual support, with progress tracking that makes each step feel like an achievement rather than a task.
Celebrating milestones matters beyond onboarding, too. Tumblr’s congratulatory email at the tenth post, for instance, acknowledges a meaningful user behavior, reinforces the habit with a badge, and immediately prompts the next action: share this post, create another one. The mechanics are simple, but the timing is precise: it fires at the moment of achievement, when a user’s investment in the product is highest.
Layer 2 strategies: Building a product they’d hate to leave
Layer 2 is where retention stops being about onboarding and starts being about gravity. The goal here is to make leaving a genuinely bad trade-off, because the customer has built workflows around your product that they would have to reconstruct from scratch somewhere else. Contractual friction is secondary to that kind of embedded value.
Implement a feedback loop to stay ahead of changing preferences
User needs aren’t static. They shift with market conditions, new tools, and the evolving maturity of the customer’s own team. A feedback loop that runs regularly, rather than only at renewal or when something goes wrong, keeps your product aligned with what customers actually need rather than what they needed when they first signed up.
At Userpilot, we run a short two-question in-app feedback survey through our own resource center. Users can access it whenever they feel the need to submit a request or flag something, and the format, one closed question and one open question, captures both the what and the why in under a minute. It’s not a comprehensive survey. It’s a persistent listening channel, and the signal quality is significantly better than waiting for users to email in.

Spot friction by monitoring customer behavior
Feedback tells you what users think. Product analytics tells you what they actually do. Used together, they give you the ability to find where users are getting stuck at the account level, not just across the aggregate user base, and to follow up before the friction becomes a reason to leave.
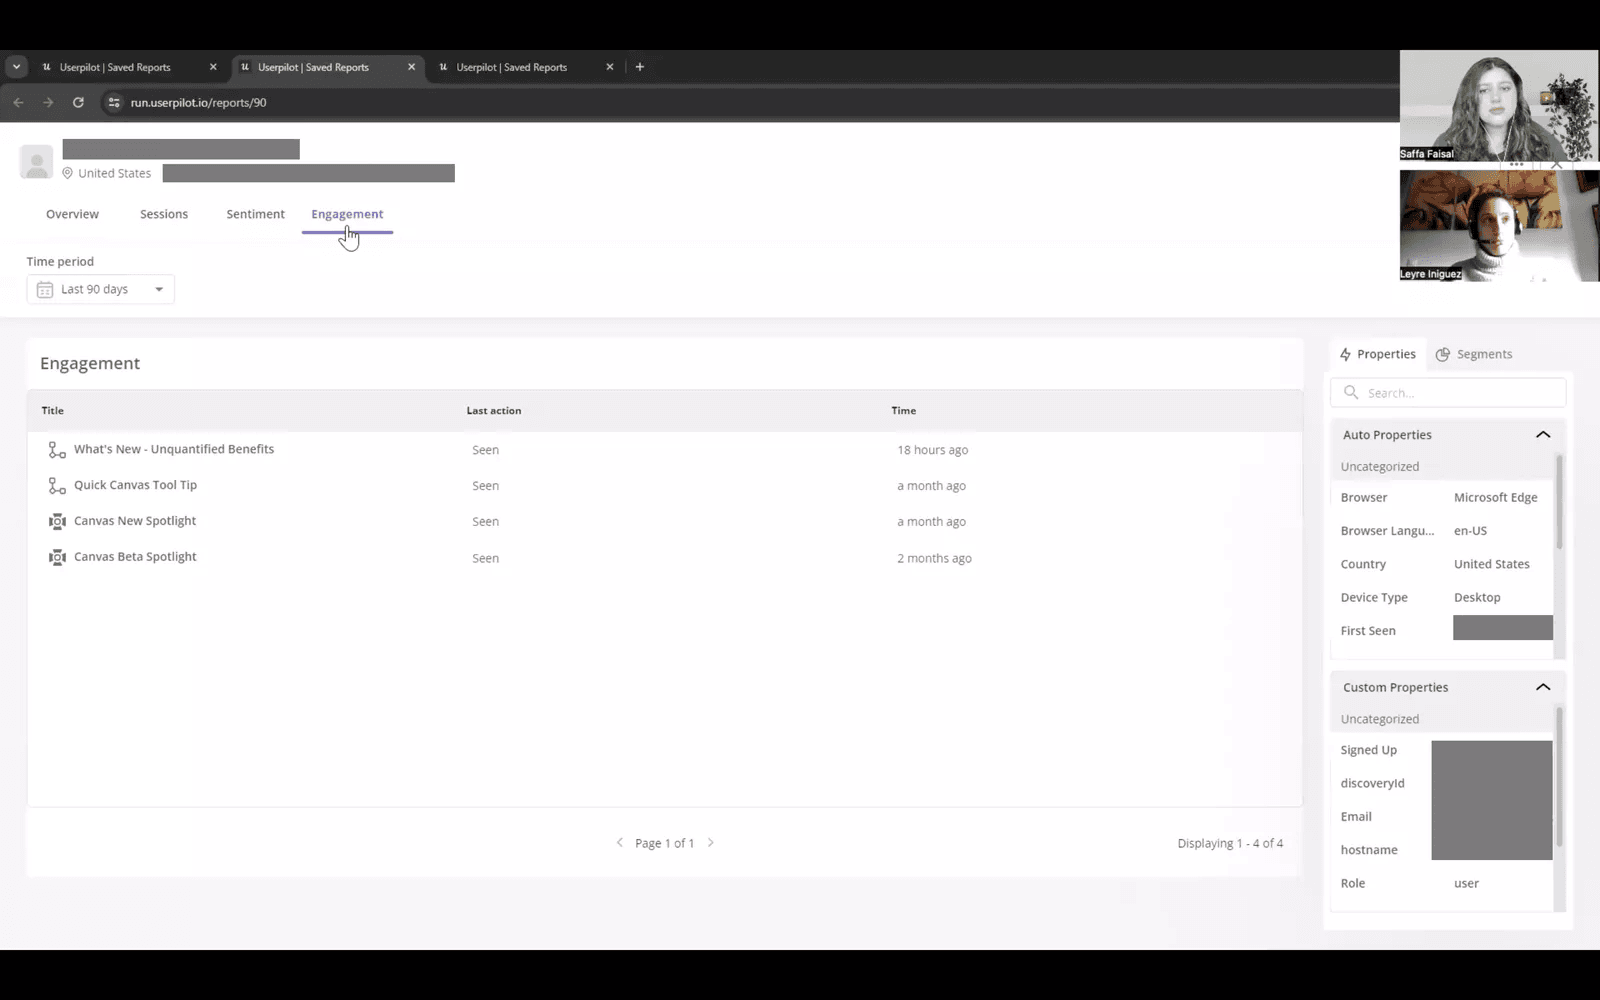
Leyre Iniguez, Customer Experience Lead at Cuvama, used path analysis to spot an error message that was disrupting a critical workflow. Once the pattern was visible in the data, she segmented the users who had encountered it and contacted them directly to investigate the root cause. The issue was in the data before it was in any support queue.
I’ve used session replay for a version of this at Userpilot as well. When an account goes quiet and I can see they’ve been active recently, I’ll go and watch those sessions to understand what they were trying to accomplish and whether they got there. If a user is clearly struggling with a specific feature and we haven’t heard from them, that’s a much better reason to reach out than a scheduled check-in. It gives the conversation a specific starting point rather than a generic prompt.
Offer integrations that embed your product into existing workflows
Every integration your product offers is a switching cost the customer doesn’t have to think about. Once a user has connected your tool to their CRM, project management platform, and communication stack, switching requires unwinding all of those connections in addition to the product itself. Embedded value, built deliberately into how the product fits their stack, is what makes that cost real.
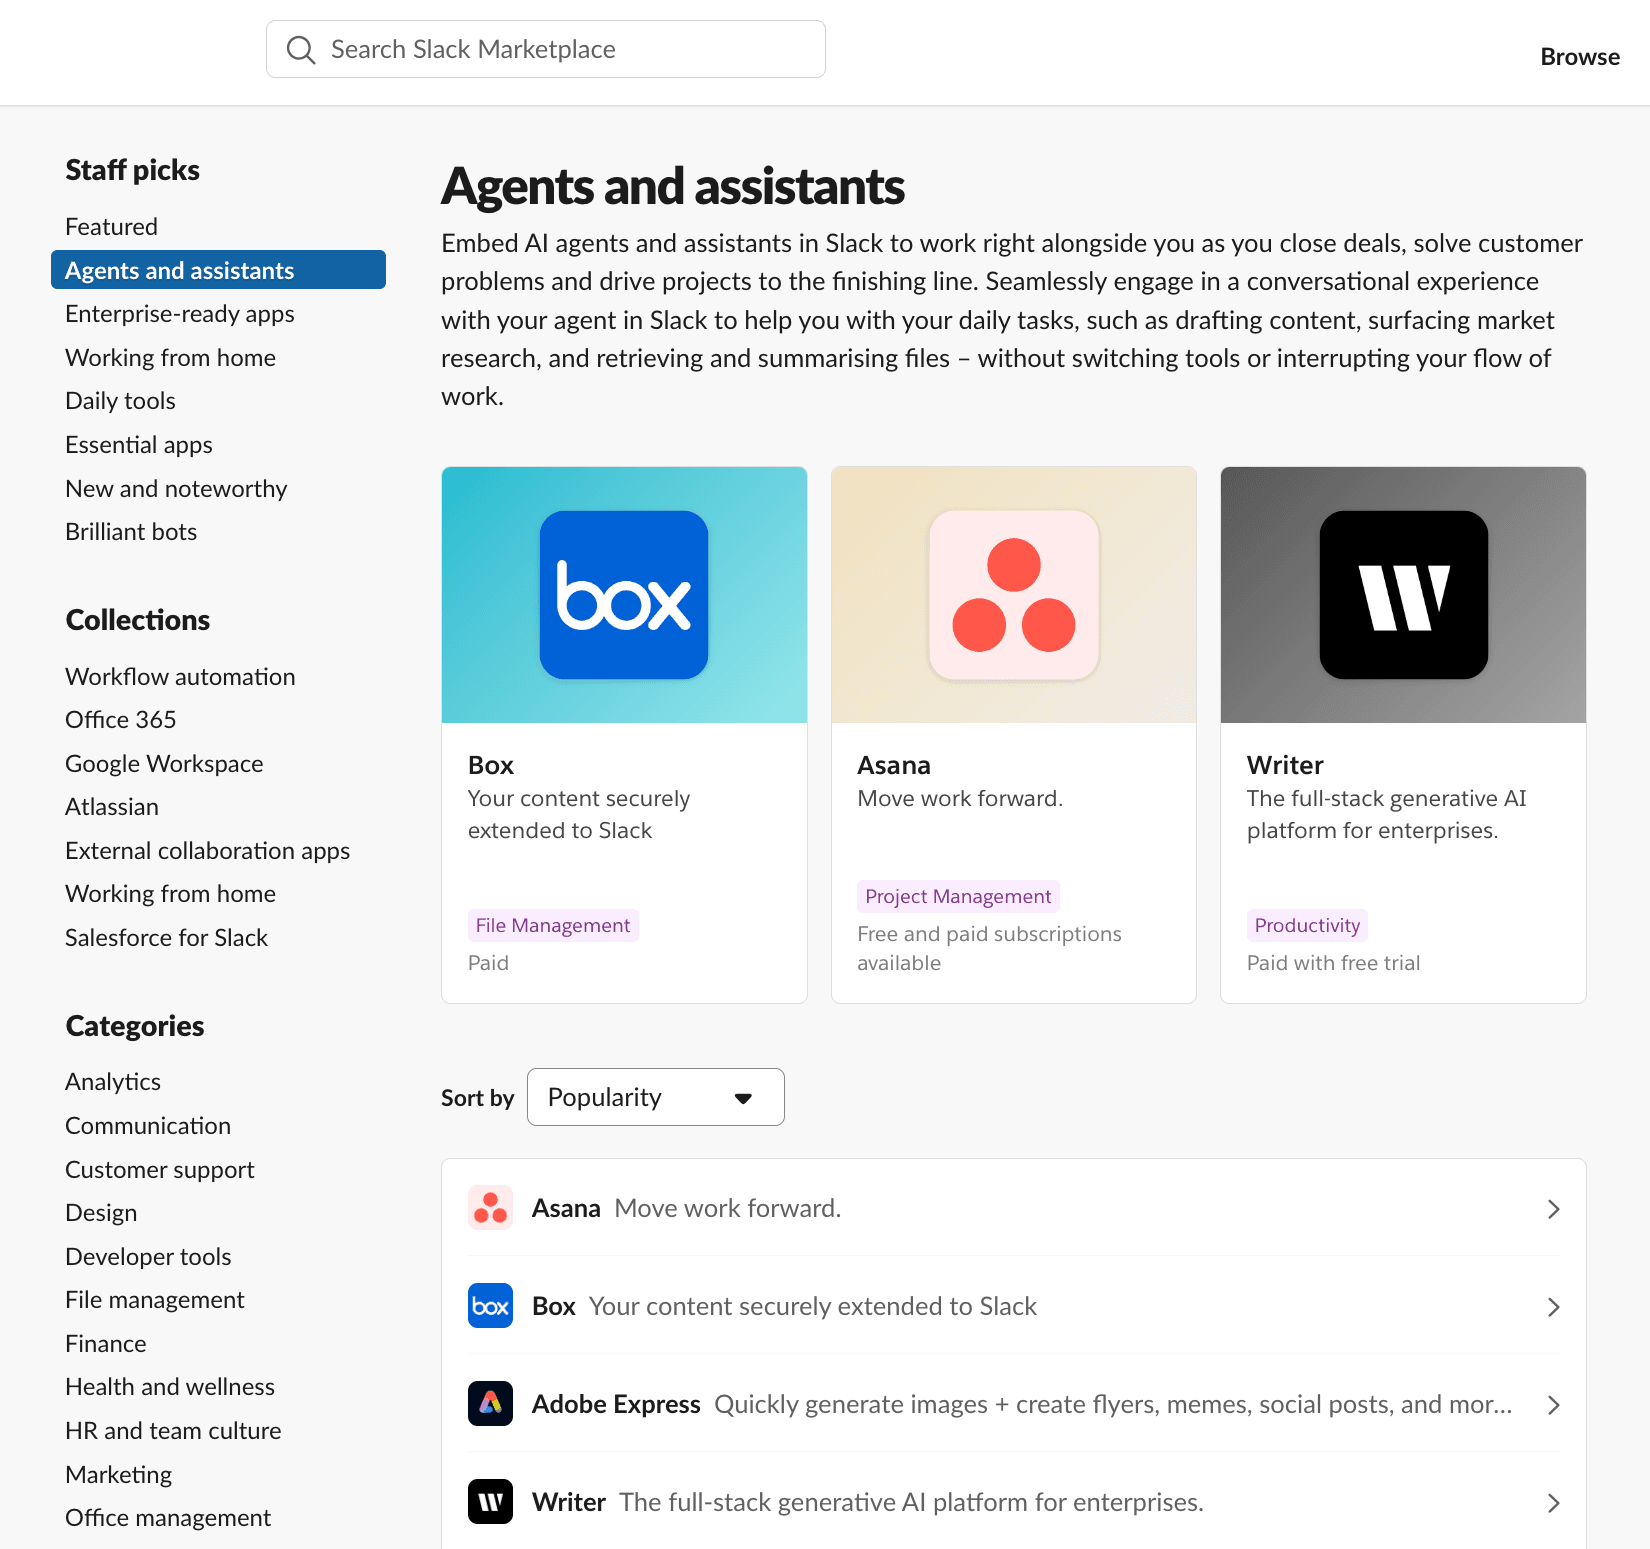
Slack has built one of the most effective integration ecosystems in SaaS by connecting deeply with tools like Asana, Workday, and Figma, so users can sync data and complete workflows without leaving the platform. Each integration added is another reason to stay.
Announce new features in-product to keep customers growing into the platform
A feature your customer doesn’t know about might as well not exist from a retention standpoint. In-product feature announcements, timed to appear when a user’s workflow would benefit from the new capability, consistently outperform email announcements for driving discovery and adoption. The context is right. The user is already in the product.
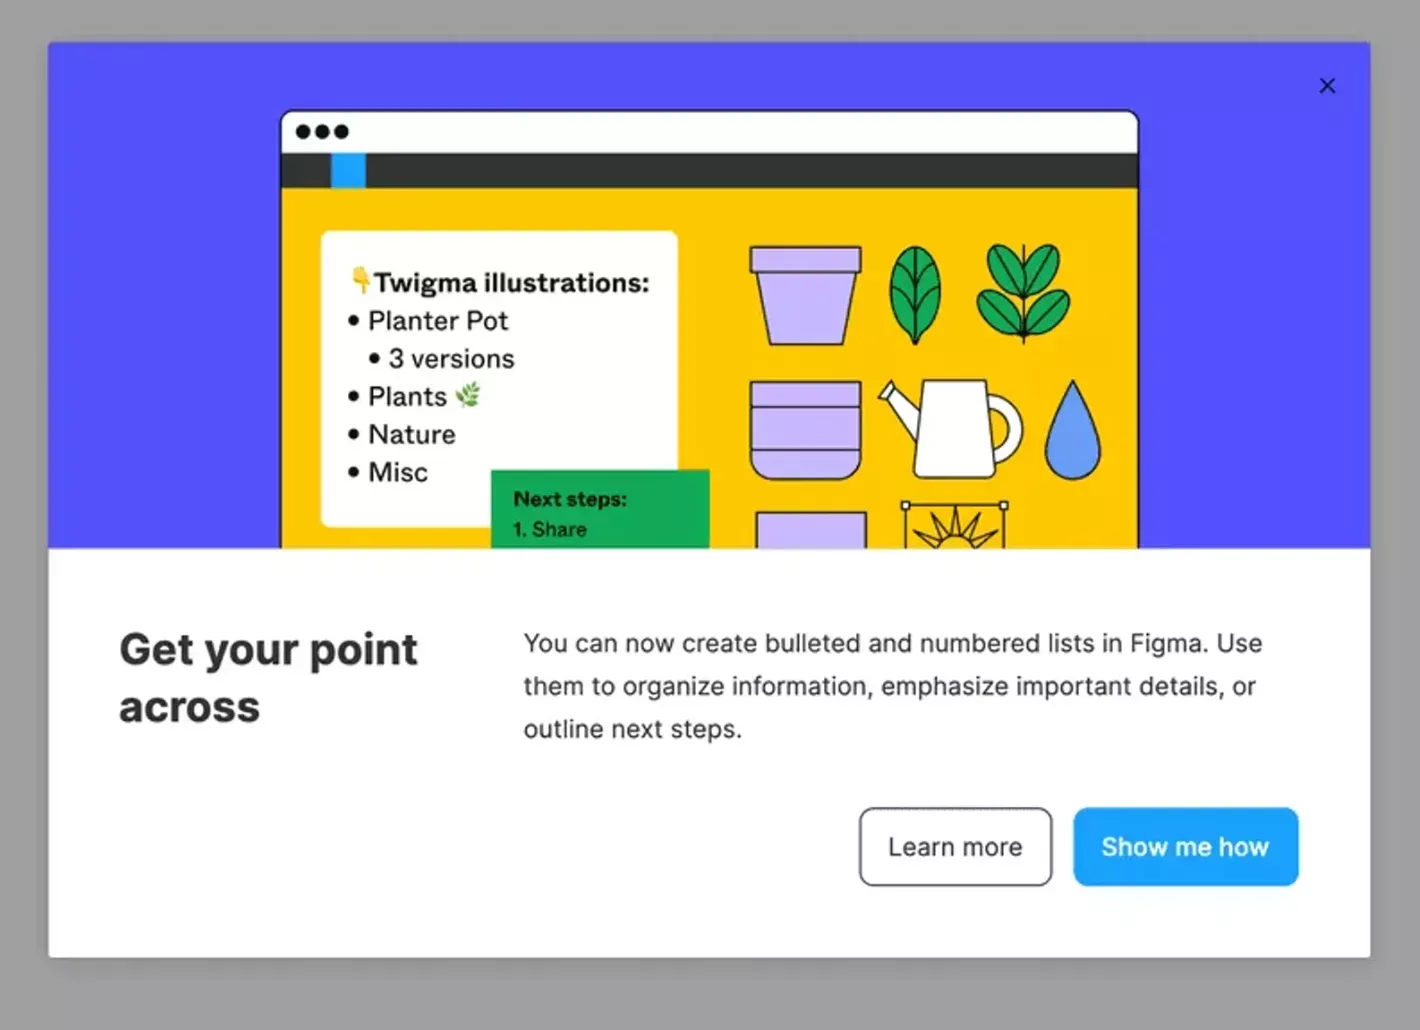
Figma’s in-product modals for new features are a clean example of this done well. When they added bulleted and numbered list formatting, the modal appeared in context, highlighted the specific benefit, and offered two CTAs: one to try the feature immediately and one to view additional resources. That sequence, awareness plus immediate trial plus support access, covers the full adoption journey in a single touch.
Contextual upsell triggers work on the same principle. Loom’s upgrade modal fires when a user hits the five-minute video limit, not at the billing page on a random Tuesday. The timing is what makes it effective: the user is experiencing the specific constraint the upgrade resolves, at the exact moment they feel it most. Userpilot lets teams configure these kinds of contextual triggers without engineering involvement, so the cycle from identifying the right moment to deploying the message is hours, not sprints.
Localize experiences for your global users
Users who interact with a product in their native language engage more, understand in-app guidance more accurately, and respond to feedback requests more candidly. Localization goes well beyond UX polish. For products operating across multiple language markets, it’s a measurable retention lever, and the nuance in the copy matters more than most teams assume.
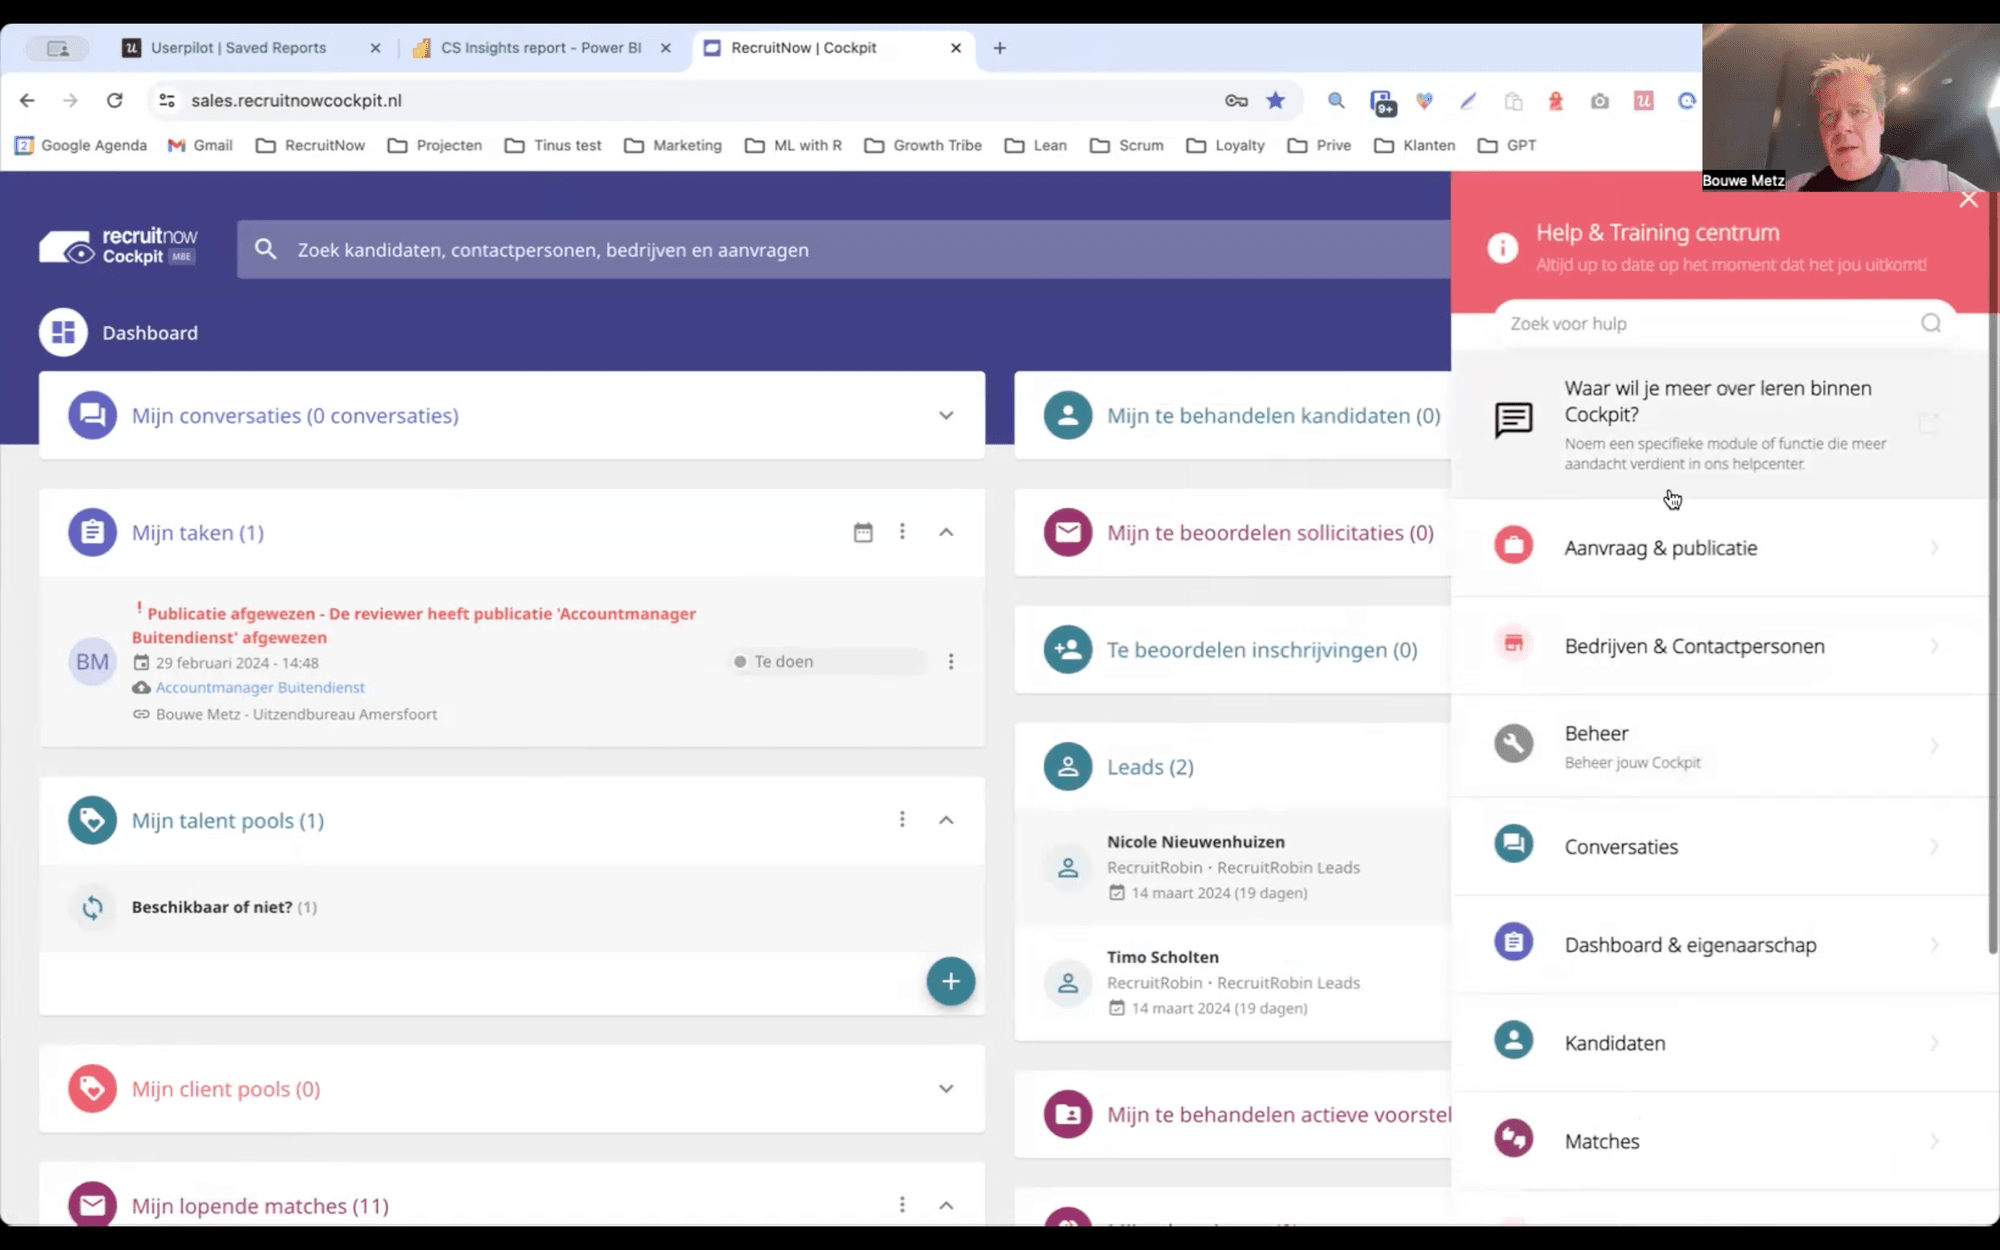
RecruitNow, a Dutch ATS company serving German and Austrian markets, uses Userpilot’s localization feature to translate its in-product resources and surveys for its target users. The result is higher survey response rates and more actionable feedback, because users can articulate their experience in the language they think in.
Layer 3 strategies: Making customers successful enough to stay and expand
This is the layer most teams underbuild. Layer 3 is about making the customer so clearly and measurably successful that renewal is never really a question, not about preventing churn at the last moment. Customer lifetime value grows here. Net revenue retention above 100% lives here. The accounts you expand rather than defend come from here.
Provide proactive in-app support before issues become dissatisfaction
When it comes to customer support in SaaS, reactive and proactive aren’t just different styles of CS work. They produce categorically different retention outcomes. Reactive support responds to problems after they’ve already cost the user time and patience. Proactive support intercepts friction before the user has to go looking for help, which is the difference between a solved problem and a forming resentment.
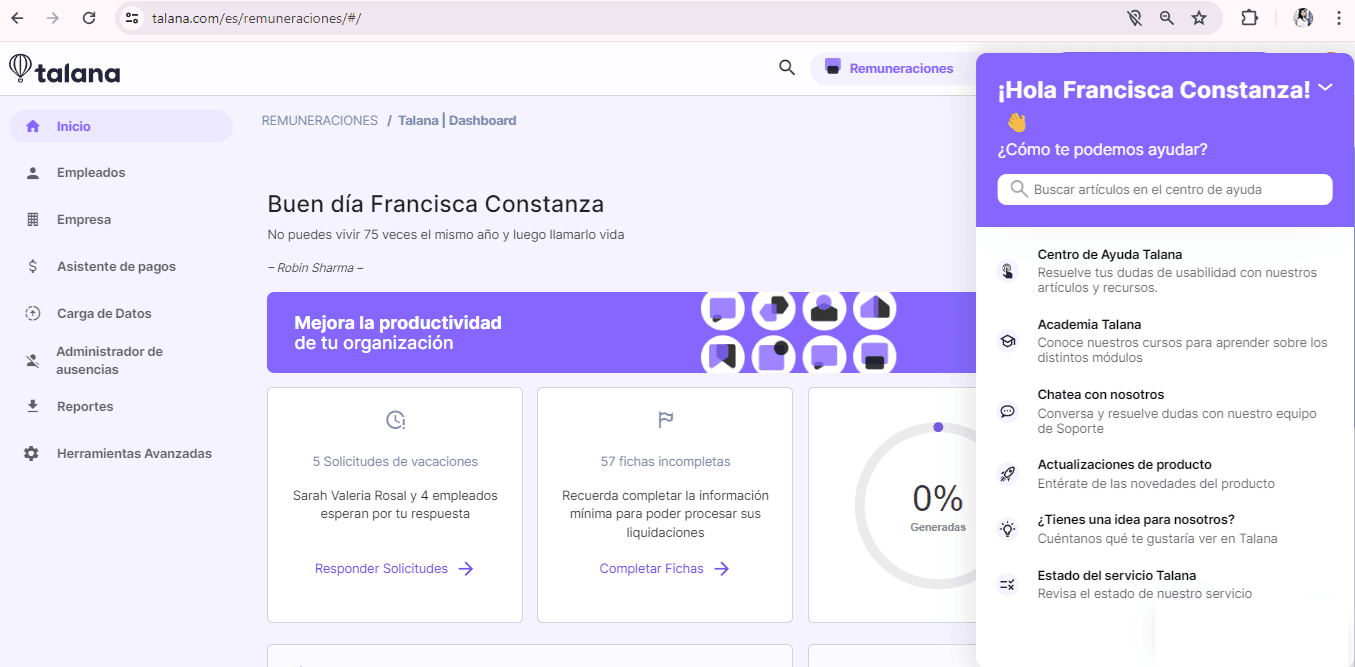
Talana built a resource center with tutorials and guides that users can access from within the product whenever they need it, without leaving their workflow or opening a new tab. Userpilot’s resource center builder makes this possible without engineering resources, and the ticket deflection impact is direct. In my experience, a well-placed tooltip on a confusing feature or workflow step removes follow-up support requests for that area almost entirely.
The philosophy I’d recommend to any team building this out: empower users to navigate and explore on their own, and design the support layer for the moments when they get genuinely stuck. You don’t want to overscript the experience with guardrails. You want the information to be there the moment a user needs it, so they never have to leave the product to find it.
Build a customer community that competitors can’t copy
A strong community around your product does something no feature can: it gives customers a reason to stay that goes beyond the product itself. Members support each other, share workflows, exchange resources, and build a sense of belonging that creates a kind of retention inertia, because leaving the product means leaving all of that behind too.
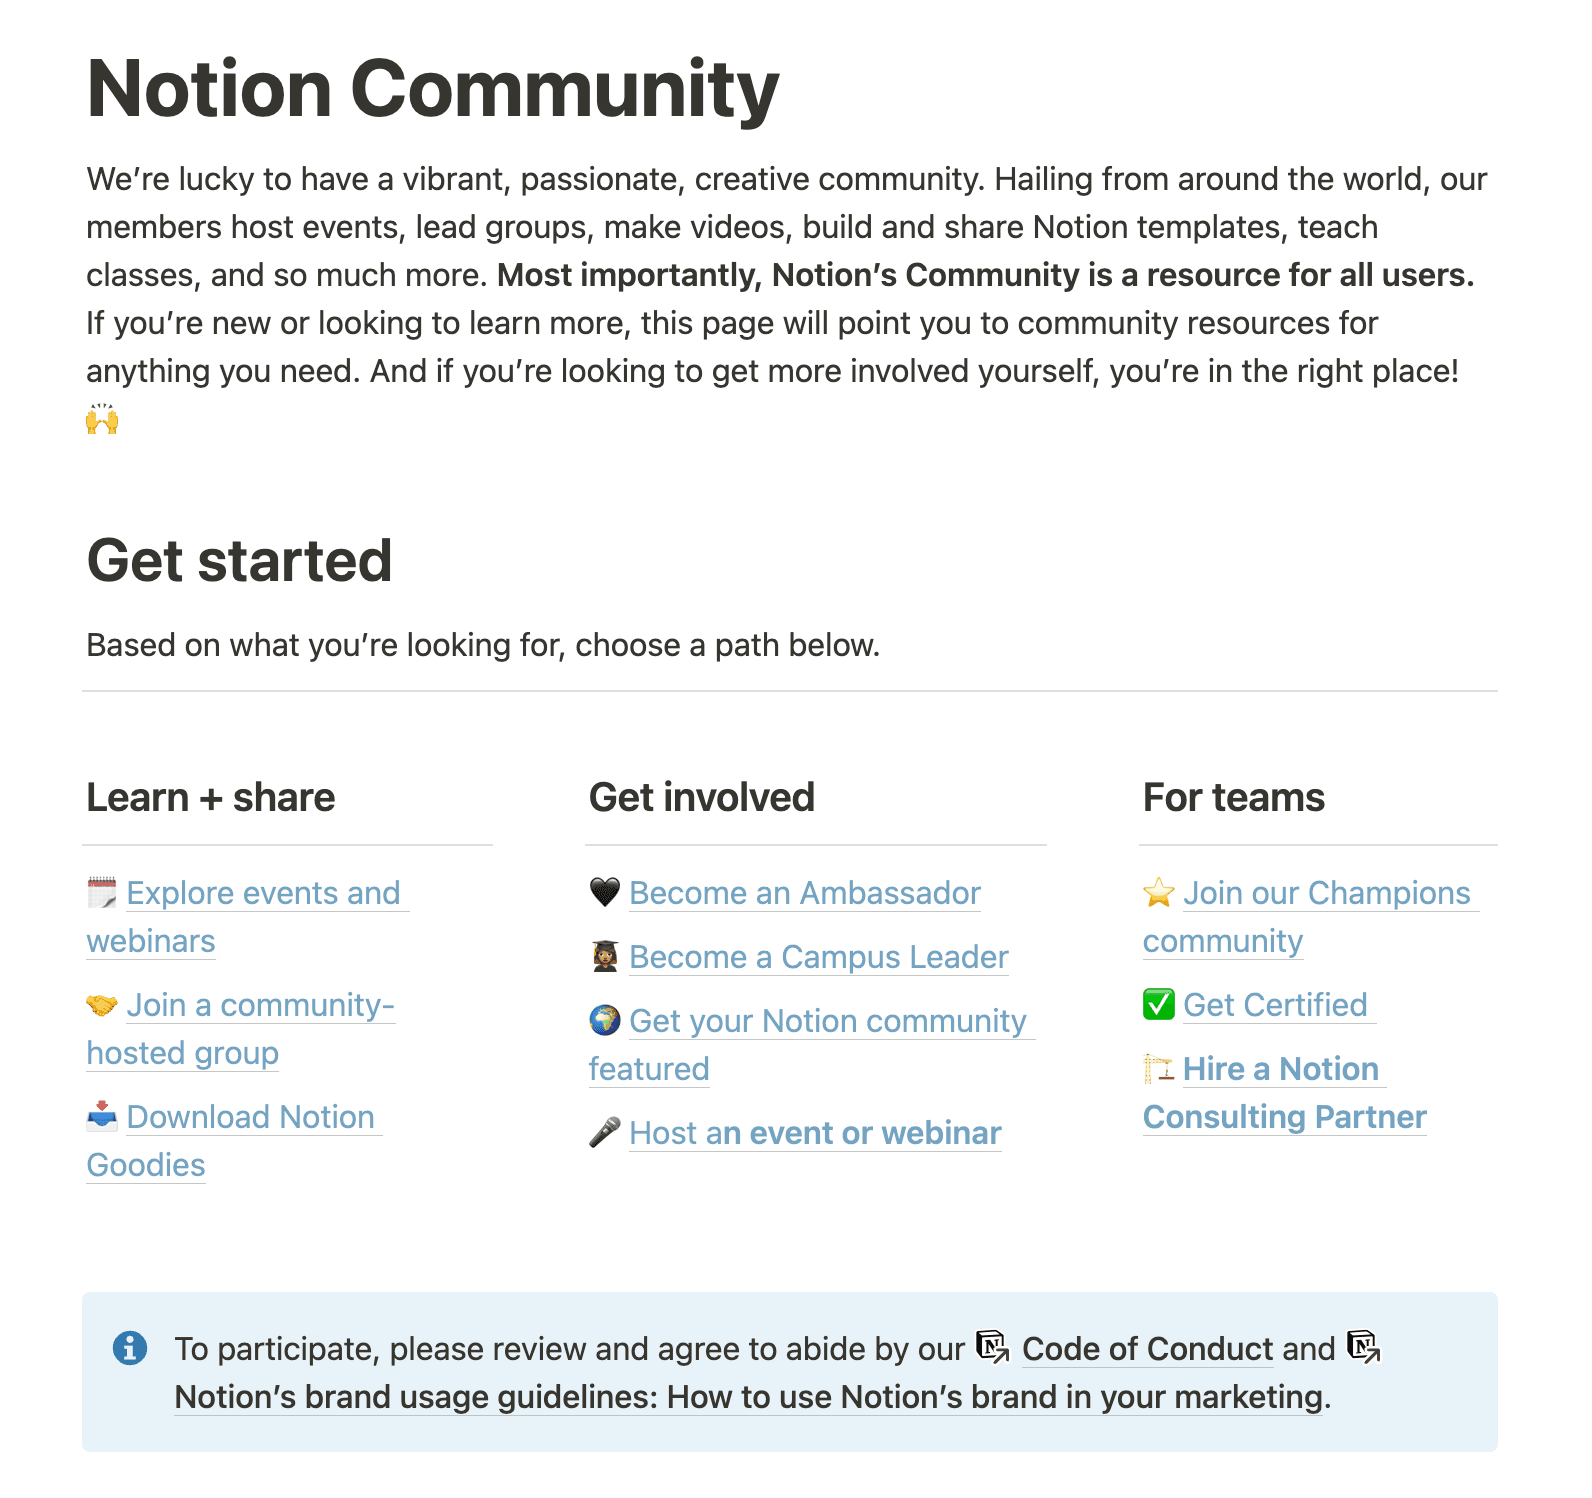
Notion’s community and Ambassador program is one of the best examples in SaaS. It combines user groups, events, certification programs, and shared resources into an ecosystem that reinforces why being a Notion user is worth something beyond what the product itself provides. Competitors can replicate features. They can’t replicate a community that has years of relationships and shared knowledge inside it.
Educate consistently and reward loyalty
Layer 3 churn is often an education problem in disguise. A customer who adopted the product for one use case and never discovered the others will eventually hit a ceiling on the value they see, audit that ceiling at renewal, and decide the ROI doesn’t justify the cost. Consistent customer education, webinars, in-product tutorials, and events that showcase advanced use cases, raises that ceiling before the audit happens.
Loyalty programs create a complementary mechanism for the customers who have already invested deeply. Mailchimp’s program for B2B customers, Mailchimp and Co, offers training, certification, and priority support, all benefits that help those customers get more out of the tool rather than just rewards for staying. That distinction matters: the best loyalty programs deepen competence, not just satisfaction.

Advocacy programs extend this logic outward. Apple’s Shot on iPhone campaign gives their most engaged users global exposure and a licensing fee in exchange for sharing creative work taken on their iPhones. The users who participate become advocates precisely because the reward is recognition of their work, not a coupon. That’s a Layer 3 move: making the most successful customers the most visible ones.
A/B test everything you think you know about retention
Retention strategies that feel right frequently aren’t. Running two versions of an in-product flow, re-engagement email, or onboarding path simultaneously, rather than sequentially, is the fastest way to learn what actually moves your specific users, rather than what the industry thinks should work. HubSpot’s newsletter test is a useful cautionary example: their hypothesis that left-aligned text would outperform centered text led to a 25% drop in clicks when they tested it. The intuition was wrong. The data caught it before the change was permanent.
A/B testing improves every strategy across all three layers, not just Layer 3. Running it consistently means the strategies you’re deploying are calibrated to your users’ actual behavior, not your team’s assumptions about it. Userpilot supports A/B testing of in-app flows directly, so the cycle from hypothesis to result doesn’t require engineering resources or a separate testing platform.
How Lia and AI feed every retention strategy in 2026
Every strategy above works better when it’s fed by real-time behavioral signals and executed at the right moment, not just on a schedule. That’s the gap AI fills in retention, not by replacing the strategies, but by making them smarter, faster, and less dependent on a CS team manually catching the right account at the right time.
The challenge I’ve watched grow with every CS team I’ve talked to is scale. Some of our customer success managers are responsible for over 100 accounts. They can’t go and look at what every account is doing every day, which means the customers who don’t come to them are equally important to follow up with, and the only way to know which ones need attention is to have something monitoring the signals continuously.
When a customer is coming to you and saying they don’t want to continue with the product, it’s already too late. It’s incredibly difficult to reverse that decision once it’s been made. Churn prevention has to come from earlier intervention, and the only way to do that early intervention at scale is if you have meaningful signals telling you when a customer is at risk and when they’re most likely to be receptive to outreach. Without those signals, you’re taking shots in the dark.
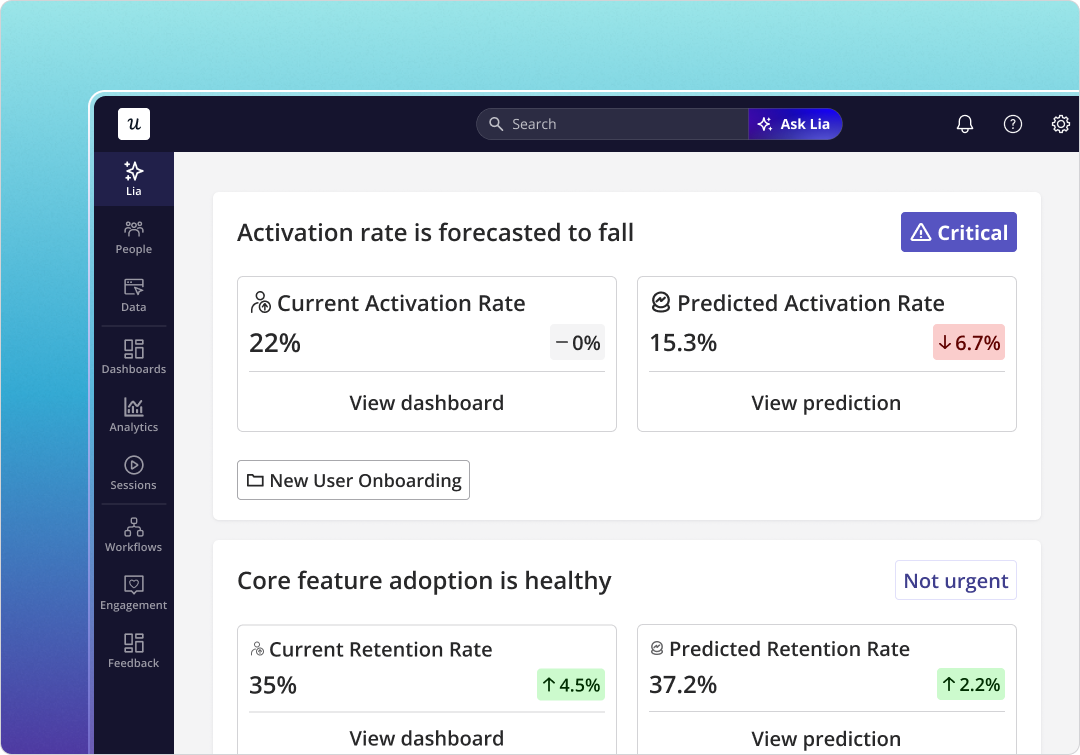
Lia, Userpilot’s AI agent, functions as the always-on monitoring layer that makes earlier intervention possible at scale. She tracks behavioral signals across all accounts, surfaces accounts that are showing warning patterns, and flags the customers who are actively trying to engage with a new feature and could benefit from a well-timed call. That last one is underappreciated: catching customers at a positive moment is as important as catching them before a negative one. A customer actively working through a feature they care about is a far better conversation than one who has already moved on from it after a mediocre experience.
Yazan Sehwail, Userpilot’s CEO, describes the shift this way:
“You’re no longer operating. The AI is operating. You’re just basically evaluating and monitoring the agent workflow.”
That reframe applies directly to CS. The monitoring and signal-detection work that used to consume hours of a CSM’s week gets handed to Lia, which frees the team to spend that time on the conversations and relationships that actually require human judgment. It’s a force multiplier, not a replacement. The goal is a CS team that can do more valuable work with the capacity they have, not a smaller one.
For accounts where AI agents are already the primary users, Userpilot’s Agent Analytics adds a new layer of retention signal: conversation logs, agent task completion rates, and satisfaction rates that tell you whether the AI workflows your customers are running are actually delivering value. In a world where a meaningful share of B2B SaaS traffic is automated rather than human, those signals are becoming as important as login data was a few years ago.
The teams winning at retention in 2026 aren’t the ones with the most CS headcount. They’re the ones who have given every strategy in this article an AI layer that makes it proactive rather than reactive, and scalable rather than heroic.
FAQ
What is customer retention?
Customer retention is your ability to keep existing customers using and paying for your product over time. In SaaS, that means keeping customers on active subscriptions, renewing at the end of each billing period, and ideally expanding their usage or plan over the course of the relationship. A high retention rate means fewer customers leave than you can afford to lose. A low one means you’re refilling a leaky bucket with every new logo.
How do you calculate customer retention rate and churn rate?
Customer retention rate for a given period: take the number of customers at the end of the period, subtract any new customers acquired during that period, and divide the result by the number of customers at the start of the period. If you started a quarter with 200 customers, acquired 30, and ended with 210, your retention rate is ((210 – 30) / 200) = 90%.
Customer churn rate is the inverse: divide the number of customers lost during the period by the number at the start. Using the same example, you lost 20 customers, so your churn rate is (20 / 200) = 10%. Revenue churn rate follows the same logic but uses MRR or ARR figures rather than customer counts, which gives a more accurate picture when your accounts vary significantly in contract value. Here’s a more detailed breakdown of how to calculate retention rate, including the nuances between gross and net revenue retention.
What is a good customer retention rate in SaaS?
According to the SaaS Capital 2025 benchmarks, median Net Revenue Retention for private B2B SaaS lands between 97% and 111% across mid-market ACV tiers, with top performers pushing above 120%. The right benchmark for your business depends heavily on vertical and customer segment: fintech companies tend to retain better than healthcare companies, and enterprise deals with high ACVs can sustain higher absolute churn rates than SMB-focused products, where each lost account hurts more. Userpilot’s own SaaS Product Metrics Benchmark Report provides vertical-specific benchmarks across a broader set of SaaS segments if you want a more precise comparison point.
If you want to find out how Userpilot can help you build and execute customer retention strategies at every layer, from activation through expansion, book a demo with our team.
About the author