
What user onboarding metrics should you track if you want to evaluate your onboarding processes?
We all know that successful onboarding, as well as mobile onboarding, is especially important for SaaS companies since they depend on a subscription-based business model. It should be able to make users understand your product’s value so that they continue using it by investing their money.
Tracking the metrics helps you improve your onboarding process and retain more customers.
So let’s see what these metrics are and how you can leverage user onboarding analytics to optimize them.
Try Userpilot Now
See Why 1,000+ Teams Choose Userpilot

Key metrics and KPIs to measure user onboarding success
Let’s look at the 10 key metrics and KPIs you should use to measure the success of your user onboarding process.
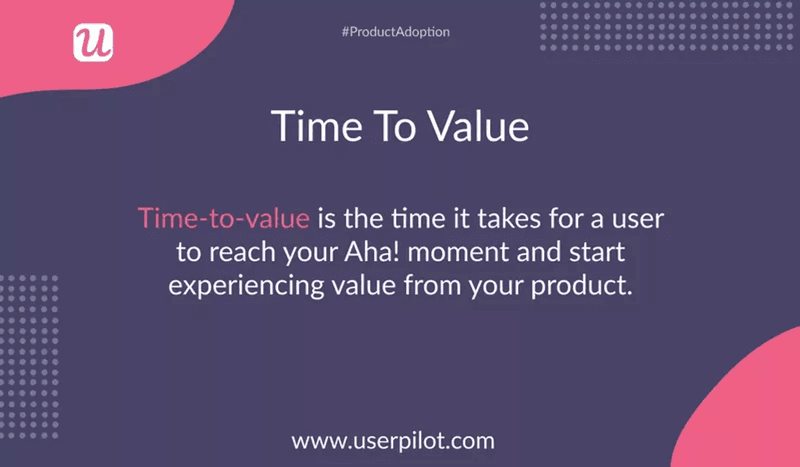
Time to Value
For SaaS companies, time to value (TTV) is the time taken by a user to recognize the value of your product. This happens when a user reaches the Aha! moment (i.e. realizes your product’s expected value and starts experiencing that value).
TTV is a subjective metric since you have to first define what ‘value’ means to your customers.
So before you track the time to value, you should identify the value your product can deliver. Understand why users have decided to try your product and understand their goals. The answer is the Aha! moment your primary onboarding should focus on.
Your time to value should be as short as possible. A short TTV suggests there’s little friction in your primary onboarding, thus creating a good first impression on new users. Your trial-to-paid conversion rates will improve as a result.
User activation rate
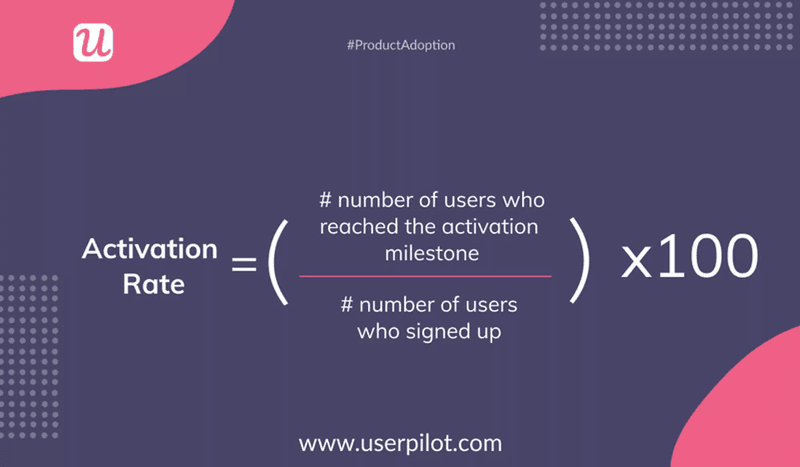
The user activation rate is the percentage of users who have reached the predetermined activation points within a specific period. These activation points are key indicators of long-term retention.
Every product has its unique activation milestones, so decide on yours based on the features new users have to interact with to ‘get’ your tool.
To calculate the activation rate, divide the number of users who reached the activation point by the total number of users within a specific period, and multiply the ratio by 100.
Tracking this metric allows you to understand how effectively your onboarding flow can help users navigate your product and achieve their goals. The better you optimize your product to help users reach these milestones, the more users you’ll retain.
Time to complete onboarding
Onboarding should focus on demonstrating value and getting the results as quickly as possible. Users will remain in the onboarding phase until they are able to apply your product in their workflow independently.
To measure the time to complete onboarding, calculate the number of days it takes a user to complete the process. This metric will give you an overview of your performance.
You can improve your completion rate by collecting customer data upfront to provide personalized onboarding.
Product adoption rate
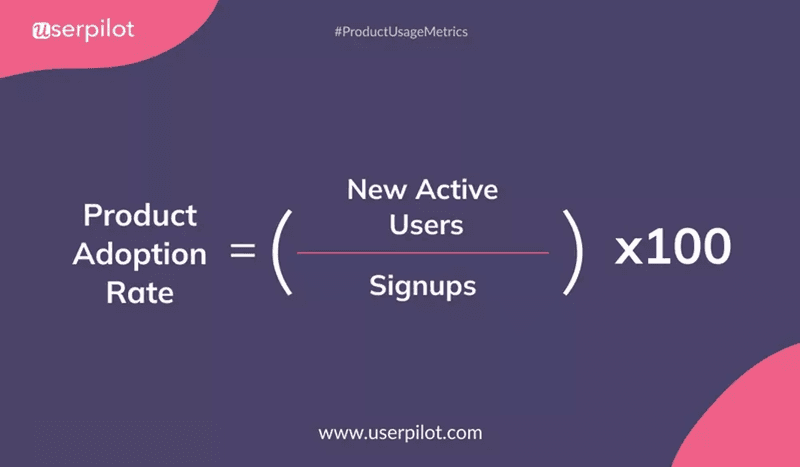
The product adoption rate measures how often and effectively your customers use your product. To calculate this metric, find the ratio of the number of new active users to sign-ups, and multiply by 100.
Product adoption is the end result of the user onboarding process. You can think of it as the opposite of churn because adoption takes place when customers stick to you and stop searching for alternative solutions.
Therefore, it’s crucial to look at the product adoption journey to segment customers according to their level of adoption. Early adoption signifies your onboarding is effective. Similarly, poor product adoption is a sign that you’re not doing something right.
Product stickiness
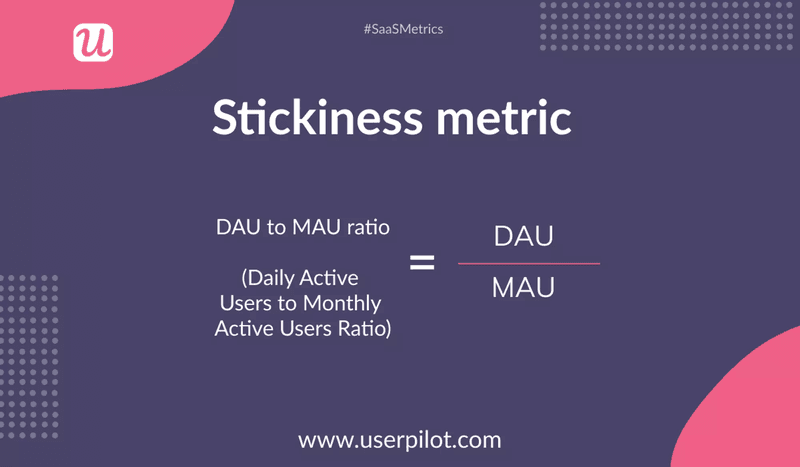
As mentioned earlier, customers who have adopted your product completely are more likely to stick with you longer. Thus, product stickiness can be defined as the tendency of customers to keep coming back to your product because they find it valuable and engaging.
(If you’re wondering, adoption precedes stickiness – customers have to use your tool first and find its value before deciding to become regular users.)
You can measure the stickiness metric by dividing the number of daily active users by the number of monthly active users.
A more engaging onboarding flow makes users interact with your product more actively, increasing stickiness. High product stickiness helps businesses use their product as a selling point and achieve product-led growth.
Furthermore, high stickiness means it will be easier to offer even more value to customers through cross-sells, upsells, and add-ons. This, in turn, will increase your monthly recurring revenue.
Number of support tickets
The number of support tickets tends to increase as businesses scale up and gain more customers.
People generally think of two solutions when support tickets begin to rise: hire more support reps or automate customer support. While both options can work, a better alternative is to reduce the number of tickets you’re getting.
How?
Begin by understanding a huge number of tickets indicates the presence of friction points. So, dig into the support tickets and try to categorize them. Pinpoint and address recurring complaints through in-app messaging or a resource center. For instance, if customers keep complaining that they can’t use a specific feature, you could create and embed a tutorial that helps them (and incoming users) do that.
Trial to paid conversion rate
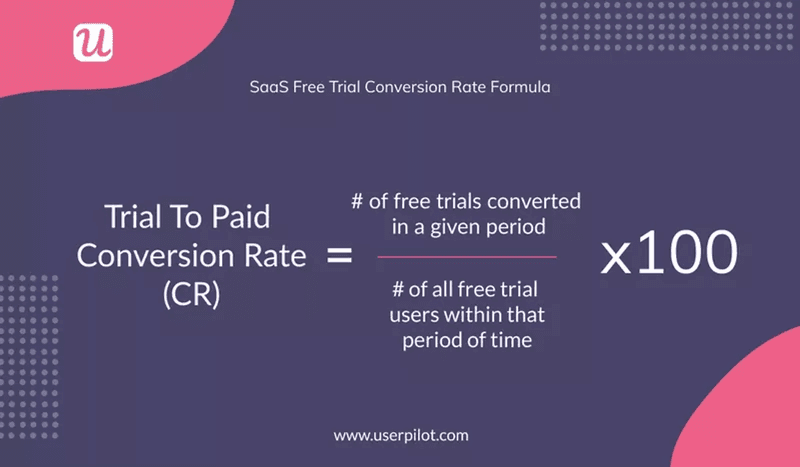
The trial-to-paid conversion rate, also called the free trial conversion rate, is the percentage of free trial users who become paying customers.
To measure this metric, divide the number of free trial users who converted in a given period by the total number of trial users during that period and multiply the result by 100.
An effective free trial run should leave users realizing that they can’t afford to go back to doing things without your application. For that, the free trial offerings should be completely aligned with the users’ goals.
This is where onboarding has a crucial role to play. As long as the onboarding succeeds in making users see a match between their expected value and your product offering, you should be good to go.
Customer Retention Rate
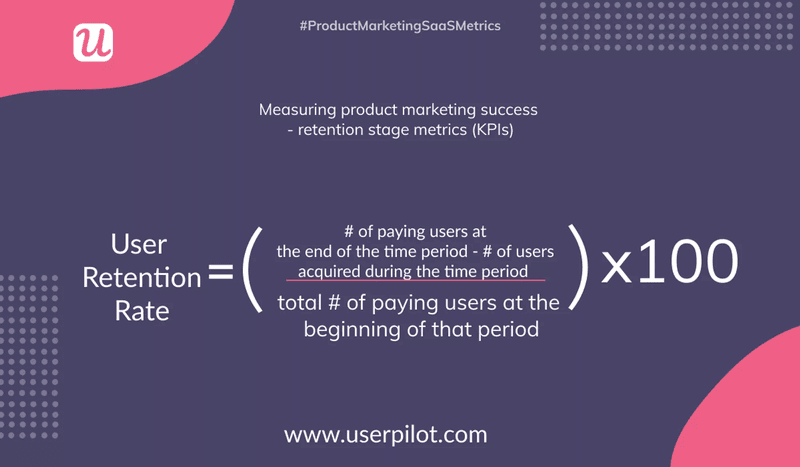
One of the best indicators of your onboarding’s success is the customer retention rate. The better your onboarding is, the more customers are likely to renew their subscriptions.
To measure the retention rate, first, find how many users you acquired during a given period and subtract it from the number of paying users present at the end of that period. Then divide this number by the number of paying users at the period’s start, and multiply the value by 100.
The retention rate is a critical metric because SaaS businesses are heavily reliant on the subscription-based model. Together with the customer churn rate, this metric offers visibility into the renewal rates of your business.
Furthermore, the retention rate enables you to make better predictions of the renewal rates and earnings of your business. A low figure suggests a poor customer satisfaction rate.
Customer Effort Score
The customer effort score (CES) is a metric that tells you how easily customers can interact with your product. Such interactions can include engaging with a feature for the first time, reaching a milestone, or contacting customer support.
Onboarding should smoothen the customer journey so that users can find value easily. If users need to put in a lot of effort in using your product, they are less likely to convert to paid customers or renew their existing subscriptions.
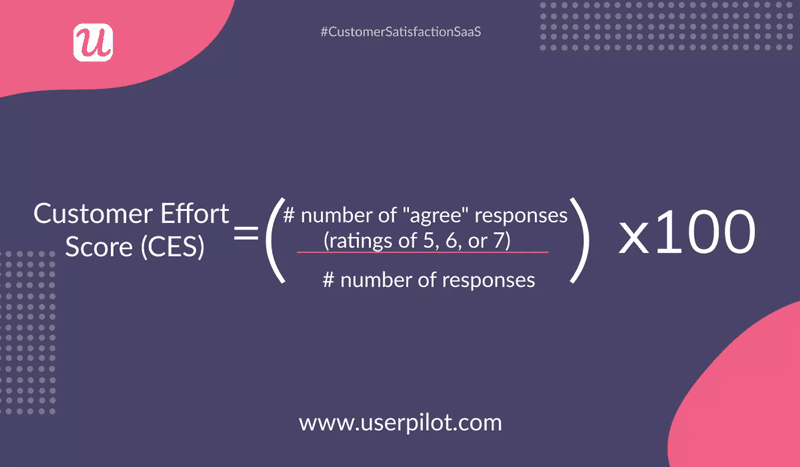
You need to conduct a CES survey to find your customer effort score. This is where you ask customers to rate their perceived effort in completing an activity on a scale from 1 to 7 or from ‘strongly disagree’ to ‘strongly agree’.
Your CES is the number of ‘agree’ responses (ratings of 5, 6, or 7) divided by the total number of responses, multiplied by 100.
Customer Satisfaction Rate
You should track customer satisfaction regularly, but it’s particularly important during the onboarding process. Ultimately, your onboarding efforts will be in vain if they fail to satisfy customers.
Therefore, you should collect user feedback from a variety of surveys, such as the customer satisfaction survey, CES survey, and more. These are microsurveys to be sent after completing onboarding to learn about your customers’ experiences.
These surveys will give you a clear picture of what your onboarding flow lacks and improve them accordingly.
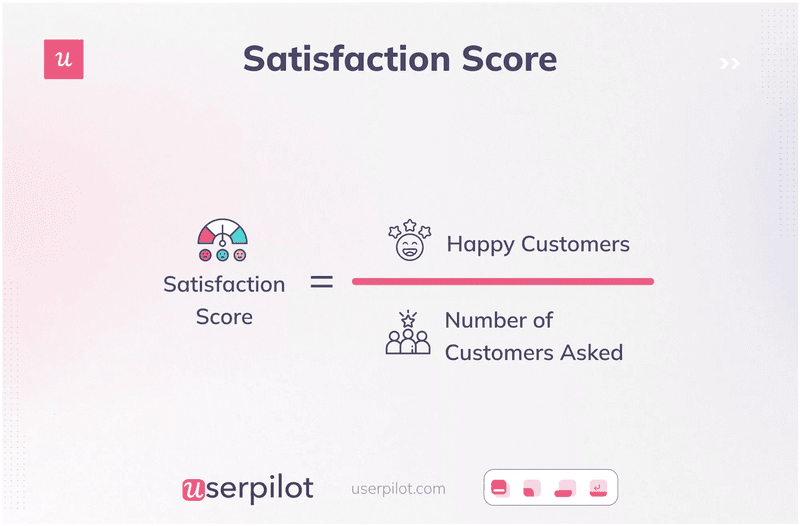
To find your customer satisfaction score, divide the number of happy customers by the number of customers asked.
How to collect user onboarding analytics to optimize your onboarding flow
Here’s how you can collect user onboarding analytics to improve your in-app onboarding process and mobile onboarding flow.
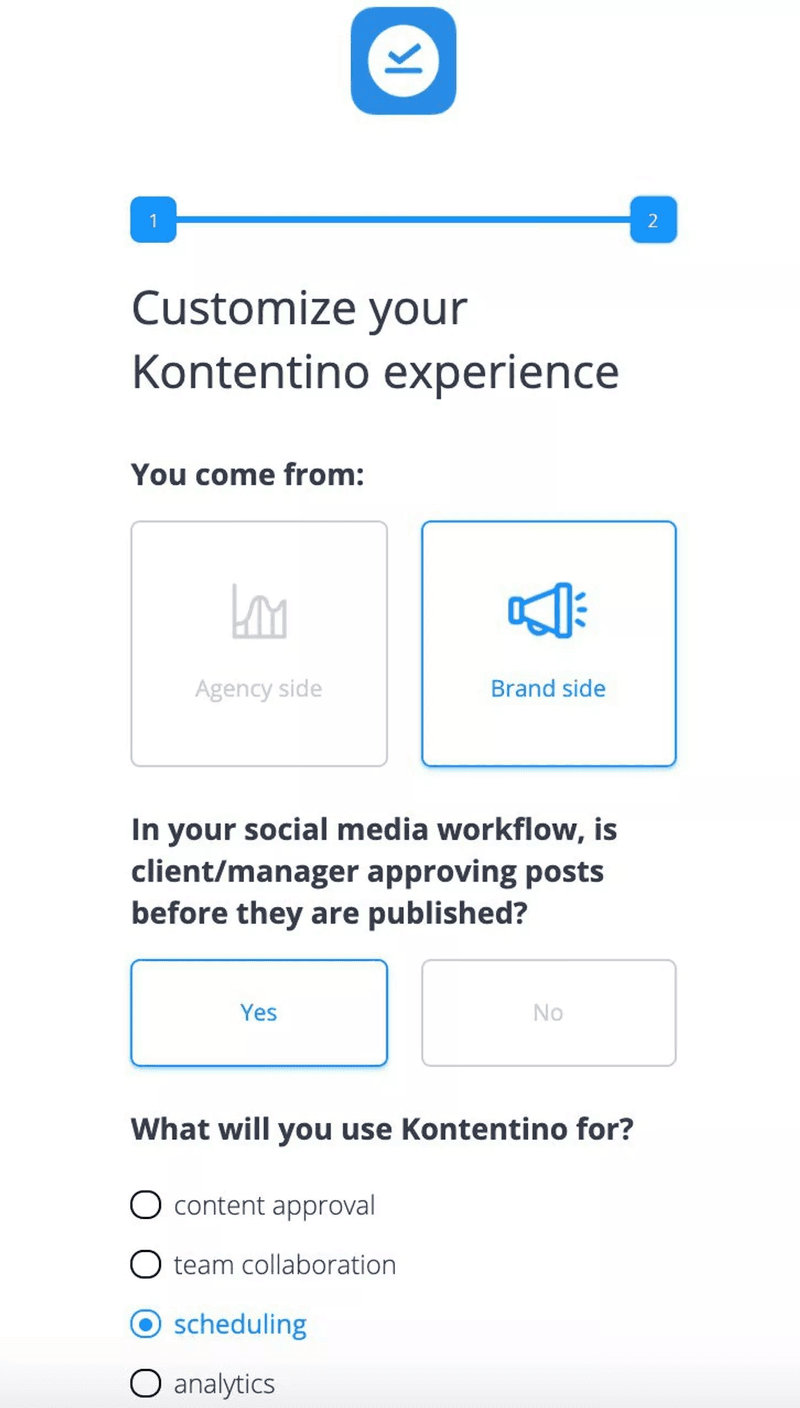
Use welcome screens to capture customer data from the beginning
Welcome screens are your first step in collecting user data for analysis. You can use them to not only greet customers but also gather information on their goals, jobs to be done, company size, and more.
This information allows you to segment customers based on shared characteristics and personalize their onboarding experience.
Create checklists and drive users to the activation point and track progression
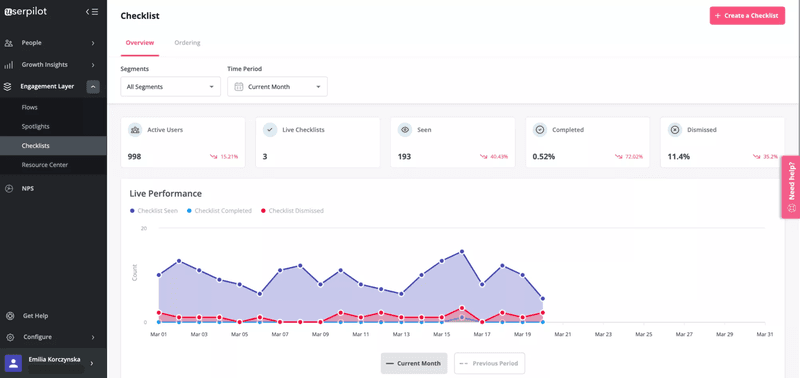
Build onboarding checklists containing a simplified breakdown of the most important tasks that users need to perform to reach activation. You can then access analytics to know which customers have completed all the activities and how much the rest of them has progressed.
Checklists let you personalize onboarding. If customers are stuck at any step or skipped a task, you can trigger the checklist once more to encourage them.
Track in-app feature usage to understand where the friction comes from
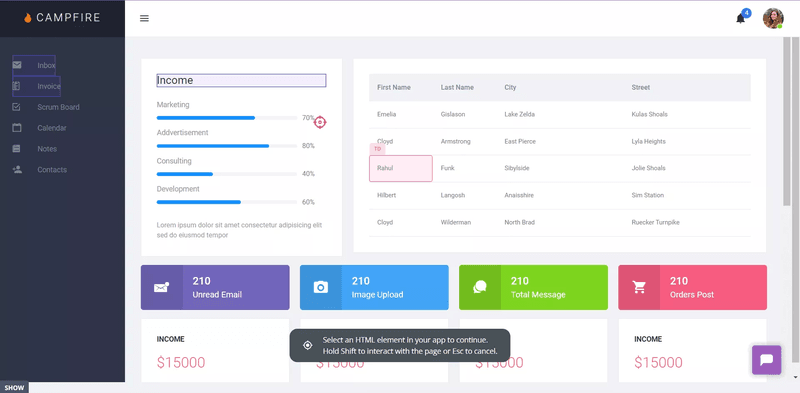
Tracking user interactions allows you to focus on what makes customers stick to your product.
For example, tracking in-app feature usage will reveal your most popular features and highlight the weak ones so that you can try to understand the underlying issues.
With Userpilot, you can track actions like hovers, clicks, and text inputs to gain more insights.
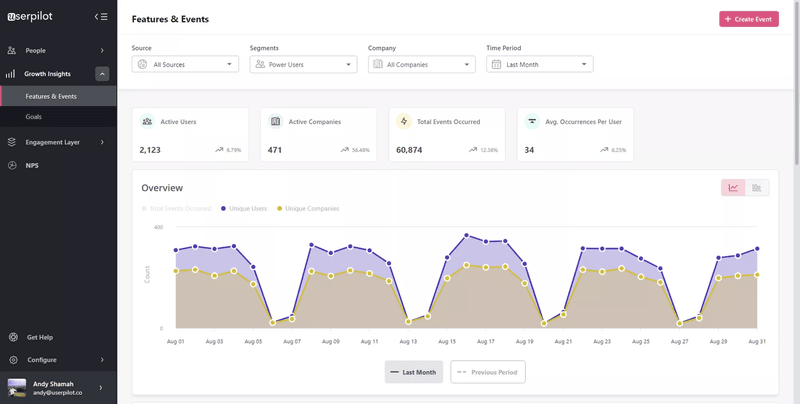
Combine all that data to analyze how your onboarding process impacts the overall product usage. For instance, the image below gives an overview of power users for one month.
Offer in-app self-service and detect where customers get stuck
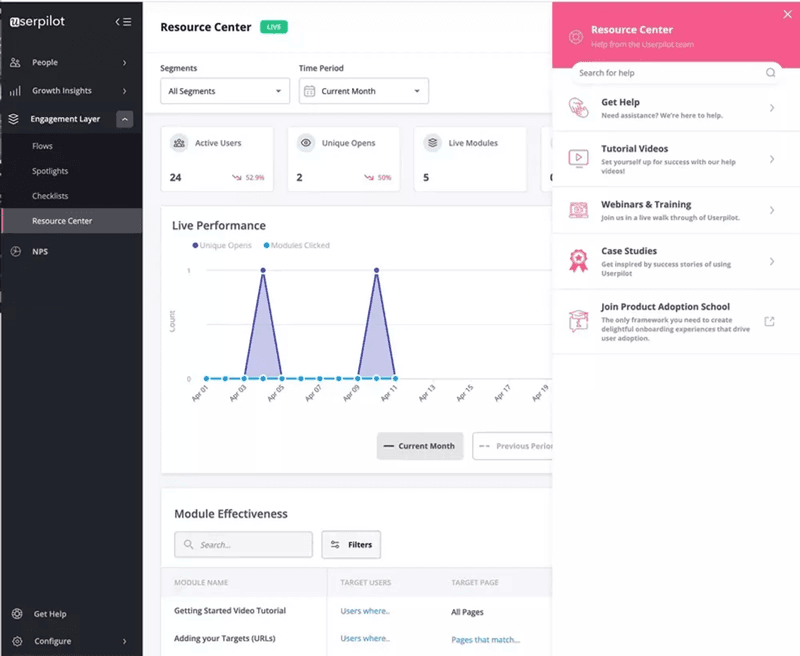
One effective way of reducing support tickets is providing self-service support to customers so that they can solve repetitive or simpler issues on their own. A help center, including a link to the knowledge base, will allow users to get quick solutions to their problems.
Make the help center visible to users by emphasizing it across all touchpoints. What topics do users often browse through when they need the most help? Who is visiting the knowledge base, and how often?
Use detailed analytics to answer these questions and understand how users engage with each module. This way, you can figure out the types of support people use in different circumstances and try to automate some of them.
Wrapping it up
You should know how your onboarding efforts are panning out so that you retain more customers and don’t waste money on the wrong resources. Successful onboarding is critical to making your product a selling point and growing your business.
Want to start optimizing the key user onboarding metrics? Get a Userpilot demo and improve your user onboarding strategy code-free.


