Stop Churn Before It Happens with Userpilot Product Analytics
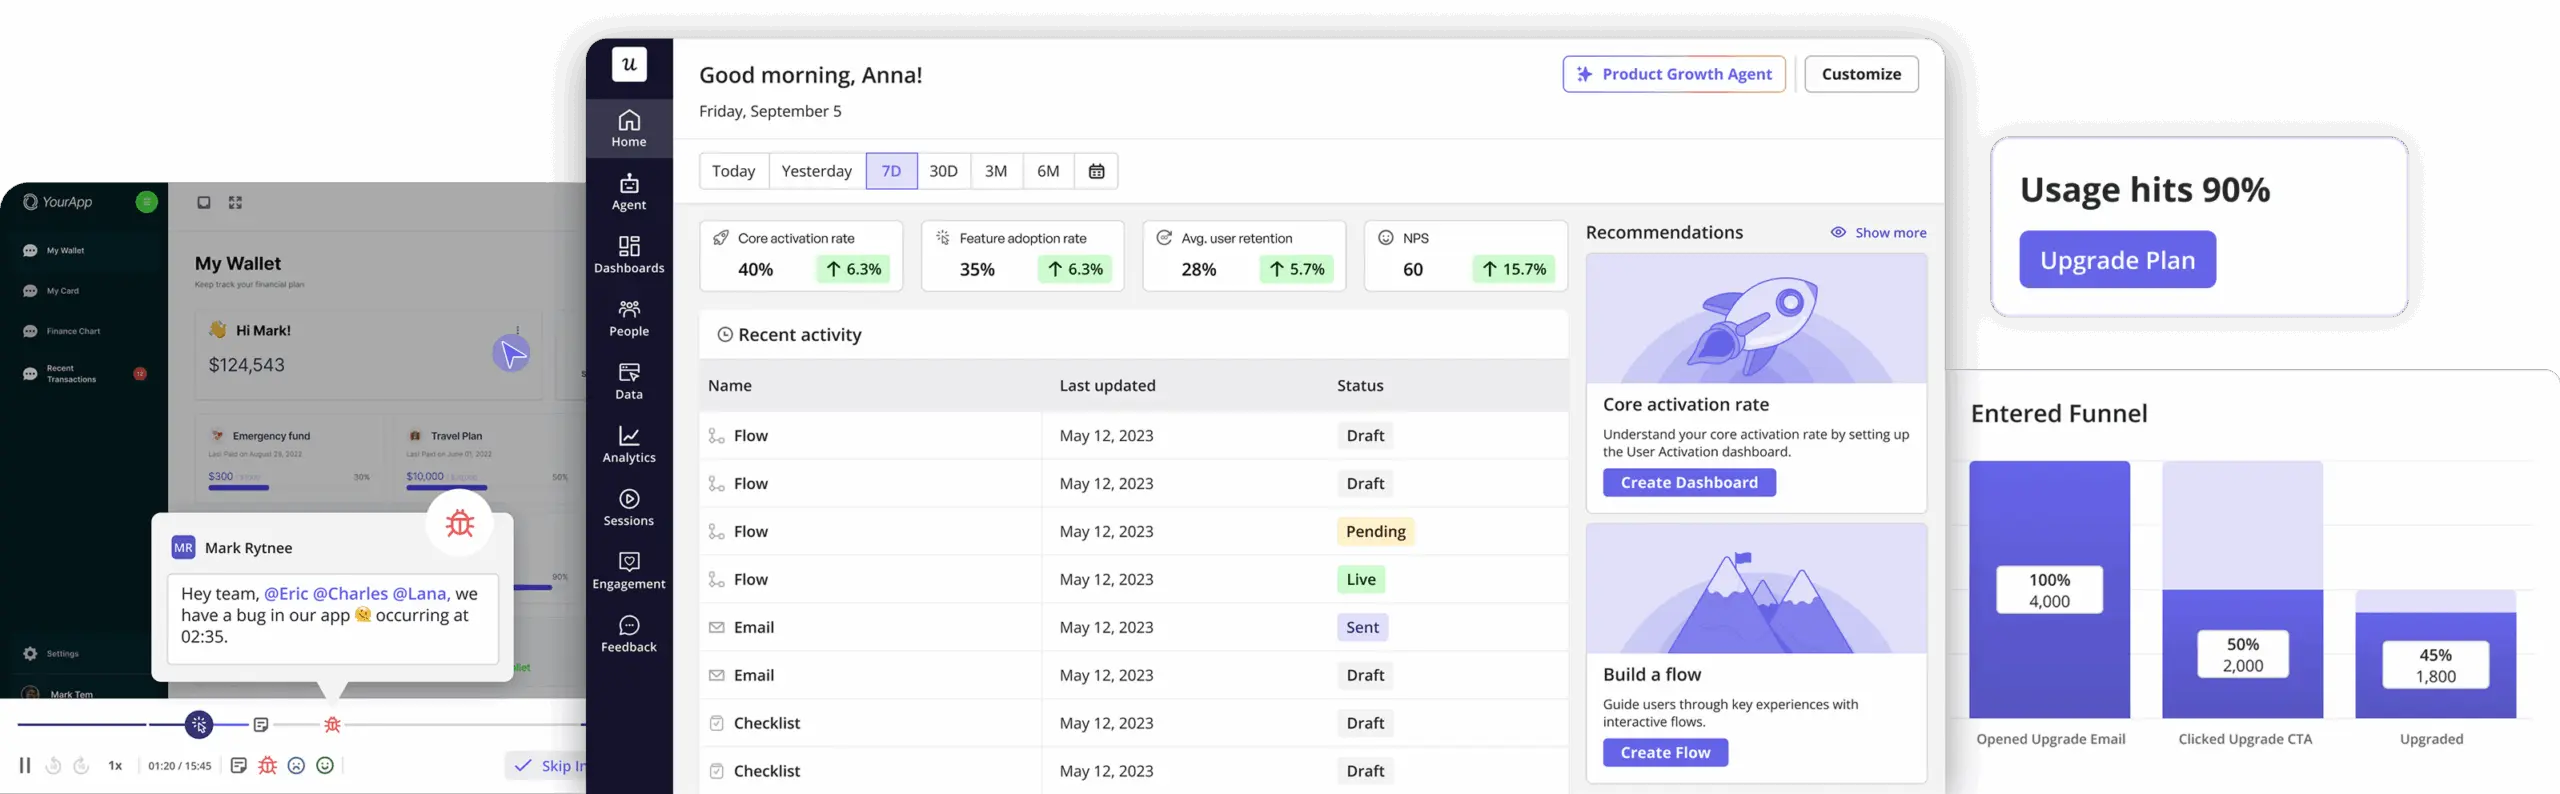
Monitor account health scores in real-time
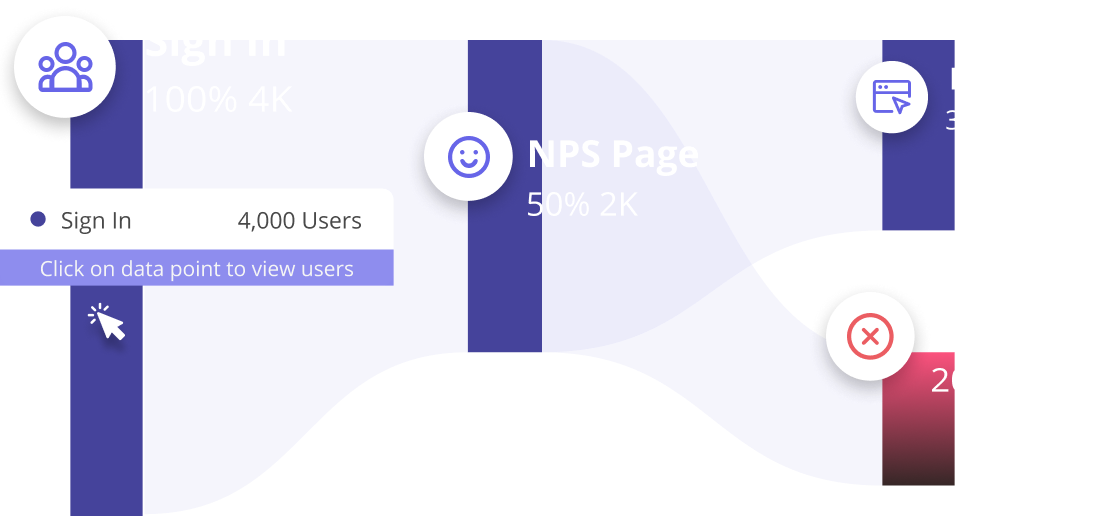
Identify friction points that lead to drop-offs
Launch retention flows to at-risk segments
Measure the impact of your fixes on user longevity
Join 1,000+ companies that are Accelerating Product Growth with Userpilot