From Qualitative Data to Product Wins: How SaaS Teams Collect And Use It


If you’re here, you’ve probably got a familiar mess on your hands: interview notes in one doc, NPS verbatims in another, support tickets in Zendesk, sales call snippets in Gong, G2 reviews on the side and five stakeholders asking for five different “quick wins.” You know qualitative data has the “why,” but turning those words into clear product decisions (that you can defend) is slow, noisy, and political.
From my experience working as a product manager for the last few years, I have built a simple, repeatable system that turns qualitative signals into roadmap moves we can measure and stand behind.
Why am I writing this? Because qualitative can feel soft, and it isn’t. When you collect it intentionally, tag it consistently, and connect it to product usage, it becomes your sharpest tool for prioritization. In this article, I’ll show you the exact product analytics approach we use.
What is qualitative data, really?
At its core, qualitative data is information that isn’t numbers. It’s descriptive. It comes in words, observations, feelings, and concepts. Instead of measuring “how many” or “how much,” it explores “why” and “how.” For us in product design, this is gold. It helps us understand the messy, human reasons behind user actions.
For example, a user telling us in an interview, “I felt lost after that pop-up; it just appeared out of nowhere,” is qualitative data. It tells us about their experience and their emotions. If that pop-up also had a low conversion rate (quantitative data), the qualitative insight explains why. This type of data helps us refine everything from our onboarding flows to our feature designs, ensuring we truly connect with users.
Why qualitative data matters in product design
Qualitative data shows how users think, feel, and interact with a product. It helps teams set clear research objectives and replace assumptions with real insights. When combined with quantitative methods, it creates a more complete picture of user behavior.
Here’s why it’s invaluable for us.
- Uncovers the ‘why’ behind the ‘what’: Quantitative metrics tell us what users are doing, maybe they’re dropping off a certain step in our conversion funnel. Qualitative data, gathered through direct feedback or observation, tells us why that drop-off is happening. It could be unclear navigation, missing context in onboarding, or a feature working differently than expected.
- Informs personalization: Understanding user preferences, motivations, and the language they use allows us to create personalized customer experiences. This is vital for delivering contextual in-app guidance and tailored onboarding experiences.
- Reveals unspoken needs: Sometimes users don’t even know how to articulate their problems. Through careful observation and open conversations, we can identify unspoken needs or pain points that quantitative data alone might miss. This leads to developing truly delightful products.
- Validates quantitative findings: Qualitative insights act as a check on metrics. They are valuable for validating data because they confirm patterns or reveal inconsistencies. This step gives us a more complete understanding instead of relying on numbers alone.
Types of qualitative data you’ll encounter
When we talk about qualitative data, we often break it down into a couple of broad types that help us categorize what we collect:
Nominal data
This is data used for naming or labeling things without giving them a numerical value or order. Think of it like categories. For instance, in our product, we might classify user roles as “Admin,” “Editor,” or “Viewer.” Or perhaps a survey asks about a user’s operating system: “Windows,” “macOS,” or “Linux.” There’s no inherent rank, just distinct groups.
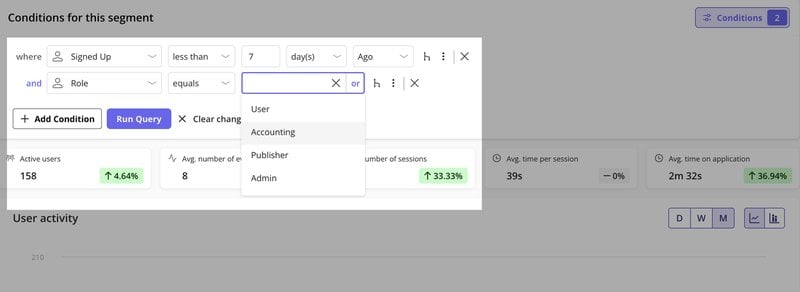
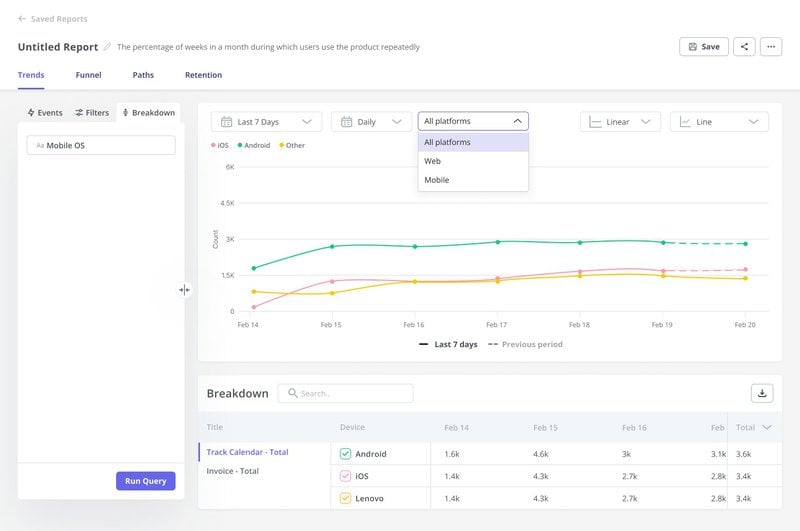
You can track product behavior, lifecycle stage, and custom events, then build segments like Admins who signed up in the last 7 days or Editors who use a feature weekly.
These segments plug straight into your in-app flows or surveys, so you can act on qualitative insights without extra tools.
Ordinal data
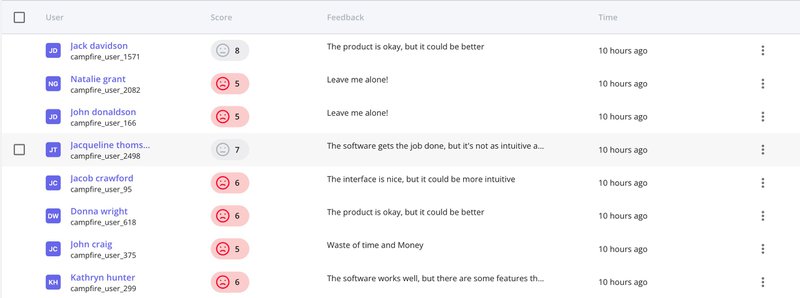
This type of data has a clear order or a scale, but the difference between each category isn’t necessarily equal or measurable. A perfect example is a Net Promoter Score (NPS) survey where users rate their likelihood to recommend on a scale of 0-10. A “9” is better than a “7,” but the jump from 7 to 8 isn’t necessarily the same “amount” of improvement as from 9 to 10. We use this to understand customer sentiment. Segment users by score and feedback, then send those segments into cross-channel marketing flows without a customer data platform.
Each score links to the exact comment, so a 7 might be “took too long to set up,” and an 8 could be “love it, but waiting on dark mode.” The numbers stop being abstract and start telling you exactly what to improve.
Binary data
Binary data is the simplest form of categorical data, as it has only two possible values. In qualitative research, that usually means “yes” or “no,” “true” or “false,” “present” or “absent.” For example, in a customer feedback survey, binary data might capture whether a user has tried a new feature (yes/no) or whether they would recommend the product (yes/no).
In qualitative analysis, researchers sometimes use binary coding to mark whether a particular theme or concept appears in a transcript, interview, or set of field notes. This makes it easier to compare the presence or absence of specific themes across multiple responses.
Binary responses can also inform follow-up research. If many respondents answer “no” to an important question, researchers may conduct interviews or focus groups to explore the reasons behind those responses.
In this way, binary measures can work alongside qualitative methods to add clarity and direction for the next steps.
My go-to qualitative research methods
Collecting qualitative data requires different research methods than simply logging events. It’s about listening, watching, and asking the right survey questions. Here’s how we approach it and how Userpilot supports this work:
1. Interviews and focus groups
Direct conversations are gold in qualitative research. We conduct one-on-one interviews with users, especially when we’re trying to understand complex workflows or uncover the root cause of a problem.
Sometimes we run customer discovery interviews to validate a new feature idea. We also run focus groups, which let us observe group dynamics and shared perceptions. Both are essential qualitative methods. The goal is to encourage open dialogue and ask open-ended questions that let users tell their story.
While Userpilot doesn’t host live interviews, it helps us identify who to interview through user segmentation. We can segment users who have shown specific behaviors, such as dropping off at a certain point or using a new feature extensively.
This helps us collect relevant data and ensures our interview subjects are tied to the problem we’re studying. This targeted data collection method makes qualitative data analysis more accurate and valuable.
For example, my UX research fellow at Userpilot struggled to recruit B2B participants for usability tests through email due to low response rates. She switched to in-app surveys targeting users already engaging with the relevant feature. Within days, she secured 19 participants, nearly four times her goal, accelerating her research without delays.

2. In-app surveys
Surveys let us capture qualitative data directly in the product, without disrupting the user’s workflow. In-app surveys provide context-rich feedback at scale, making qualitative data analysis faster and more actionable.
- NPS surveys: We send NPS surveys to measure customer loyalty and segment detractors, passives, and promoters. Userpilot lets us add follow-up questions based on scores, so we collect relevant data that links ratings to specific qualitative feedback. This improves both qualitative analysis and data analysis.
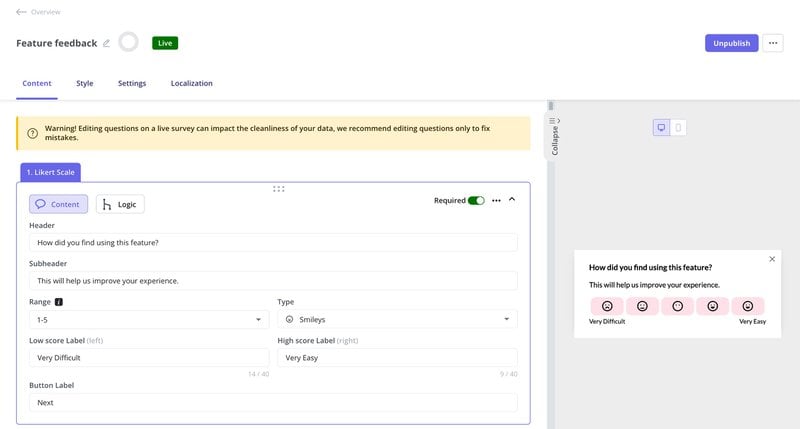
- Feature feedback surveys: After a user interacts with a new feature, we might trigger a quick feature feedback survey asking about their experience. Userpilot’s forms feature allows us to embed open-text questions directly within our product flows, capturing insights right at the moment of use.
- Onboarding surveys: To understand how well our product onboarding is performing, we deploy onboarding surveys to new users.
Observation (like session replays)
Watching users interact with our product is another powerful way to gather qualitative data. Unlike surveys, where users tell you what they think they do, observation shows you what they actually do.
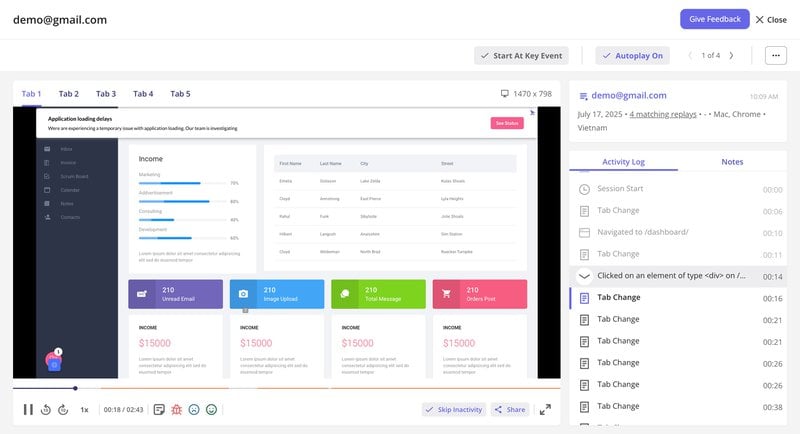
We use session recordings extensively for this. Our session replay tool lets the researcher collect data directly by watching anonymized user sessions, seeing where they get stuck, click repeatedly (rage clicks), or navigate away.
This visual context supports qualitative and quantitative data analysis, helping us understand interaction patterns and refine our research design.
Alongside replays, our user behavior analytics tools automatically track interactions as part of our data collection process.
These insights help us spot common patterns and make informed product design decisions backed by both qualitative and quantitative approaches.
Customer support interactions
Every support ticket, live chat, or call is a rich source of qualitative data for qualitative research. These conversations give qualitative researchers direct access to the data sources, customer pain points, common questions, and friction in the product experience.
We encourage our customer success and support teams to record details thoroughly as part of our qualitative data collection methods. Userpilot integrates with CRMs like HubSpot and Salesforce, allowing us to sync user data and see their engagement history alongside their support queries.

My qualitative data analysis process to collect insights
Collecting data is only half the battle; the real work begins when we analyze it. Unlike quantitative data, which often lends itself to statistical analysis, qualitative data requires a different approach. Our process usually looks like this:
- Transcribe and organize: First, we transcribe interviews and consolidate survey responses. For session replays, we use Userpilot’s ability to tag moments of user frustration or “wow” moments directly in the recording.
- Coding and thematic analysis: We read through the qualitative data, looking for repeating ideas, feelings, or actions. This involves “coding” sections of text or observations with relevant tags. Then we group them into themes for in-depth analysis. For instance, repeated comments about a feature being “confusing” or “hard to find” can be categorized as “usability issues with navigation.”
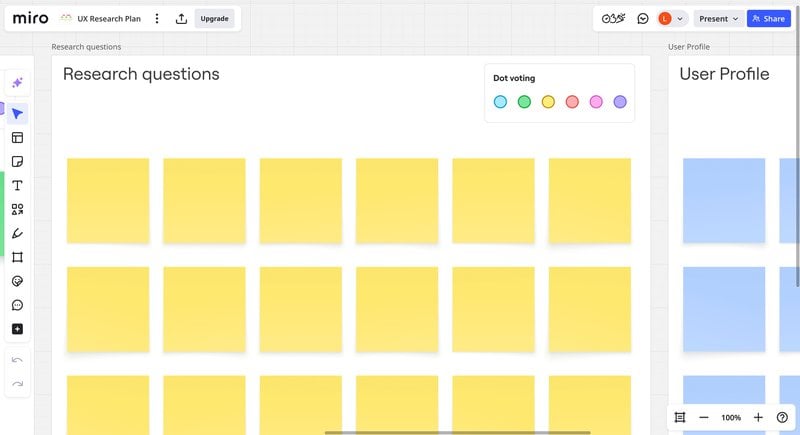
- Synthesize and interpret: From these themes, we ask: What do they reveal about the user experience? How do they connect to our quantitative data? If funnel analytics show a drop-off and qualitative feedback points to confusion, we’ve found a clear design improvement area. I use Miro or MURAL to group related insights on virtual sticky notes and spot patterns before moving to solutions.
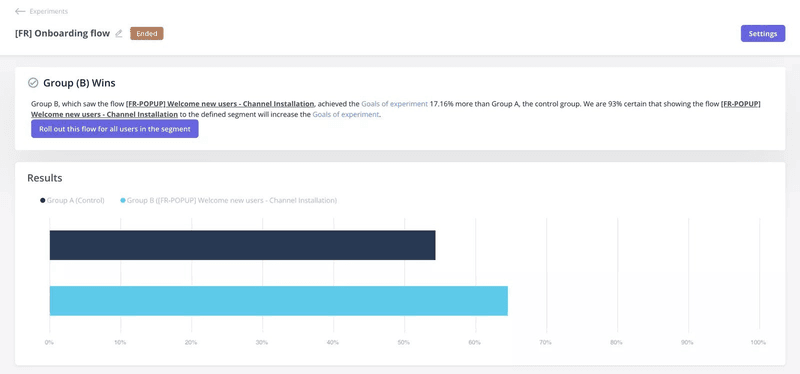
4. Validate and iterate: Then, we form hypotheses from these insights. If research shows drop-offs at a step, we might hypothesize: “If we add better guidance here, completion rates will rise.” With Userpilot, you can implement in-app guidance (e.g., tooltips, checklists) and run A/B tests to confirm impact.
One of our customers, Smoobu, applied this same process when they identified friction during channel connection. By adding an onboarding walkthrough and A/B testing it in the French market, they increased channel connections by 17%. Localization, session replays, and other documentation methods also helped them fix bugs and support users in ten languages.
Potential pros and cons of qualitative data
Qualitative data can uncover insights you’d never see in analytics, but without proper data validation, it can easily mislead you. So, before you dive in, it’s worth weighing the pros and cons so you know when qualitative data will help.
Pros of qualitative data
✅ Rich insights: Qualitative data collection captures emotions, opinions, and motivations that quantitative research often misses.
✅ Real customer language: Helps you understand how customers talk about problems, which improves communication and onboarding.
✅ Flexible research: Interviews, focus groups, and open-ended surveys adapt to each conversation.
✅ Early-stage value: Ideal for testing new product ideas or exploring market needs before launch.
✅ Supports product development: Analyzing qualitative data can highlight usability issues, feature requests, or pain points that may not show up in analytics.
When qualitative data is useful:
- Early stages of the research process to explore new ideas.
- Understanding customer motivations before launching a product or campaign.
- Testing concepts in mixed methods research to add depth to numerical results.
Cons of qualitative data
❌ Time-consuming: Qualitative data analysis often requires more time and effort than working with structured numerical data.
❌ Smaller sample sizes: The data collected may not represent the full population, limiting generalizability.
❌ Subjectivity: Interpretation can vary depending on the qualitative researchers’ perspectives, which may introduce bias.
❌ Harder to measure trends: Not as effective for identifying large-scale patterns compared to quantitative research.
❌ Resource-intensive: Requires trained interviewers, analysts, and sometimes specialized tools for qualitative analysis.
When to avoid relying on it alone:
- If your qualitative research calls for large-scale statistical validation.
- For situations where quick insights are needed for immediate decisions.
- In projects that prioritize objective, measurable metrics.
Collect actionable insights for product growth!
Qualitative research is how I turn scattered feedback into a clear plan. It gives me the words, examples, and context I need to push a design from “works fine” to “feels right.” At Userpilot, this approach keeps our solutions aligned with what users experience.
The best part? These insights don’t just solve today’s problems. They reveal patterns that shape our next experiments, features, and even product direction. That’s how we build something people want to keep using.
About the author