What Are User Experience Insights? My Process to Uncover Them


When you’re buried in research notes, it’s easy to forget what you’re actually looking for: insights. Not research data points. Not quotes. But real user experience insights, the kind that reveal why people behave the way they do.
I’ve learnt throughout my working experience that user insights don’t magically appear after a few usability tests or NPS surveys. They show up when you start connecting patterns between what users say, what they click, and what they ignore.
So, in this article, I’ll walk you through what user experience insights really mean and share five methods I use to uncover them.
What is an insight in user experience research?
User experience insights are a deep understanding of a user’s motivations, behaviors, or problems, which reveal opportunities for product improvement or innovation.
It’s the “Aha!” moment we get after sifting through data, observing users, and listening to their stories.
Collecting these insights is an ongoing journey, not a one-time task. It involves a mix of research methods that you apply throughout the product development lifecycle.
What is an example of a user insight?
One common mistake I see is confusing findings with user insights. They’re related, but not the same.
Raw data is just numbers or observations. An insight gives that data meaning and points us toward a solution.
For example, seeing that many users drop off at a specific onboarding step (raw data) is not an insight in itself. The insight comes from understanding why they drop off – perhaps the process is too complex, or the value isn’t clear enough. This understanding then lets us fix user friction and improve the experience.
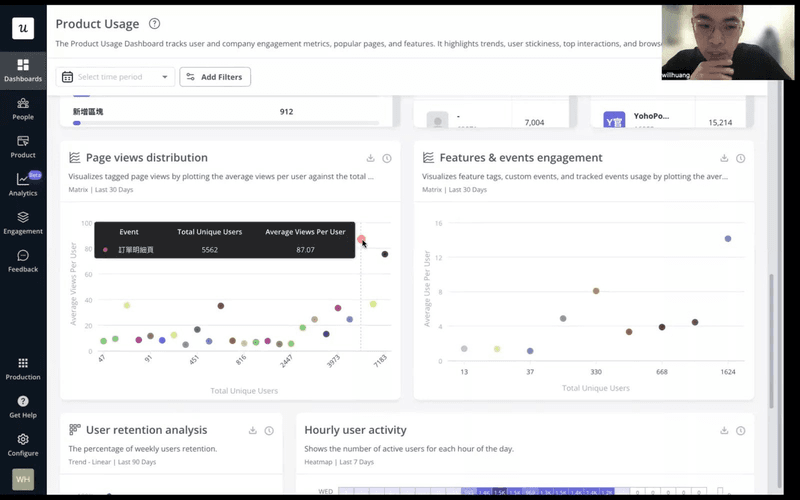
CYBERBIZ, a Taiwan-based e-commerce platform, demonstrates this well. When redesigning their admin panel, they used Userpilot’s analytics to track page views and session durations.
The data showed which pages were most popular and how long users spent completing tasks. But they didn’t stop at the numbers.
By analyzing session duration patterns, they uncovered the insight: shorter sessions meant less friction and users completing their jobs faster.
As Wei-Di Huang, their Senior Product Manager, explained:
“We want to know if the redesign will help the users achieve their jobs or have the jobs done more quickly.”
They then compared pre- and post-redesign metrics to validate their changes, ultimately reducing support tickets and improving feature adoption. This also helped them understand how users behave across different task flows, rather than relying solely on subjective opinions.
Therefore, a good insight should check three boxes:
- Non-obvious: It reveals something new, not just a surface-level observation.
- Relevant: It speaks directly to your research goals and business objectives.
- Actionable: It points to a clear path for improvement or innovation.
Why do user insights matter?
These user experience insights are critical for product-led growth because they turn product development from a speculative venture into a targeted, data-driven process.
For me, its importance boils down to a few key points:
- User-centered decisions: Insights from quantitative and qualitative data let us build products that truly resonate with users. They help us solve their real user problems instead of imagined ones. This is the foundation of good UX design.
- Feature prioritization: When we understand what truly matters to our users, we can focus our limited resources on features that will deliver the most value and impact for our target audience. This helps us make informed decisions about feature prioritization.
- Spotting opportunities: Insights often reveal unmet needs or hidden pain points, opening the door to innovation and new product development.
When should you conduct user research to collect insights?
You should conduct user research at different stages of the product development process. It should be either to explore user needs before building a solution or to test how well your current experience meets those needs.
The goal is to move from raw data to actionable insights that guide better decisions.
The two following approaches define the stage of product development where the research is most useful.
- Generative research (Discovery): This aims to uncover user needs, pain points, and opportunities before we design a solution. It’s about exploring the problem space and generating new ideas. Methods include customer interviews, focus groups, and field studies. Teams often conduct user interviews here to discover motivations behind user actions.
- Evaluative research (Assessment): This focuses on testing existing designs or prototypes to see how well they work. It helps us understand if our solution meets user needs and is usable. Usability testing, A/B testing, and concept testing are key evaluative methods. This research helps answer “How well does our solution work?” and fine-tune product redesign efforts.
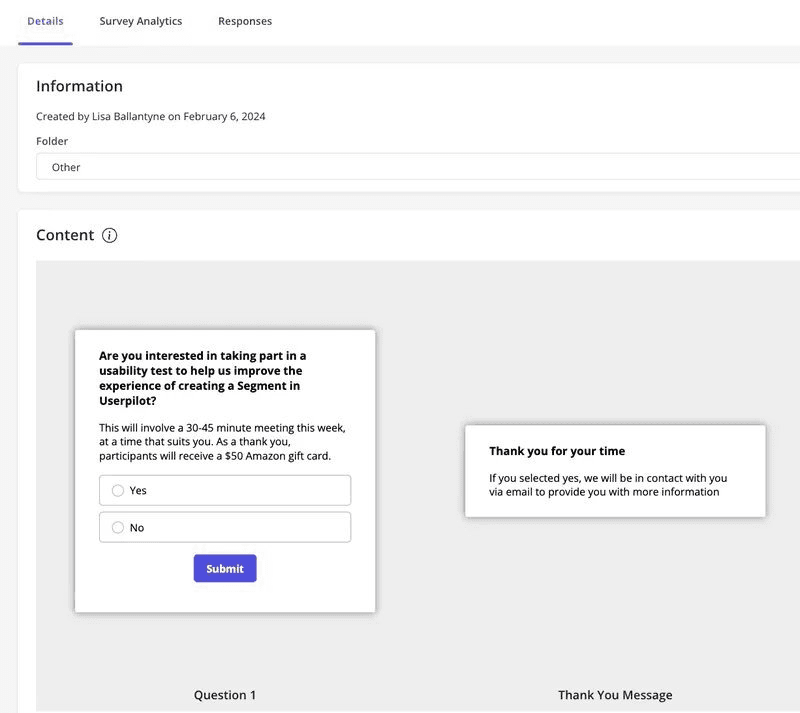
At Userpilot, we practice what we preach. When I needed feedback on our customer segmentation feature design, I recruited beta users specifically to test the prototype.
This is a classic example of evaluative research. By targeting users who had already used similar features, I could gather focused feedback on whether the new design actually improved their experience.
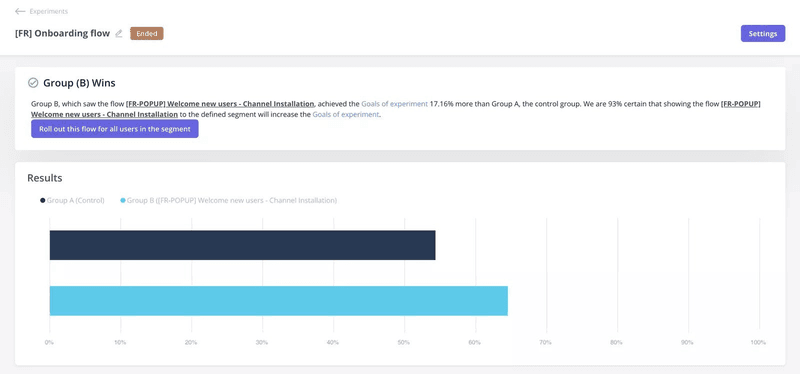
Another great example comes from Smoobu, one of our customers at Userpilot. They ran an A/B test to evaluate whether showing a tutorial right after signup improved engagement. One group received a guided walkthrough to help them connect channels; the other didn’t.
As a result, the guided group saw 17% more conversions. It proved that the right in-app flow, tested at the right time, can meaningfully improve user behavior.
Both generative and evaluative research are vital. You wouldn’t want to build something without first understanding the problem (generative), and you wouldn’t want to launch it without making sure it works (evaluative).
What are the common types of user experience insights?
When I approach any research project, I spend a good amount of time identifying the types of data needed.
This helps me pick the right tool for the job and make sure I’m asking the right questions. Without this framework, it’s easy to get lost in the sheer number of available methods.
That said, below are the most common types of user experience insights:
Attitudinal vs. behavioral: What users say vs. what users do
This distinction is critical because what users say they do often differs from what they do. People might express positive feelings about a feature in a survey, but their usage data might show they rarely touch it.
- Attitudinal research focuses on what people say, including their beliefs, opinions, desires, and stated needs. Methods like surveys and interviews are great here. They help us understand user sentiment, mental models, and how users interpret the user interface during different tasks.
- Behavioral research: This looks at what people do, such as their actions, usage patterns, and interactions. Analytics, A/B testing, and session replays fall into this category. They show us how users truly interact with our product.
After adopting Userpilot, they finally had access to behavioral insights from real usage. They could see which pages users visited, how users interacted with key features, and where engagement dropped. These different data points helped them identify insights that weren’t visible through interviews alone.
Isa Olsson, Zoezi’s UX Researcher and Designer, explained how this shifted their priorities:
“We didn’t even know what pages people visited. Now we can just look at the pages tab and understand that people don’t use this stuff, so let’s not focus on that.”
To get a complete picture, I always try to combine both. For instance, I might see a user rage-clicking on a certain element in a session replay (behavioral), then follow up with an in-app survey or user interview to understand their frustration (attitudinal).
Qualitative vs. Quantitative: Why/How to Fix vs. How Many/How Much
This is another core pairing in my research toolkit, defining the type of data we gather.
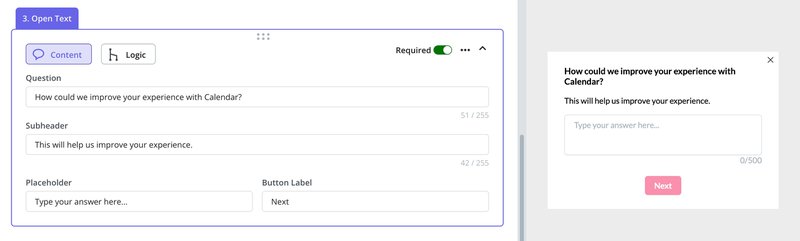
- Qualitative research: This provides rich, descriptive data on why users do things and how to fix problems. It’s about understanding depth, context, and individual experiences. Think user interviews, usability testing, and field studies. I often use open-ended questions to gather this kind of feedback.
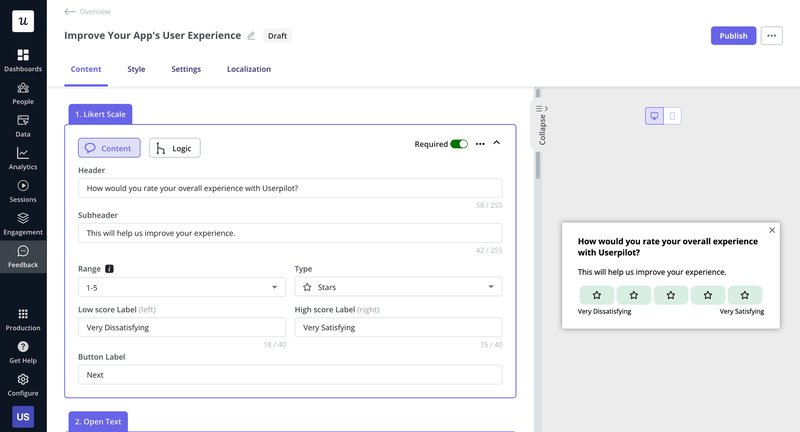
- Quantitative research: This deals with numbers and measurable data, answering “how many” or “how much.” It helps us identify patterns, trends, and prioritize issues. Analytics dashboards, surveys with ratings, and A/B tests provide quantitative data. At Userpilot, we provide robust analytics features to track these metrics.
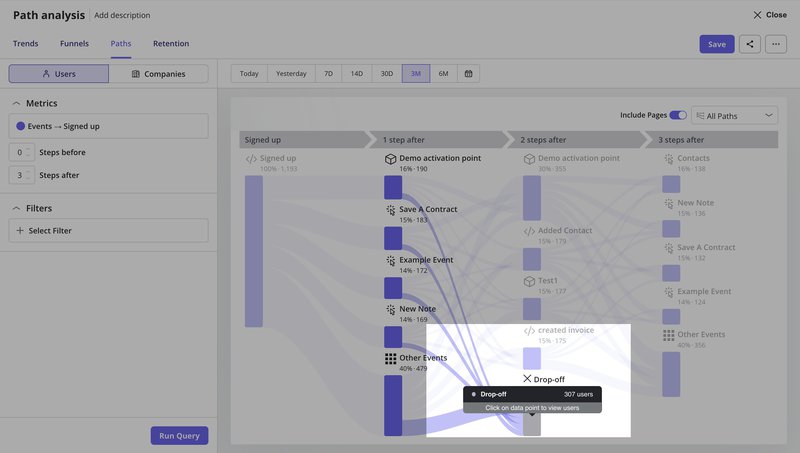
Here’s an example from the trend analysis dashboard. You can track how many users created invoices or projects over time, compare metrics across periods, and drill down into quantitative insights that inform product decisions.
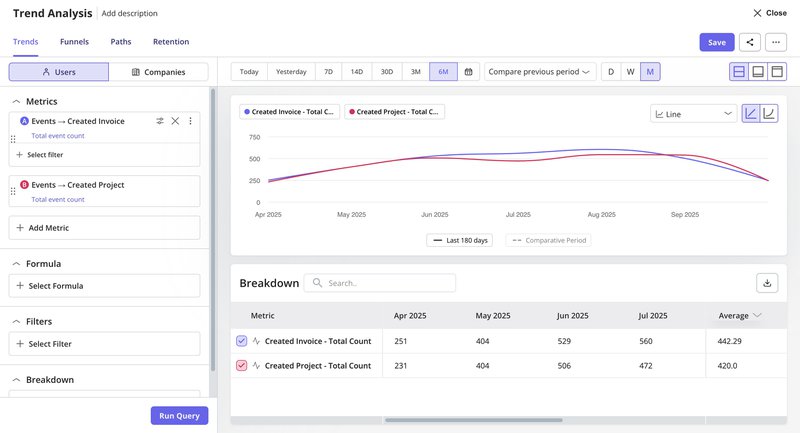
I find that starting with qualitative research helps me explore the “why” and “how to fix” before moving to quantitative methods to measure the “how many” and “how much” and validate those findings across a larger audience.
👉 Speed up your feedback-to-insight process with Userpilot’s AI agent!
And now, there’s a faster way to bring both types of research together.
Userpilot recently introduced Lia, an AI-powered product growth agent that helps you move from data to collecting user insights without spending hours digging through dashboards.
Lia processes user feedback, product usage patterns, and in-app behaviors to spot common issues and suggest next steps. It supports both quantitative signals and qualitative input.
For example, it can detect engagement drop-offs and tie them to open-ended survey responses. This helps teams understand both what’s happening and why.
👉 Join the waitlist to try Lia and speed up your feedback-to-insight process.

My process for collecting and analyzing user insights
Before I get into specific steps, my focus is always on gathering information in a way that doesn’t overwhelm me later.
Good user insights come from having clean inputs. That means collecting qualitative and quantitative data in a structured way so patterns are easier to see.
Collect qualitative and quantitative data
Regardless of the data format, it’s a rule of thumb to organize everything neatly.
Quantitative data usually goes into spreadsheets, so I can easily compare numbers. For qualitative data, I rely on tagging systems to group themes and recurring points.
With Userpilot, many of these collection steps become easier because you can pull information directly from the product. Some of the methods I use include:
- In-app surveys to gather user feedback right after someone interacts with a feature.
- Open-text responses for qualitative input that users share in their own words.
- Structured user feedback sessions for a deeper qualitative context.
- Autocapture of events so I can track what users click or ignore without setting up every event manually.
- Analytics dashboards to view patterns in usage, adoption, and drop-offs.
- Segmentation to compare behaviors across different user groups.
Organize and structure multiple data points to identify themes
Once data is collected, the next step is making sense of it. I approach this differently depending on the type of data:
For qualitative data:
User feedback is either reviewed manually or gathered through surveys and feedback tools.
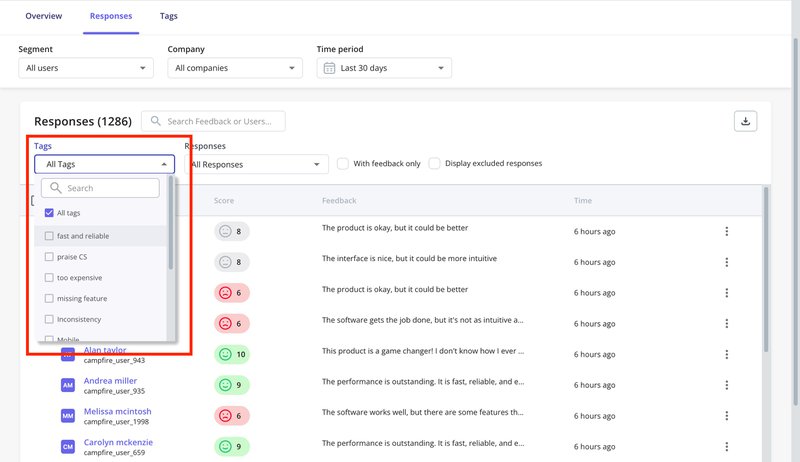
I tag responses by recurring themes, then scan for patterns in how users describe product issues or unmet needs. A quick way I can do this in Userpilot is by using NPS tags. It’s more time-saving to filter responses by tags like “missing feature” or “too expensive” and group related complaints.
With the upcoming AI feedback analysis in Userpilot, this will become even faster. Instead of manually tagging and sorting everything, you can quickly get insights by asking the AI agent.
In some other cases, I organize quotes in a shared document to compare phrasing across users.
For quantitative data:
Analytics dashboards help spot drop-offs, spikes, or slow-moving features.
I also compare usage across segments or timeframes and flag any anomalies, such as a decline in project creation within a specific cohort. This helps filter out noise and narrow focus to patterns that need further exploration.
Synthesize insights into user understanding
This is the most challenging yet rewarding part. It requires deep thought, curiosity, and often, asking “so what?” and “why?” repeatedly.
- Drill down to root causes: When I see a pattern, I don’t stop at the surface. I ask: Why is this happening? What’s the underlying motivation or friction? We use techniques like root cause analysis to get to the core of the problem.
For example, if I notice users dropping off at a specific form field, I’ll be asking: Is the field unclear? Does it ask for information too early? Has it broken user expectations?
Sometimes teams might just write “Users don’t complete the signup form” as a finding. But that’s not an insight. A clearer version would be:
“Users drop off at the phone number field during signup because they perceive it as unnecessary and intrusive at that stage. This creates an opportunity to delay that request until after activation.”
- Connect to business goals: A finding isn’t helpful unless it relates to what we’re trying to achieve. If our goal is product adoption, I filter everything through that lens. Patterns I identify during user feedback sessions or while reviewing user testing tools only become insights when they tie back to something that moves the product forward.
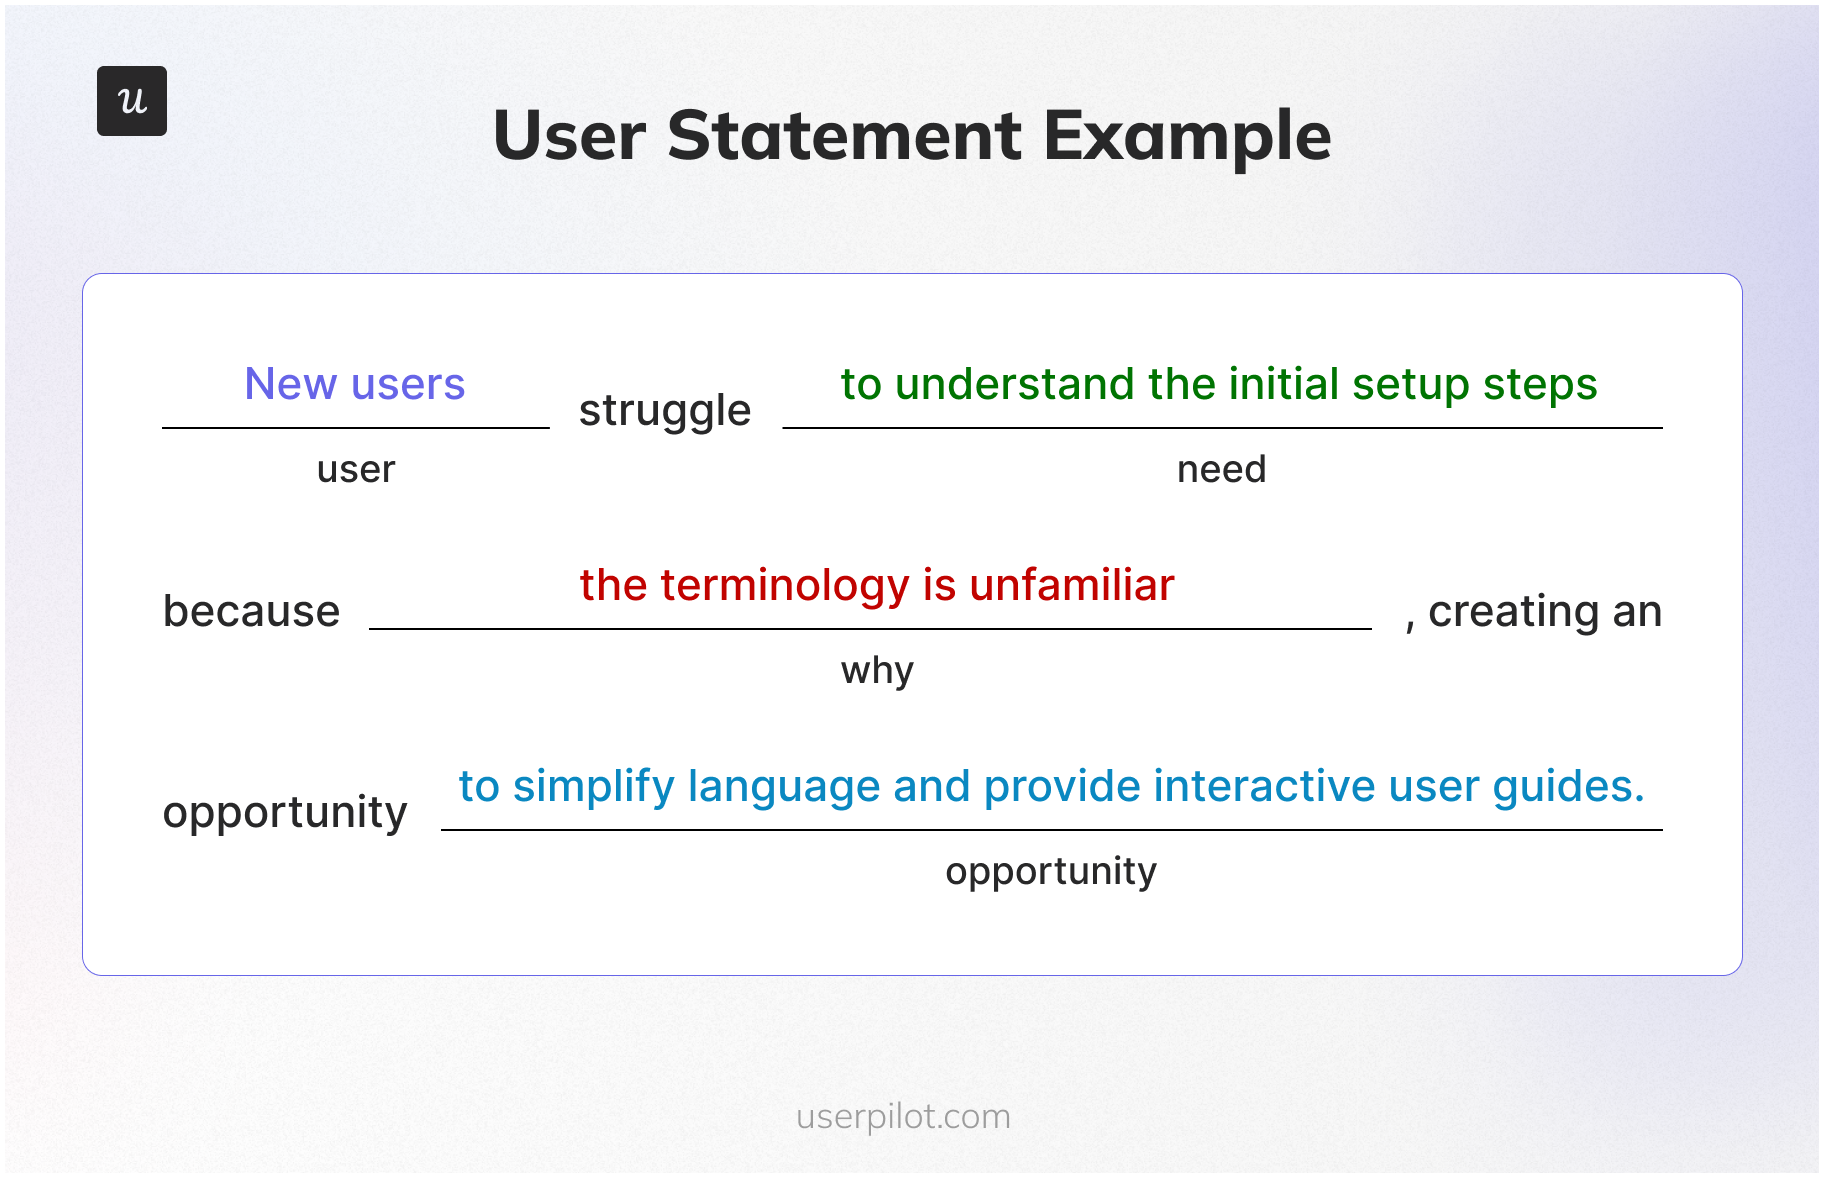
- Formulate actionable user statements: Good insights are specific. I try to phrase them as short statements that combine:
- The type of user
- Their motivation or need
- The barrier or cause
- A possible opportunity
For example: “New users struggle with the first-time setup because the language is too technical. Adding tooltips or simplifying labels could reduce drop-off.” This makes it easier for product, design, and research teams to act on the insight, rather than circle back for clarification later.
How to present UX research insights
Once you’ve done the hard work of analysis, the next challenge is to present your user insights in a way that resonates with your team and leads to action. A well-crafted insight statement is clear, concise, and compelling. I always structure my valuable insights to include:
- The core statement: Start with a punchy, specific statement that summarizes the key takeaway. It should immediately communicate the problem or opportunity.
- Context (how we discovered this): Back up your core statement with the evidence. Reference specific data points, user quotes, or behavioral patterns from your research. This builds credibility and trust.
- UX impact (How it hurts the user): Explain the human side of the problem. How does this insight affect the user’s experience? Does it cause frustration, confusion, or a loss of trust? Empathy is a powerful driver for action.
- Business impact (Why the company should care): Connect the insight to measurable business goals. How does solving this problem affect activation, retention, revenue, or engagement? Product managers and stakeholders speak the language of business metrics. This is essential for building an actionable product analytics framework.
- Actionable next steps: Provide specific, testable recommendations. What exactly can the team do to address this insight? These should be clear ideas that can be prioritized and implemented. This is a practical application of turning data-driven insights into growth.
A UX research insight example
Here’s an example that follows this structure:
- Core statement: New users drop off at the workspace setup screen during onboarding.
- Context: Event analytics showed that only 58% of users who began onboarding completed the workspace setup step. In open-ended surveys, several users said: “I didn’t understand what workspace means,” and “I wasn’t sure what to write in that field.”
- UX impact: The unclear terminology causes hesitation and confusion during the very first experience, which leads to early drop-offs and blocks product exploration.
- Business impact: This reduces activation rates and delays product adoption. Users never reach the point where they see the product’s value, which can impact short-term retention and long-term revenue.
- Actionable next steps:
- Add placeholder text or a short example inside the input field.
- Update the copy to use simpler language that aligns with user expectations.
- Trigger a tooltip or short guide to clarify what “workspace” means.
- Use user testing to observe whether these changes reduce friction.
Go from data to insights in minutes with Userpilot!
Raw feedback, usage metrics, and open-text responses can pile up quickly. To get value from them, I focus on finding what connects behavior to motivation.
Tools matter here, and Userpilot helps a lot in this part of my workflow. I can track user interaction, gather user feedback, and bring both viewpoints together without switching between platforms. When needed, I add secondary research methods to check if a pattern holds across other sources or use cases.
All of this helps reduce guesswork. It also gives product teams more clarity around what to work on and why. When key insights are well-formed and tied to real behavior, the result is usually better decisions and better customer satisfaction.
Try Userpilot to collect better user experience insights and make sharper product calls.
FAQ
What are the 5 levels of user experience?
The 5 levels of user experience insights are as follows:
- Perceived UX: What users think the experience will be.
- Operative UX: What users experience while interacting.
- Reflective UX: What users remember after using it.
- Anticipated UX: Expectations built before interaction.
- Cumulative UX: Experience built over multiple sessions.
What are the 5 elements of user experience?
- Strategy: User needs + business goals.
- Scope: Functional specs and content.
- Structure: Information architecture + interaction design.
- Skeleton: Wireframes, layout, and UI elements.
- Surface: Visual design and aesthetics.
About the author