Building an End-to-End Product Analytics Framework in the AI Agent Era


A product analytics framework is supposed to tell you the truth about how your users use your product. But the tracking frameworks and tools have broken with the introduction of AI agents because tracking them isn’t the same as monitoring human usage. The agent works on the customer’s behalf but uses MCP servers to complete tasks.
They don’t click a button and wait for a confirmation screen. Instead, they call an endpoint, get a response, and move to the next task. And that’s exactly why product analytics tools built entirely around human behavior will keep missing that traffic, and it isn’t a small slice anymore.
Agentic traffic has surged by 7,851% in the last year alone. And that’s why your product analytics framework needs to change.

What does a product analytics framework have to account for in 2026?
In 2026, a modern product analytics framework must account for two distinct types of usage: traditional human interactions and automated AI agent activity, ensuring both are tracked separately to prevent misleading engagement metrics.
What’s changed is who’s generating the user interactions your framework has to explain. Deloitte’s consulting team put it plainly in a 2026 analytics brief: traditional product analytics, built around linear funnels, click-through rates, and session duration, are proving insufficient to capture value or manage risk as GenAI agents get woven into digital products.
Session duration assumes a session. Click-through rate assumes a click. Neither assumption holds for an account where half the “usage” is an agent calling your API on a schedule, which is why the framework itself needs an update.
Userpilot CEO, Yazan Sehwail, put it this way:
“As teams start deploying their own AI agents, those agents are gonna tap on our existing infrastructure that will be powering all of the usage and all the product data, and that’s extremely powerful.”
That’s the shift underneath every step below. You’re no longer instrumenting one kind of usage, you’re instrumenting two, and the framework has to keep them legible instead of blending them into one misleading number.
What kinds of analyses are included in a product analytics framework?
Most of what belongs in a product analytics framework falls into four buckets: understanding user behavior, mapping the user journey, spotting trends, and diagnosing churn. Here are the related analyses for each.
- Segment and cohort analysis groups users by behavior or signup time so you can compare them, and cohort analysis is especially valuable for identifying high-impact actions. For example, it reveals whether users who complete a specific onboarding task within their first 24 hours convert at a significantly higher rate.
- Funnel and journey analysis maps show where people drop out of a flow and pairing it with journey mapping tells you not just where they left but what they were trying to do when they did.
- Trend and funnel conversion analysis tracks a metric over time to catch the moment a “power user” behavior starts predicting an upgrade. Identifying these patterns early lets you target high-intent cohorts with tailored messages that drive conversions, something our trend analysis tooling is built to surface.
- Churn analysis pairs flow data with direct customer feedback, so you’re not just seeing that someone left, you’re seeing why they did.
How to build a product analytics framework?
Let’s now take a look at the steps to build a product analytics framework.
Step 1: Assemble a team that still meets in month three
Every guide to this topic tells you to build a cross-functional “dream team”: product, data, engineering, marketing, customer success, sometimes design. What none of them tell you is what happens after the kickoff meeting.
The team meets weekly for the first month, biweekly by month two, and by month three it’s just the PM checking a dashboard alone. The framework usually survives its launch. What kills it, three months later, is that ownership quietly erodes from a full team to one tired person checking a dashboard by themselves.
That’s why you need to select a team that’s accountable. One person, deeply embedded in the product domain, who actually owns the framework past the kickoff, beats six people who each assume someone else is watching the dashboard.
Step 2: Pick objectives and metrics that won’t lie to you
Once you’ve got an owner, define what you’re actually trying to learn. Do you want to increase user engagement, improve user retention, or tighten onboarding?
Pick one or two goals and connect each to a business objective your leadership already cares about.
Then choose the metrics that measure it, mixing leading indicators like feature usage with lagging ones like churn rate. Be sure to avoid measuring vanity metrics like total features shipped, number of signups, and raw traffic. These all feel good in a slide but tell you almost nothing about product performance.
Vanity metrics get worse, not better, once agents show up in your data. A spike in daily active users looks like growth right up until you learn a third of it is one customer’s agent hitting your API regularly.
The metrics worth centering your framework around should survive that kind of scrutiny. User activation rate, feature adoption metrics, and time to value, each should be defined narrowly enough that you can say exactly what event triggers it. If you can’t name the event that triggers it, you haven’t properly defined your success metrics.
Step 3: Choose a platform that can analyze and ship fixes
Picking a customer analytics platform used to mean comparing dashboards, integrations, and pricing tiers. Mixpanel, Amplitude, Heap, and Google Analytics all do a competent job of that comparison.
But the gap none of them close on their own is turning an insight into an in-product fix without a second tool and a procurement cycle. That’s the specific problem we built Userpilot to solve: connect the analysis to the action, in one place. Likewise, we built Lia, our own AI agent, to simplify access to analytics. All you have to do is ask natural language questions and the agent will fetch the relevant insights and also suggest the next step.
These, however, only capture human users. You also need a way to measure product use by agents.
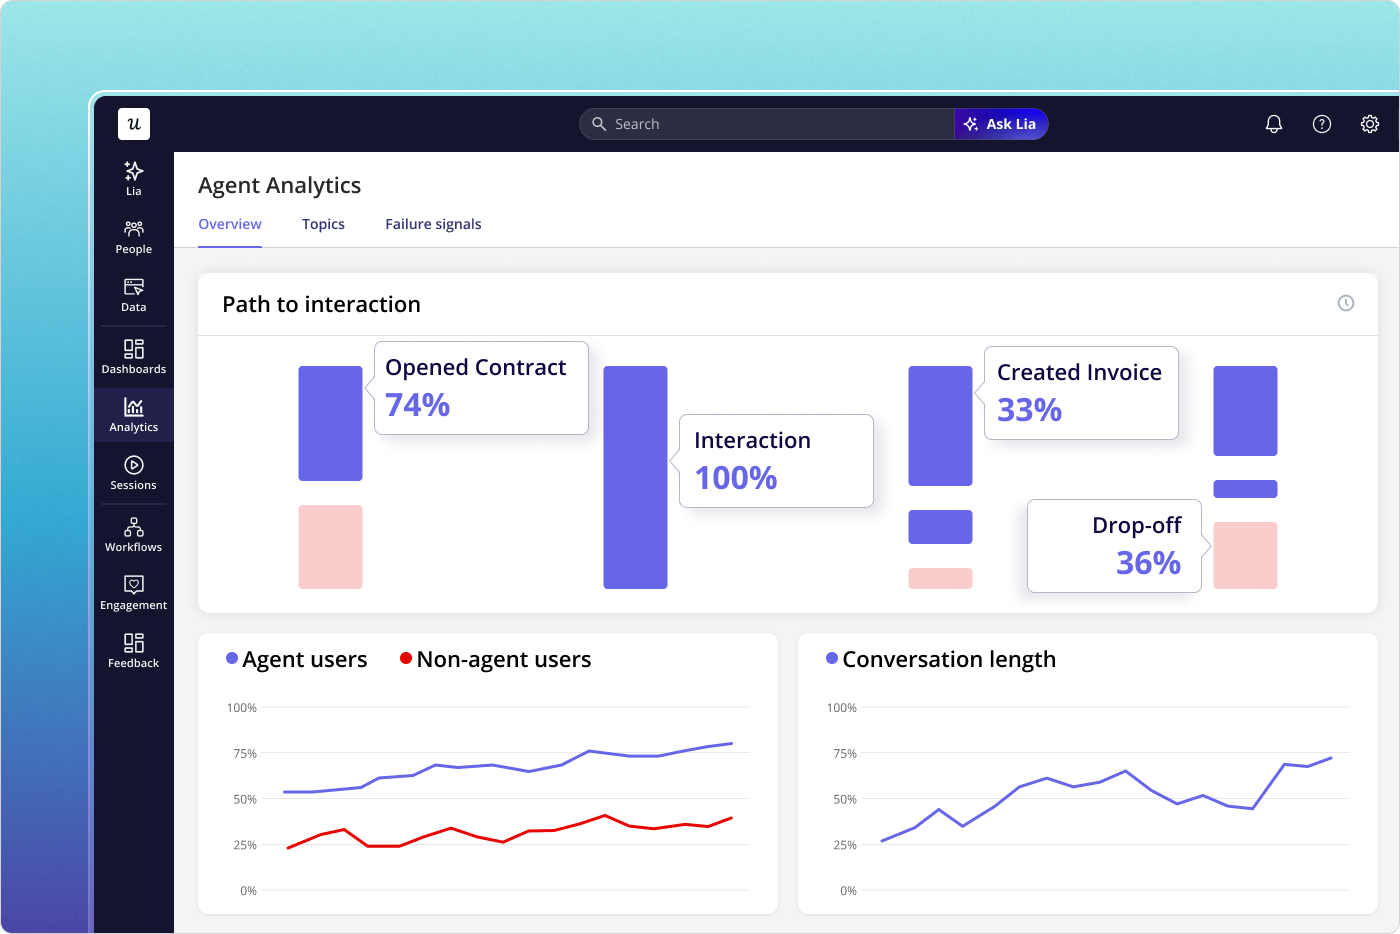
Amplitude announced a suite of agentic AI analytics capabilities in February 2026, specifically to address this gap. Likewise, Userpilot also has AI Agent Analytics which works as a different measurement layer to track conversation logs, agent failure signals, and task completion rates for AI interactions. The two streams stay distinct, so you can analyze each one without the other.
Step 4: Collect data from humans and agents separately
With a platform in place, start collecting usage data. The usual sources still apply for human users. These include user surveys, support interactions, in-app feedback, and event tracking, whether your engineering team hand-codes it or you use autocapture using a tool like Lia to skip that step entirely.
However, the metrics for agents differ. For them,
- Tag API endpoints and MCP tool calls as tracked events with the calling agent identified.
- Add a task completion event class distinct from feature interactions.
- Capture conversation entry points for any in-product agent.
But before your data reaches any report, you must tag it to depict human and agent sessions, so the two never blend into one inaccurate number.
It enables you to get clear insights into your product performance for each category separately.
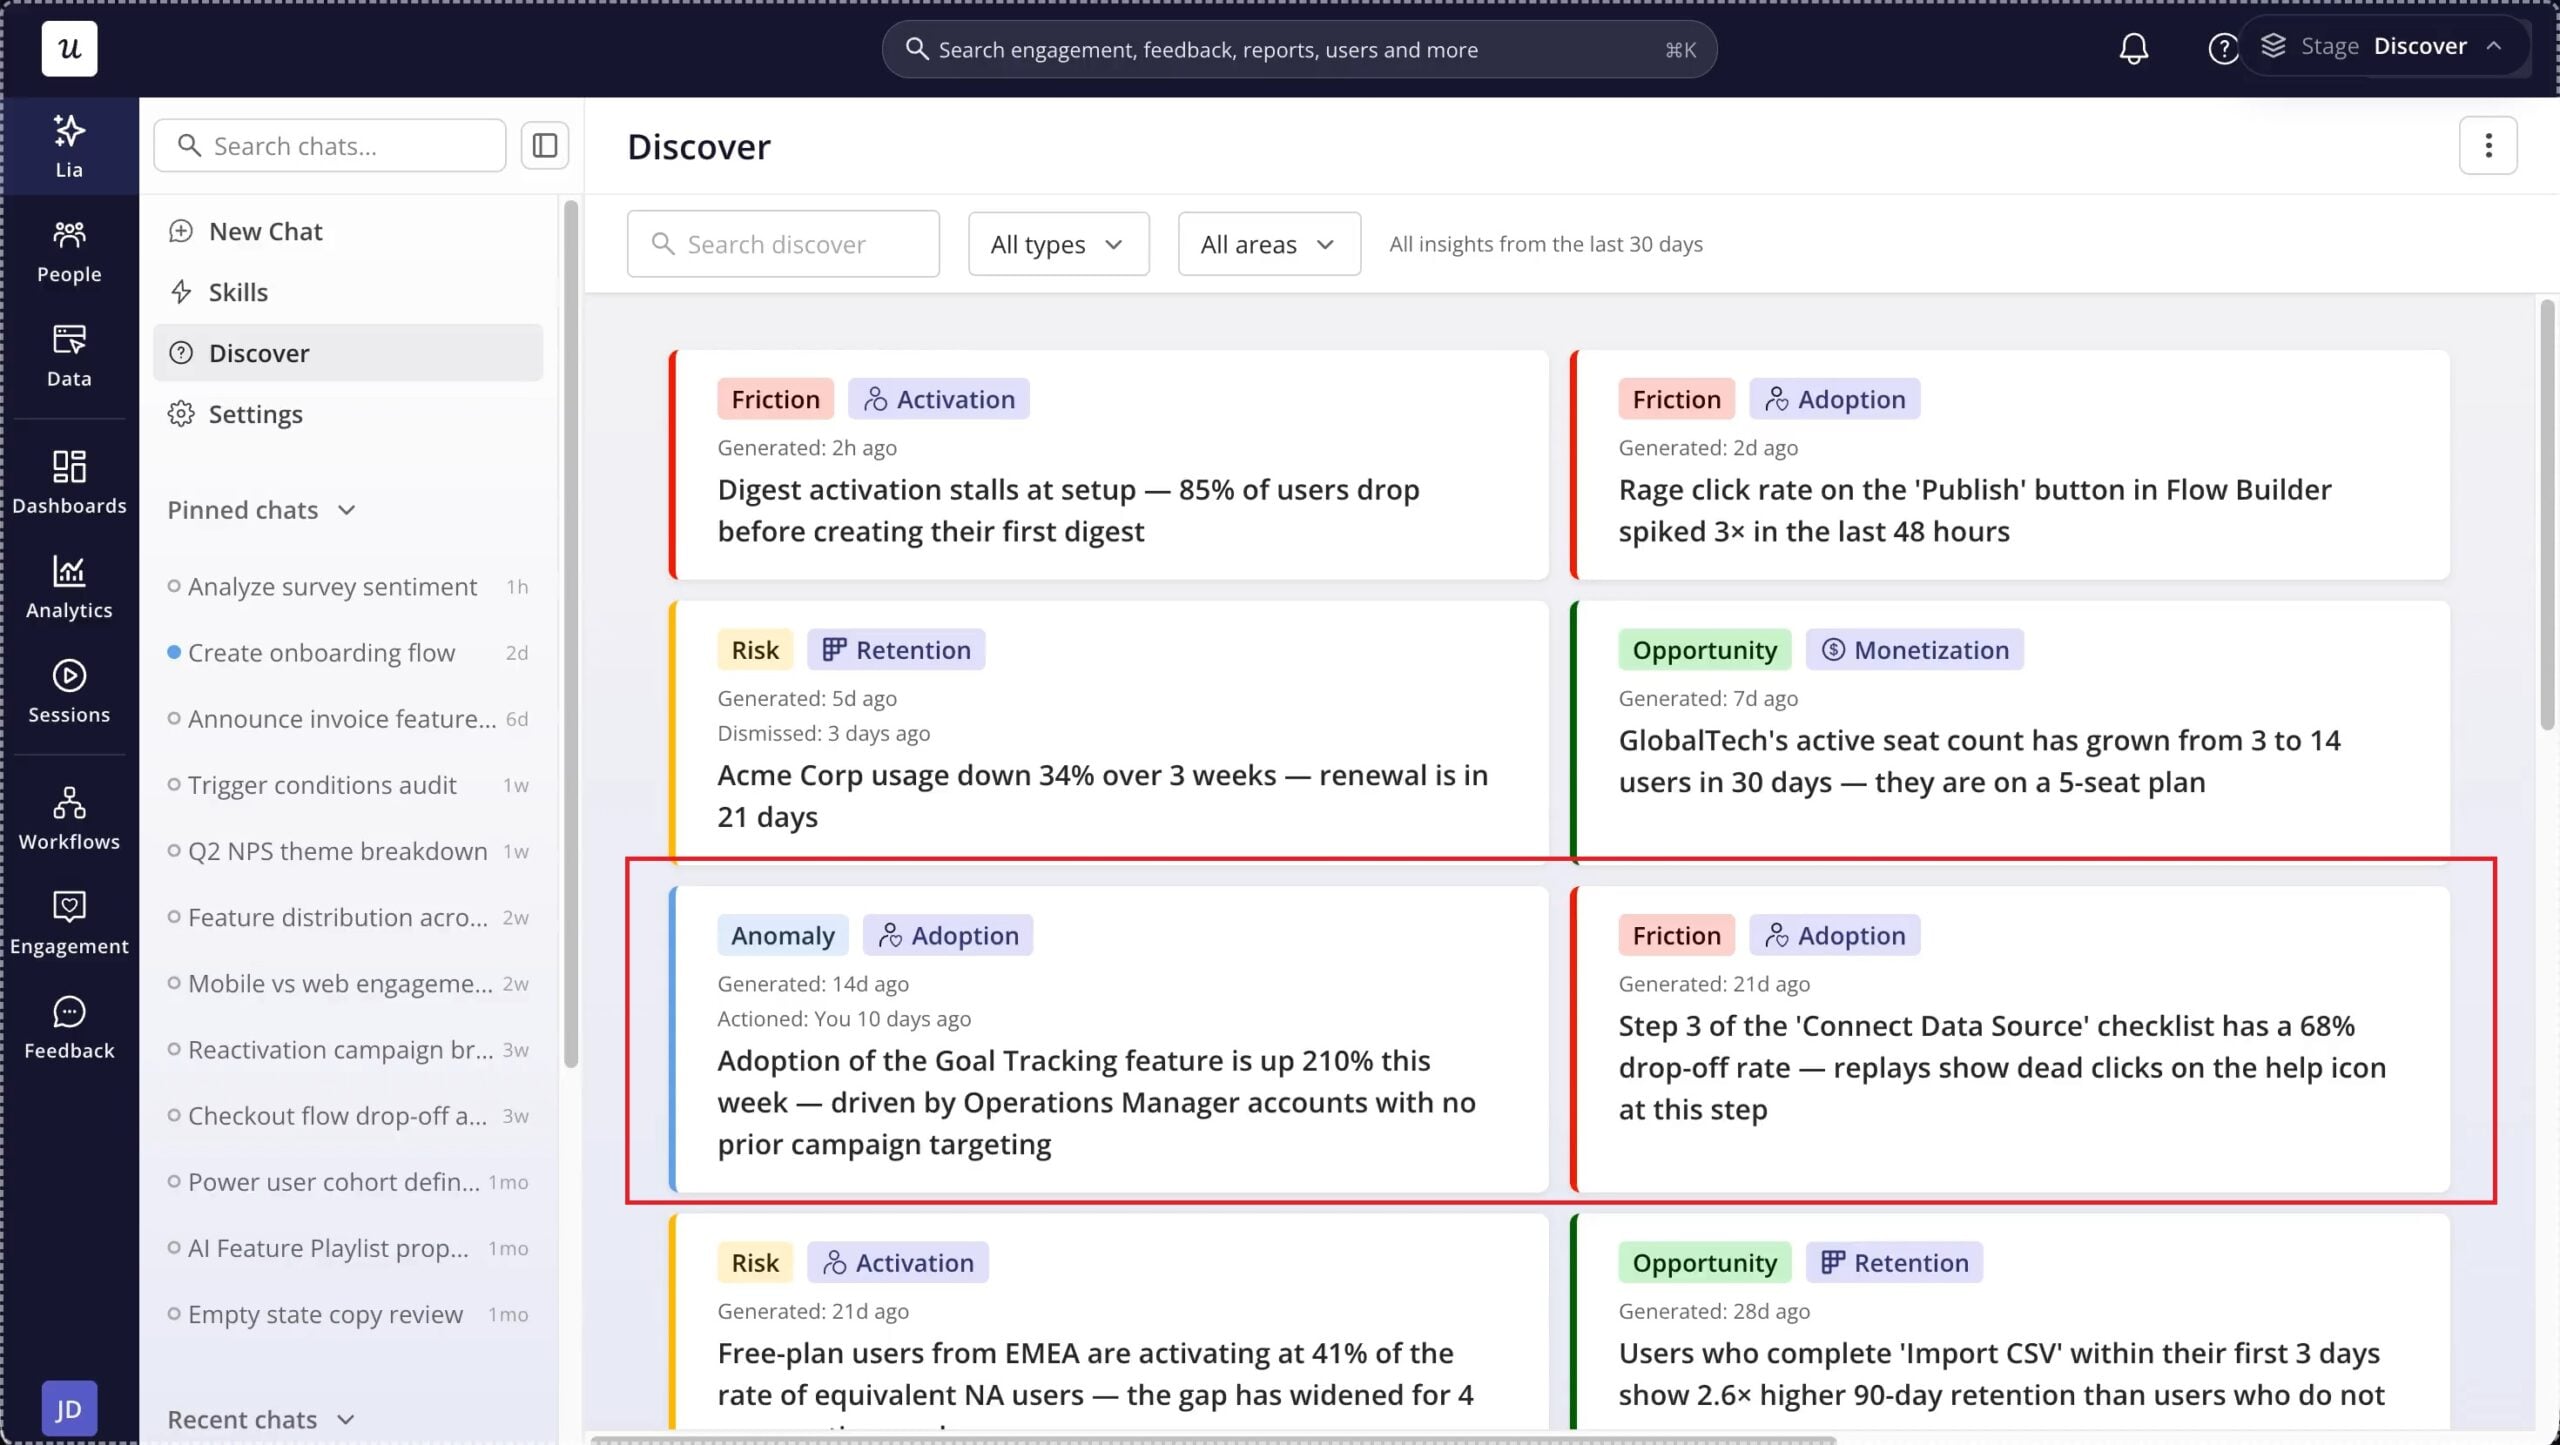
Note how Lia has autocaptured data and come up with insights automatically, enabling you to act on them quickly.
Step 5: Analyze, then act before the insight goes stale
Collecting clean data is only half the job. You need to then analyze it with session replay, dashboards, and trend tracking, then move to action fast. It can help you improve the user experience and product adoption.
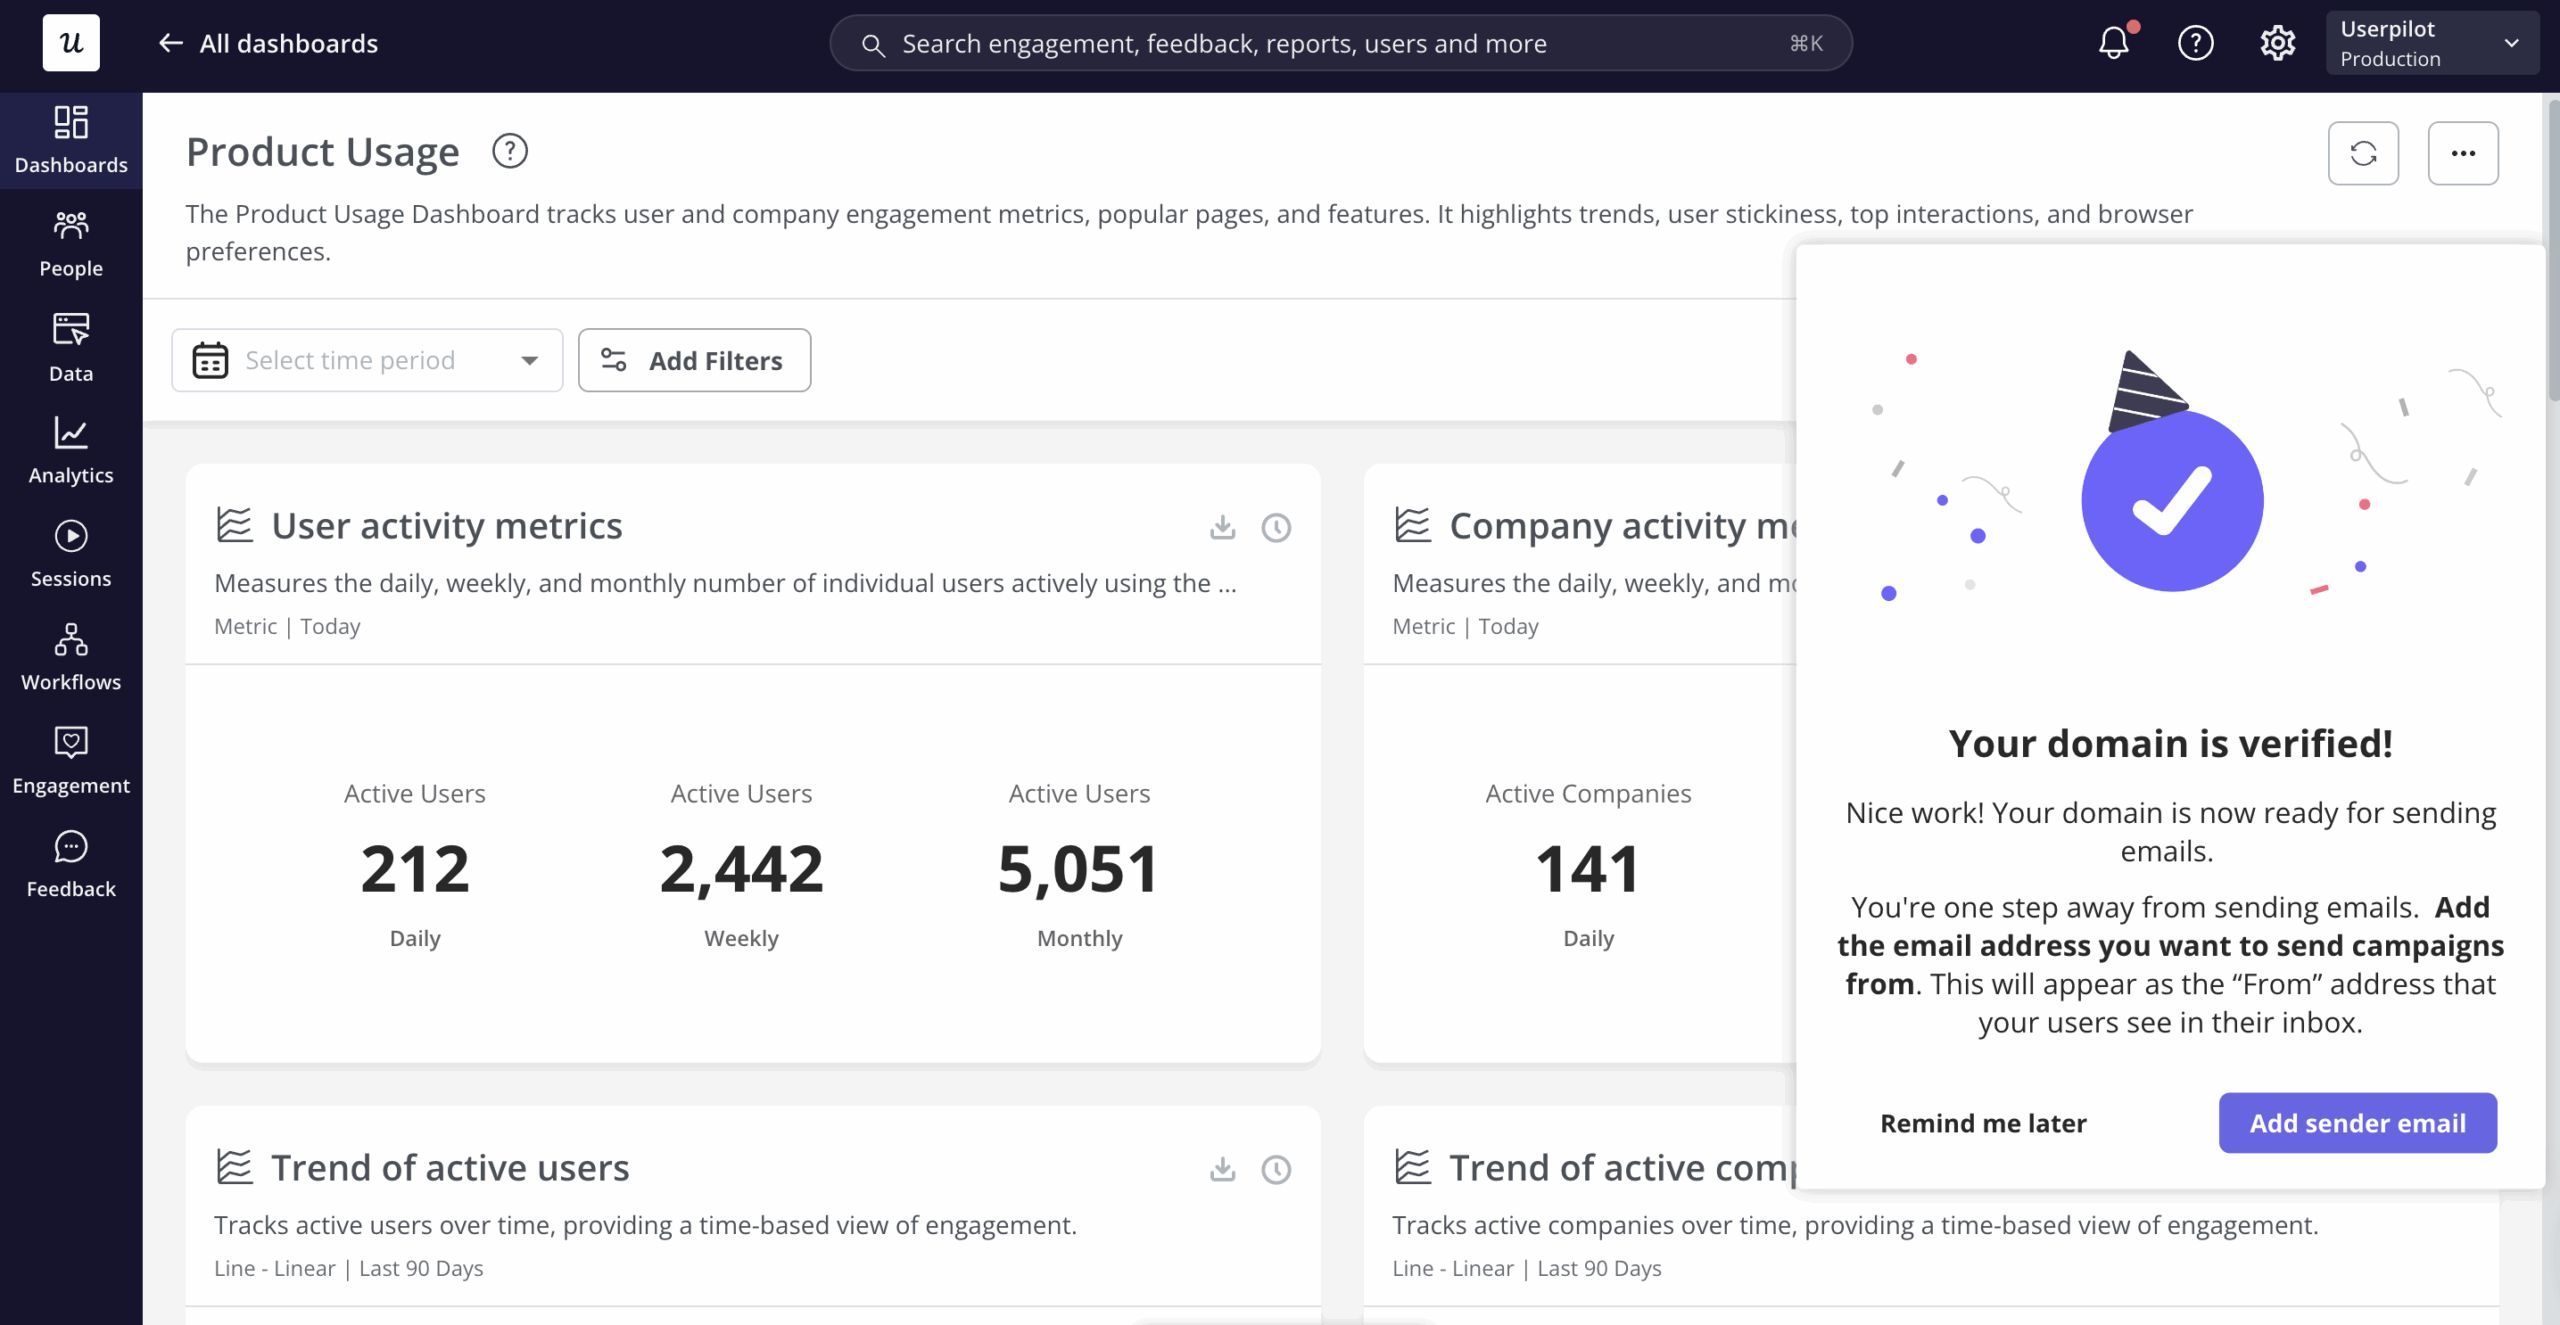
I used this strategy when we launched our email feature and noticed a hard drop-off at the domain verification step. I built a checklist and targeted tooltip the same day and the drop-off rate closed within days.
With an AI agent like Lia, that process becomes even faster.
Earlier, you’d have to go through several session replays and track trends manually to understand what needs fixing. This was a time-consuming process.
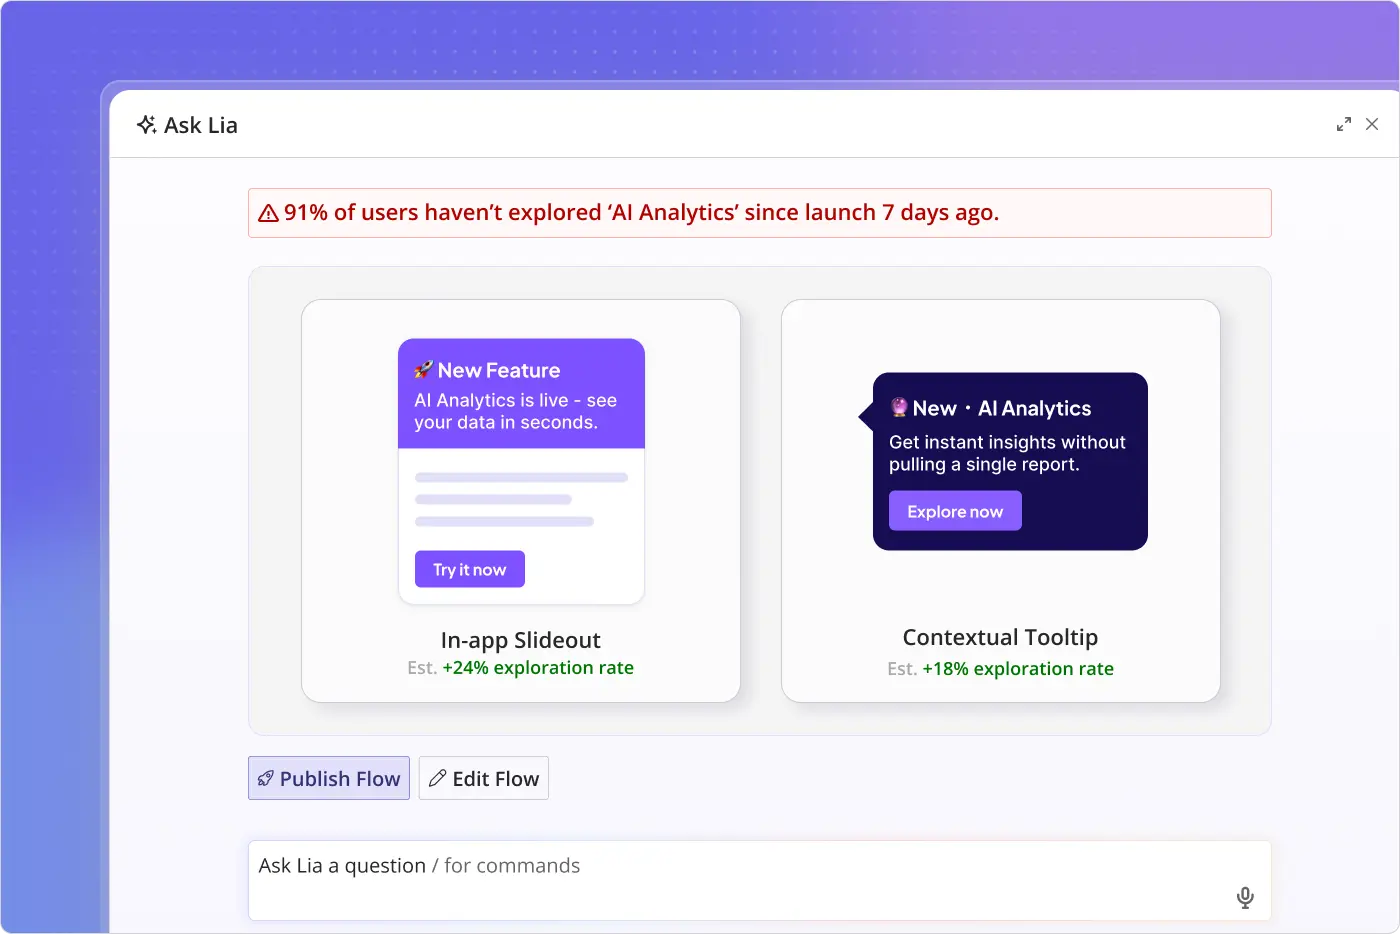
Instead, all you have to do is ask a natural language question to Lia and it’ll surface the potential fix. As it gets signals from events, session replays, NPS, surveys, and content engagement data, it’s able to provide a fast and accurate answer. Moreover, you can implement the fix with the click of a button as well.
Start tracking your product usage
The key to successful product analytics is to name an owner, because everything else in this framework depends on someone still checking the dashboard or querying Lia in month three.
From there, the order matters less than the discipline. Pick metrics that survive contact with agent traffic, choose a platform that connects insight to action, and classify every event as human or agent before it reaches a report.
And with an AI agent like Lia, it becomes easier to access these insights and deploy fixes.
If you want to see how this works, get a free trial of Userpilot now to see it in action.
FAQ
What's the difference between a product analytics framework and a product analytics tool?
A framework is the process: who owns it, what you track, and what happens after you find an answer. By contrast, a tool like Userpilot, Amplitude, or Mixpanel is just where the data lives. You can buy the best tool on the market and still fail to fix your product if you lack a framework.
Do I need a separate tool for agent analytics?
You don’t necessarily need a separate tool. What you need is a platform that tags agent-originated events separately from human ones inside your existing instrumentation, so you’re not maintaining two disconnected systems for one product.
About the author