
Analytics vs Metrics: What’s the Difference and How to Analyze Metrics?
Analytics vs metrics – how do they differ from each other?
Though both are important, analytics and metrics have distinct meanings and purposes in your data analytics process. Understanding the nuances between them is critical to utilize them to improve your feature adoption, customer behavior, etc.
In this article, we will go through analytics and metrics, their examples, and how you can analyze metrics to drive growth for your SaaS business.
Try Userpilot Now
See Why 1,000+ Teams Choose Userpilot

What are metrics in SaaS?
In SaaS, metrics are numerical values that measure and evaluate a product, service, or company’s performance, success, and growth. They provide valuable insights into various aspects of your business and help you make data-driven decisions for future growth.
What are analytics in SaaS?
In SaaS, analytics is the practice of collecting and analyzing customer data to understand how they engage with your company’s product or service. This data can help you identify trends, optimize the customer experience, and make better product development, marketing, and operations decisions.
Analytics vs metrics: What’s the difference?
Metrics and analytics are two important concepts in the present world of data analytics, but they are two different things. While both refer to ways of interacting with (and collecting) data, they serve different purposes in the data analysis process.
If we break it down to the basics, metrics are the starting point of your data analysis. They are the raw data you collect to measure particular aspects of your product. And analytics is the process of analyzing and interpreting that data to draw insights and make data-driven decisions.
Analytics has nothing to do with data collection. Instead, the second step in the data analysis process gives meaning to the data you get from the raw metrics. And when you can combine the metrics and analytics properly, you can gain a deeper understanding of your customers and performance.
Categories of customer analytics
Customer analytics involves using both quantitative and qualitative data to understand customer behavior and preferences. There are several categories of customer analytics: descriptive, diagnostic, predictive, and prescriptive analytics.
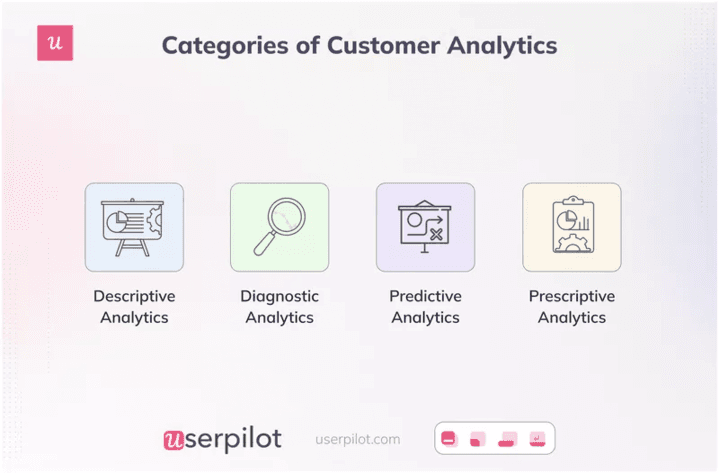
Descriptive analytics is the process of summarizing and presenting past events and behaviors in a meaningful way. It helps you make more informed decisions by providing accurate data and a complete picture of customers’ behavior and history.
Diagnostic analytics explores data to understand the reasons behind certain outcomes. You can often use it to identify the root causes of specific customer behaviors and develop actionable strategies.
Predictive analytics predicts future customer behavior by analyzing historical data and trends. It uses algorithms and statistical models to help you understand what may happen in the future. You can use it to anticipate customer needs, identify trends, and take preemptive measures to improve the customer experience.
Prescriptive analytics uses data and mathematical models to suggest the best action. This type of analytics uses customer behavior data to recommend strategies for improving your customer journeys. For example, you can use it to improve customer engagement, pages per session, branded search website traffic, etc.
Types of product analytics
While customer analytics focuses on customer behavior across all the journey stages, product analytics closely examines customer interaction with each feature of the product. It aims to identify and address friction points.
Below are the common types of product analytics:
Journey analytics
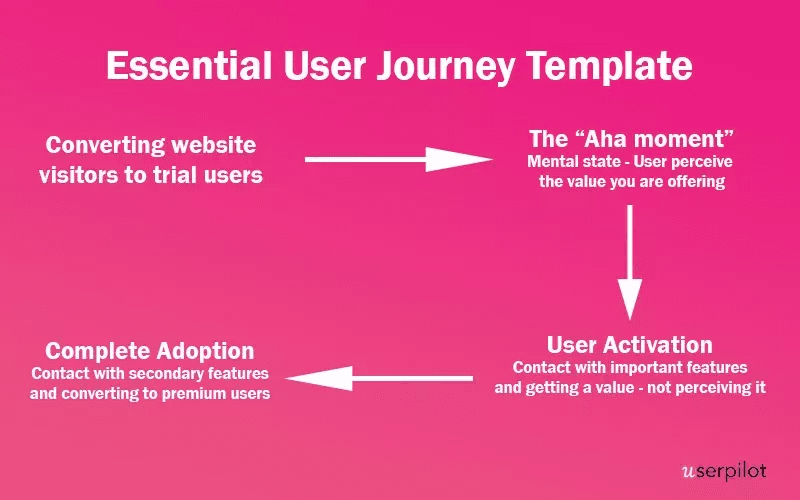
It helps you measure the effectiveness of your touchpoint strategies by offering insights into the customer journey. You can then identify and eliminate the pain points that prevent customers from moving from one stage to another across the user journey.
Experience analytics
This analytics focuses on identifying the friction points in the customer experience. After identifying them, you can take action to eliminate them and drive satisfaction with a seamless customer experience.

Engagement Analytics
This analytics provides insights into your users’ interactions to help you find solutions to boost engagement. Using engagement analytics, you can retain more customers and create unique user adoption flywheels.
Behavior Analytics
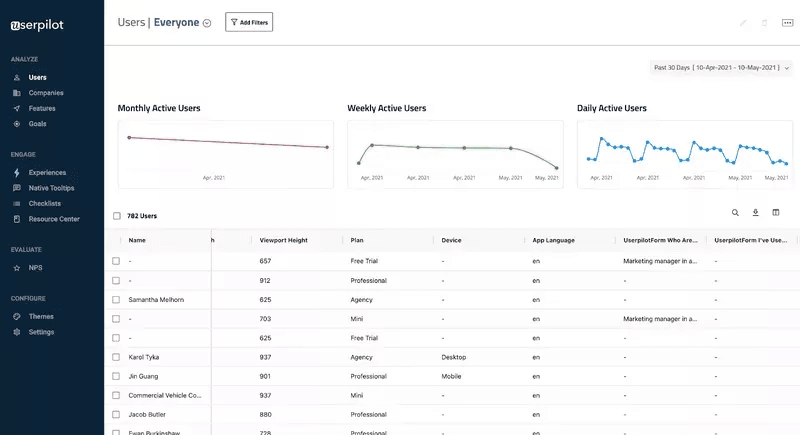
It helps you understand customer behavior across every touchpoint and channel. With it, you can identify trends in how your customers behave and make data-driven decisions to optimize customer behavior.
Userpilot helps with behavioral analyses:
Retention Analytics
This analytic helps you understand how satisfied your customers are with your products or services. You can use it to improve your customer retention rate, get more account expansion opportunities, and grow your revenue.
Loyalty analytics
Loyalty analytics shows the likelihood of your customers recommending your products or services to others. You can leverage it to have loyal customers who will bring in more customers through advocacy and word-of-mouth marketing.
Types of metrics a SaaS business should be tracking
Let’s go through some of the metrics examples to better understand them.
- Activation rate: This metric measures the percentage of users who perform specific key events after signing up for your product. It helps you understand how effective your onboarding process is.
- Number of active users (NAU): Refers to the number of unique users who engage with your product actively in a given period. NAU provides valuable insights into user engagement and helps you track growth over time.
- Conversion rate: Measures the percentage of users who complete a desired action, like becoming a paying customer from a trial user. It shows you whether your sales and marketing efforts are paying off.
- Churn rate: This metric refers to the percentage of users who stop using a SaaS product over a specific period. It helps you better understand customer satisfaction and identify areas for improvement.
- Monthly recurring revenue (MRR)/annual recurring revenue (ARR): They measure the recurring revenue your products generate over a given period, like a month or year. They provide valuable insights into the total revenue growth and can help you forecast future revenue.
- The average revenue per account (ARPA): It measures the average revenue your customers generate over a specific period and helps you understand the overall revenue potential of a customer base.
- Customer acquisition cost (CAC): It refers to the cost you incur for acquiring a new customer for your product or business. It lets you make informed decisions about resource allocation and optimizes your spending for maximum return on investment.
- Customer lifetime value (CLV or LTV): It measures the average amount of money you earn from a customer throughout their relationship with your business.
Let’s go deeper now that you’re getting the difference between analytics vs metrics…
How to collect and analyze in-app user behavior?
Now we will see how you can analyze metrics to make your SaaS business more effective and successful.
Set up events and track user behavior
Another critical aspect of analyzing metrics is tracking in-app user behavior. It helps you understand what your customers do in the app, how they interact with different features, and how they use your product.
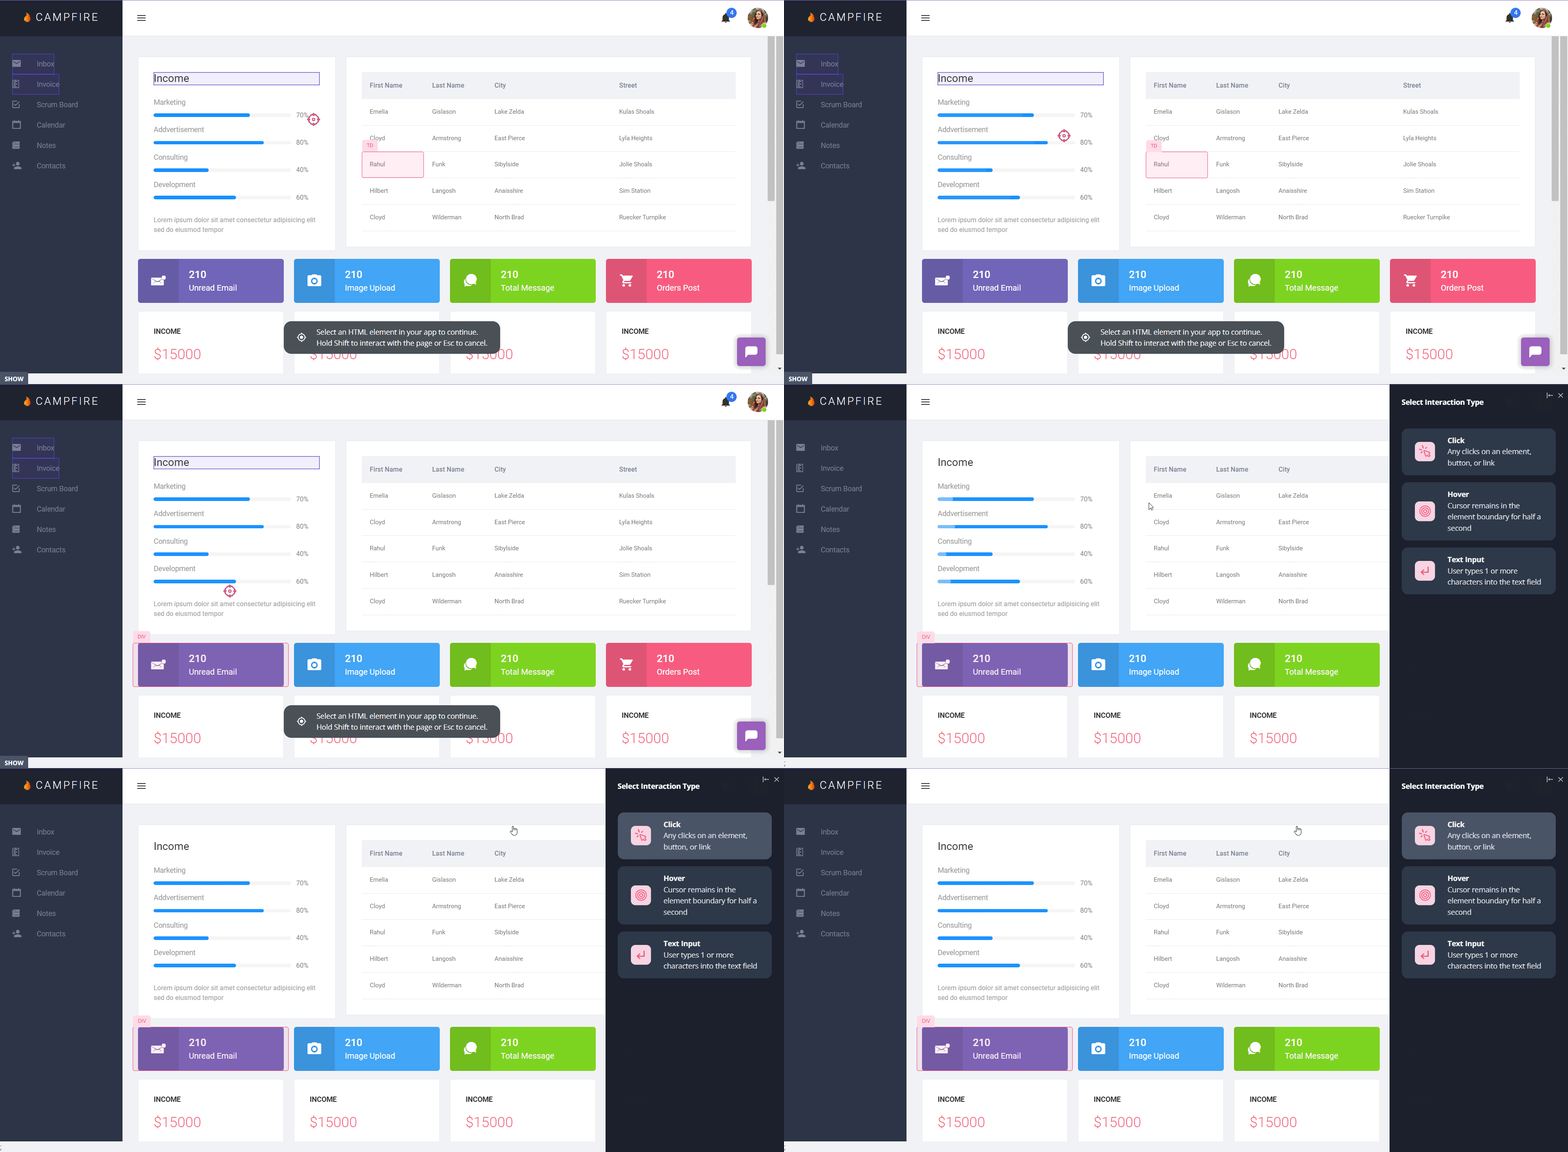
You should track clicks, hovers, and text inputs in addition to feature usage. Tracking them with product usage analytics can help you see the bigger picture of what’s going on with your product. You can try cohort analytics to take this data to the next step and understand how your different customer segments use your product.
You can bring all your metrics and KPIs into one place with an analytics dashboard. Then, it gets easier to look at your product adoption metrics and determine whether your products meet your customers’ needs. It also helps you identify trends and patterns in your customers’ in-app behavior.
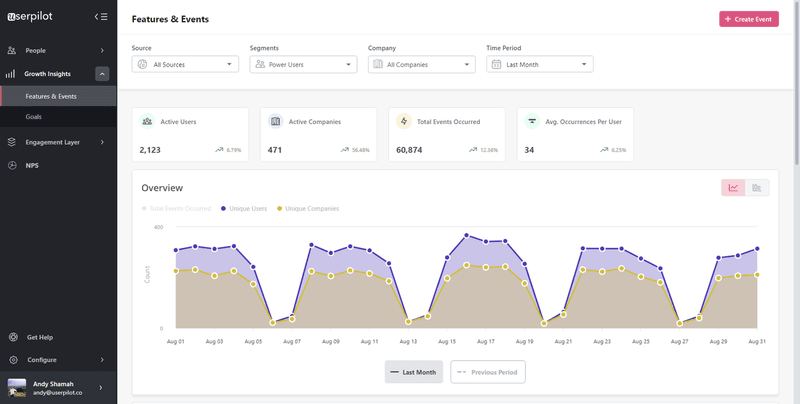
With native mobile SDK, you can also create intuitive mobile app KPI metrics and dashboards that provide clear insights into user behavior, engagement, and retention.
Send NPS surveys to collect user feedback and track loyalty
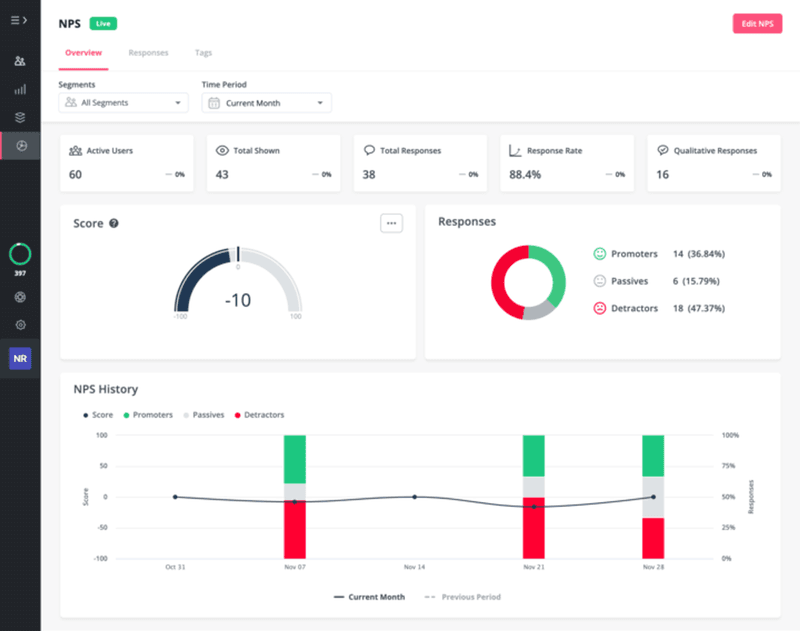
Collecting customer feedback through microsurveys can help you analyze metrics by considering your customers’ perspectives. One popular way to do that is by sending Net Promoter Score (NPS) surveys. They help you understand how likely your customers are to recommend your products to others on a scale of 1-10.
NPS surveys help you categorize customers into promoters, passives, and detractors. You should add a follow-up question to collect qualitative feedback from your customers. NPS software tools can help you do it automatically to understand the factors behind your customers’ given scores.
After collecting NPS survey results, you should start analyzing them. Check your customer loyalty and identify areas where you need to improve for better customer retention.
Offer self-serve support and track how often customers need help
You can offer self-serve support as an effective way of analyzing metrics for your products or company. A help center with a rich knowledge base can be a valuable tool for your customers. It can be more useful for customers who need support outside business hours.
Link your relevant documentation files, tutorials, webinars, and live chat widgets to ensure your customers can find everything they need in one place.
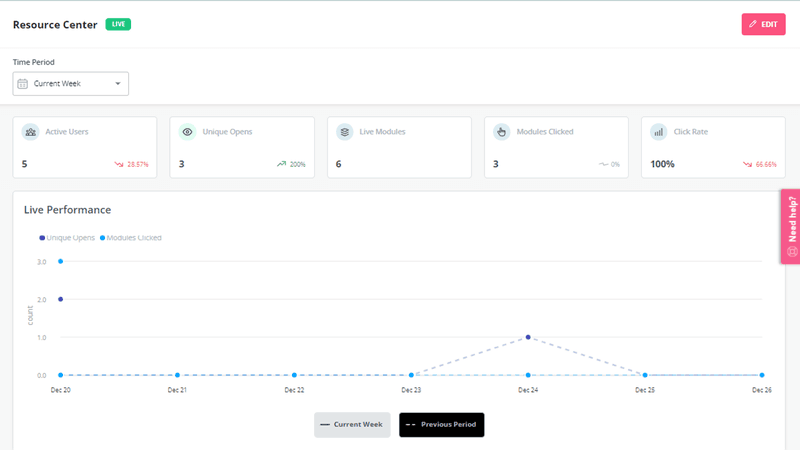
With a help center widget, you can get an overview of your help center modules’ live performance. You can filter the data by time and access information about the number of active users, unique opens, modules you’ve created, click rate, and more.
This information can help you understand which customers browse through the help center frequently. It can indicate that your customers get stuck and need help with any feature. You can also identify trendy support topics and improve your feature or product accordingly.
Conclusion
Analytics and metrics help you assess your performance and make more informed decisions to achieve your goals. And understanding the differences between them is essential to maximize their utility. Hopefully, this article has helped you do that!
Want to dig further into analytics vs metrics, track in-app user behavior, collect data, and analyze it code-free? Get a Userpilot Demo and see how easily you can do it.


