Growth Marketing Strategy for SaaS in 2026: The CAC Math No Longer Works


Growth marketing strategy is supposed to make customer acquisition cheaper as it compounds across the entire product lifecycle, but it’s doing the opposite for most SaaS companies by getting more expensive over time. Benchmarkit’s SaaS Performance Metrics report found that the bottom quartile of SaaS companies now spend $2.82 in sales and marketing for every $1 of new ARR they add. That’s what happens when a growth strategy is treated exclusively as an acquisition strategy that doesn’t touch the rest of the customer journey.
Megan Bowen, CEO of Refine Labs, has seen this omnipresent challenge time and time again:
“I talk to 7–10 marketing leaders every week. Most of them are under pressure to drive more growth with less budget. Most teams are trying to scale demand without a brand foundation and without a plan for expansion. The fix isn’t just better ads. It’s a fully integrated growth strategy: Brand → Demand → Expand”
The only way to get off this increasingly expensive hamster wheel and get your LTV:CAC ratio under control is by treating growth marketing as a holistic initiative that blends acquisition with retention.

Proven growth marketing strategies for SaaS
All eleven growth marketing strategies below sit somewhere on the Ansoff Matrix, which maps growth against new or existing markets and products.
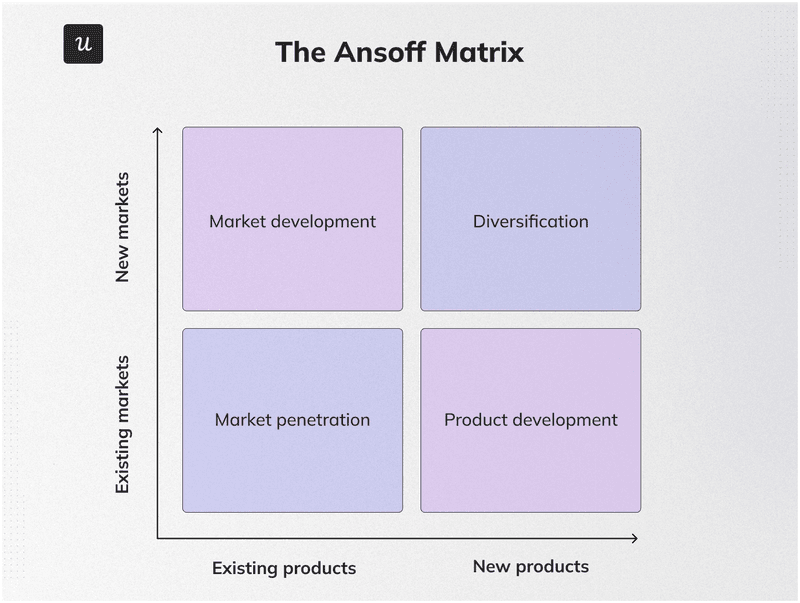
The four quadrants on this Ansoff Matrix are:
- Market penetration: Grow your share in your existing market with your existing product.
- Market development: Bring your existing product to a new market or customer segment.
- Product development: Build new products or features for the market you already serve.
- Diversification: Build new products for markets you haven’t touched, the riskiest quadrant.
Most strategies don’t map cleanly to a single quadrant but rather span the whole customer lifecycle, as Revrod’s founder Eliya Elon pointed out:
“Traditional demand marketing is dying. Its inability to adapt to increasingly complex buying journeys and the resulting fragmented, inconsistent buyer experiences, along with its focus on lead gen rather than the full customer journey, is accelerating a shift toward lifecycle revenue marketing.”
1. Create product-led content to attract your target audience
Product-led content teaches people about the problems they already have and shows them how your product solves those issues along the way. Our own blog runs on the same logic with articles covering funnel analysis or onboarding design pulling in people searching for answers who see Userpilot as a plausible solution while they’re there.
Abrar Abutouq, one of our product managers, put it well when we talked about how product decisions are made at Userpilot:
“Product decisions were sometimes a drive-by, simply following what competitors were doing in the market, sometimes without always validating whether this feature would be solving their real problem and pain points.”
Product-led content is the fix on the marketing side of that same problem because it forces you to write about what users actually search for instead of whatever your competitor published last quarter.
2. Optimize your landing page to increase sign-ups
Your landing page is often the first touchpoint in the customer journey with your brand. A well-designed page catches attention and drives conversions within seconds. Build one landing page per use case and user persona instead of a single generic page for everyone. Fast loading times are key since a 1-second delay in your site speed can result in a 7% reduction in conversions. You should also leverage multimedia since embedding relevant video content on a landing page can increase conversions by up to 86%.
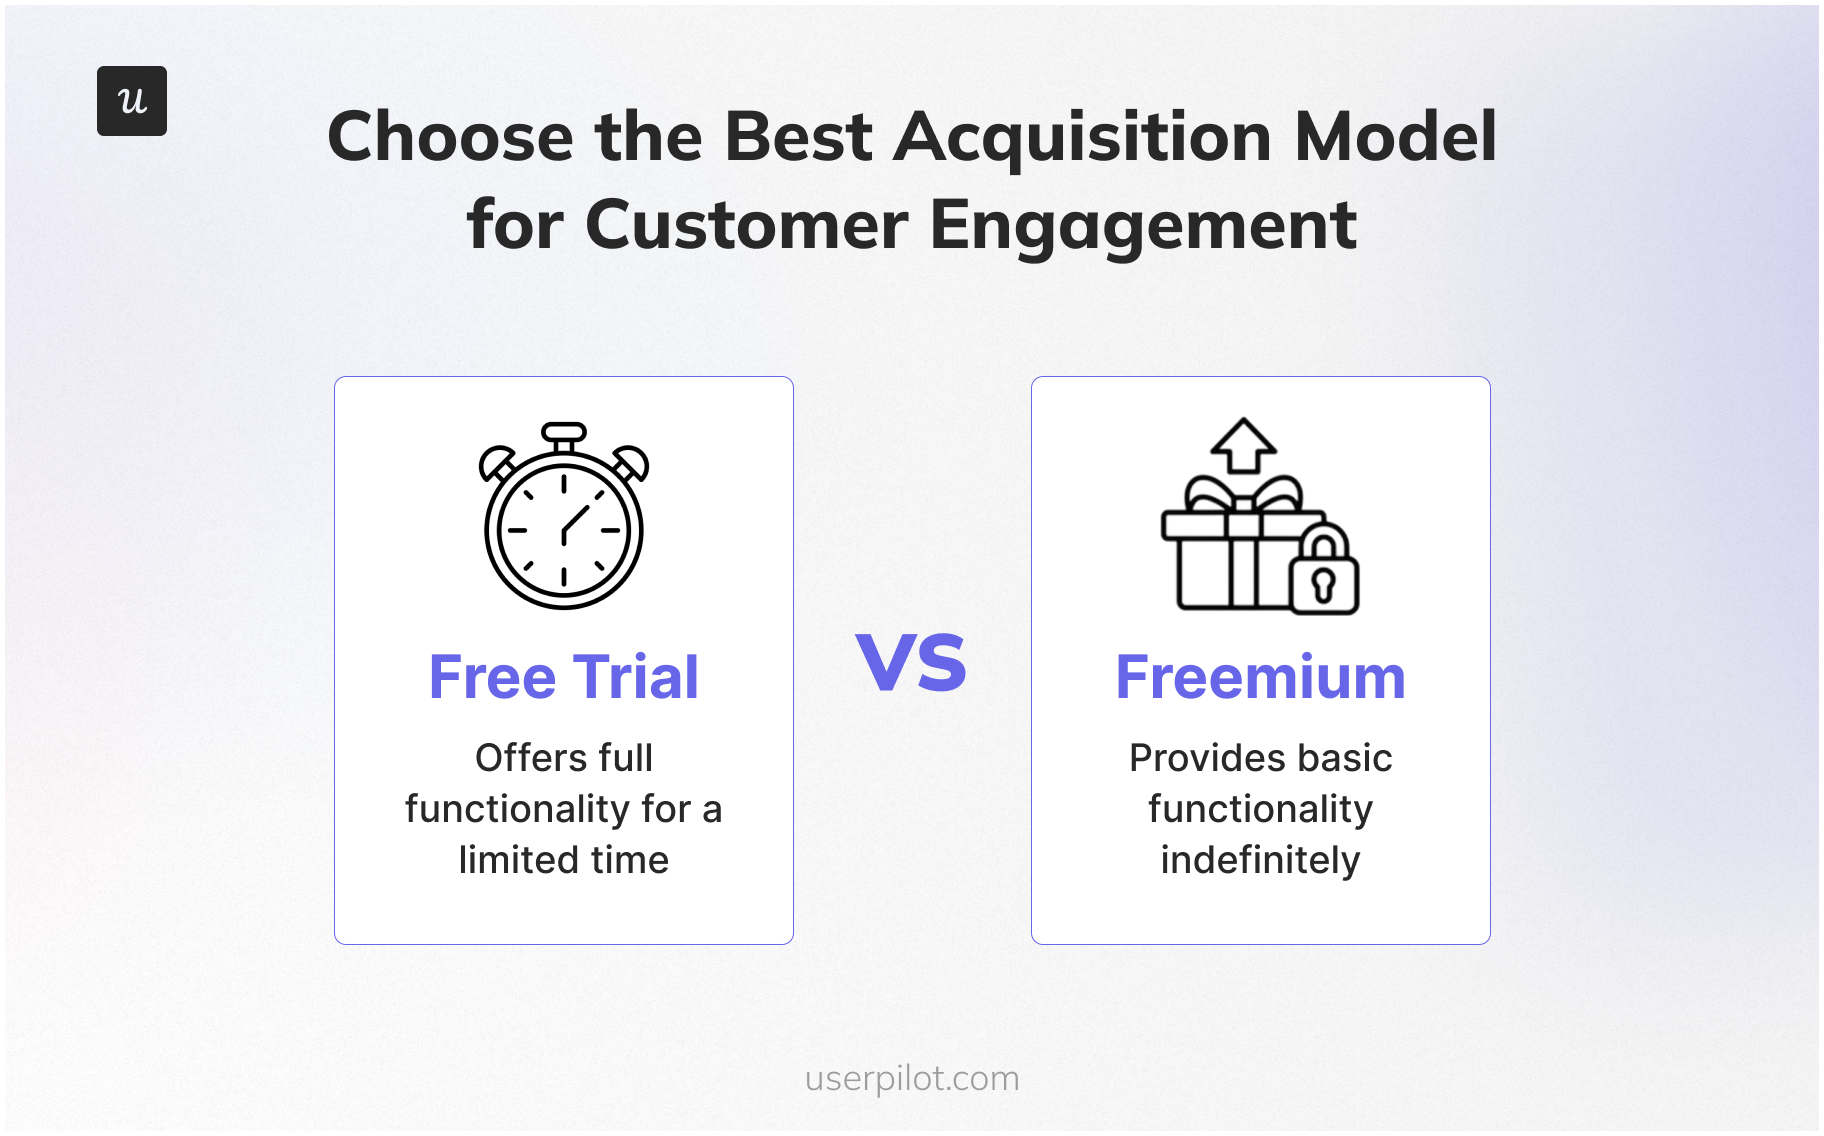
3. Provide a freemium plan or free trial
Free trials let people experience product value before they pay for it. Limit access to some features (or offer full access for a limited window) to show exactly what the product can do without giving everything away for free. When it comes to finding the optimal trial length and increasing trial conversion rates, tuning based on product analytics is a far more reliable approach than going by gut instinct or copying industry averages. Every product is different, and a more complex feature suite will require more time for users to realize the value that it can provide.
4. Personalize the onboarding experience to shorten time to value
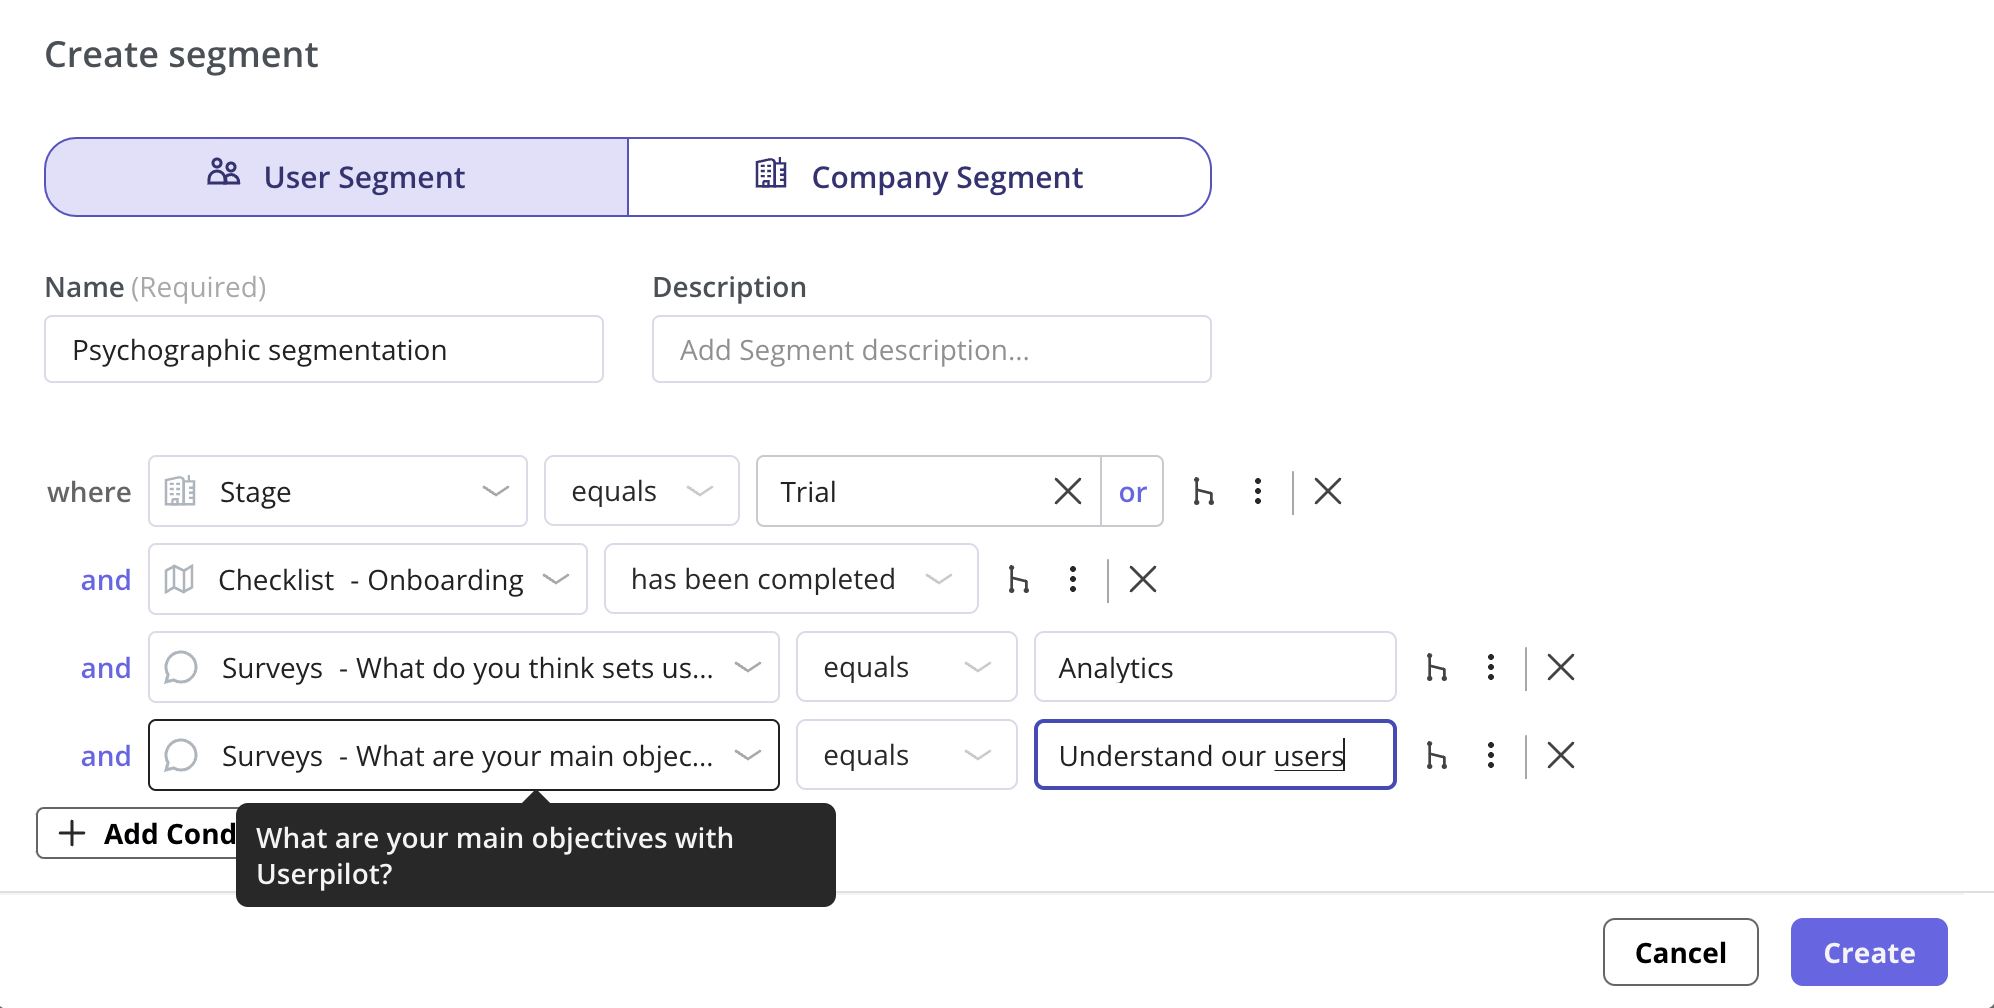
Most products serve several user personas with genuinely different goals. Each segment needs a different set of features to reach activation, meaning a single onboarding flow trying to appeal to everyone will resonate with no one. Use product analytics, funnels, and paths to find the happy path to activation for each persona, then design personalized onboarding flows for each user segment.
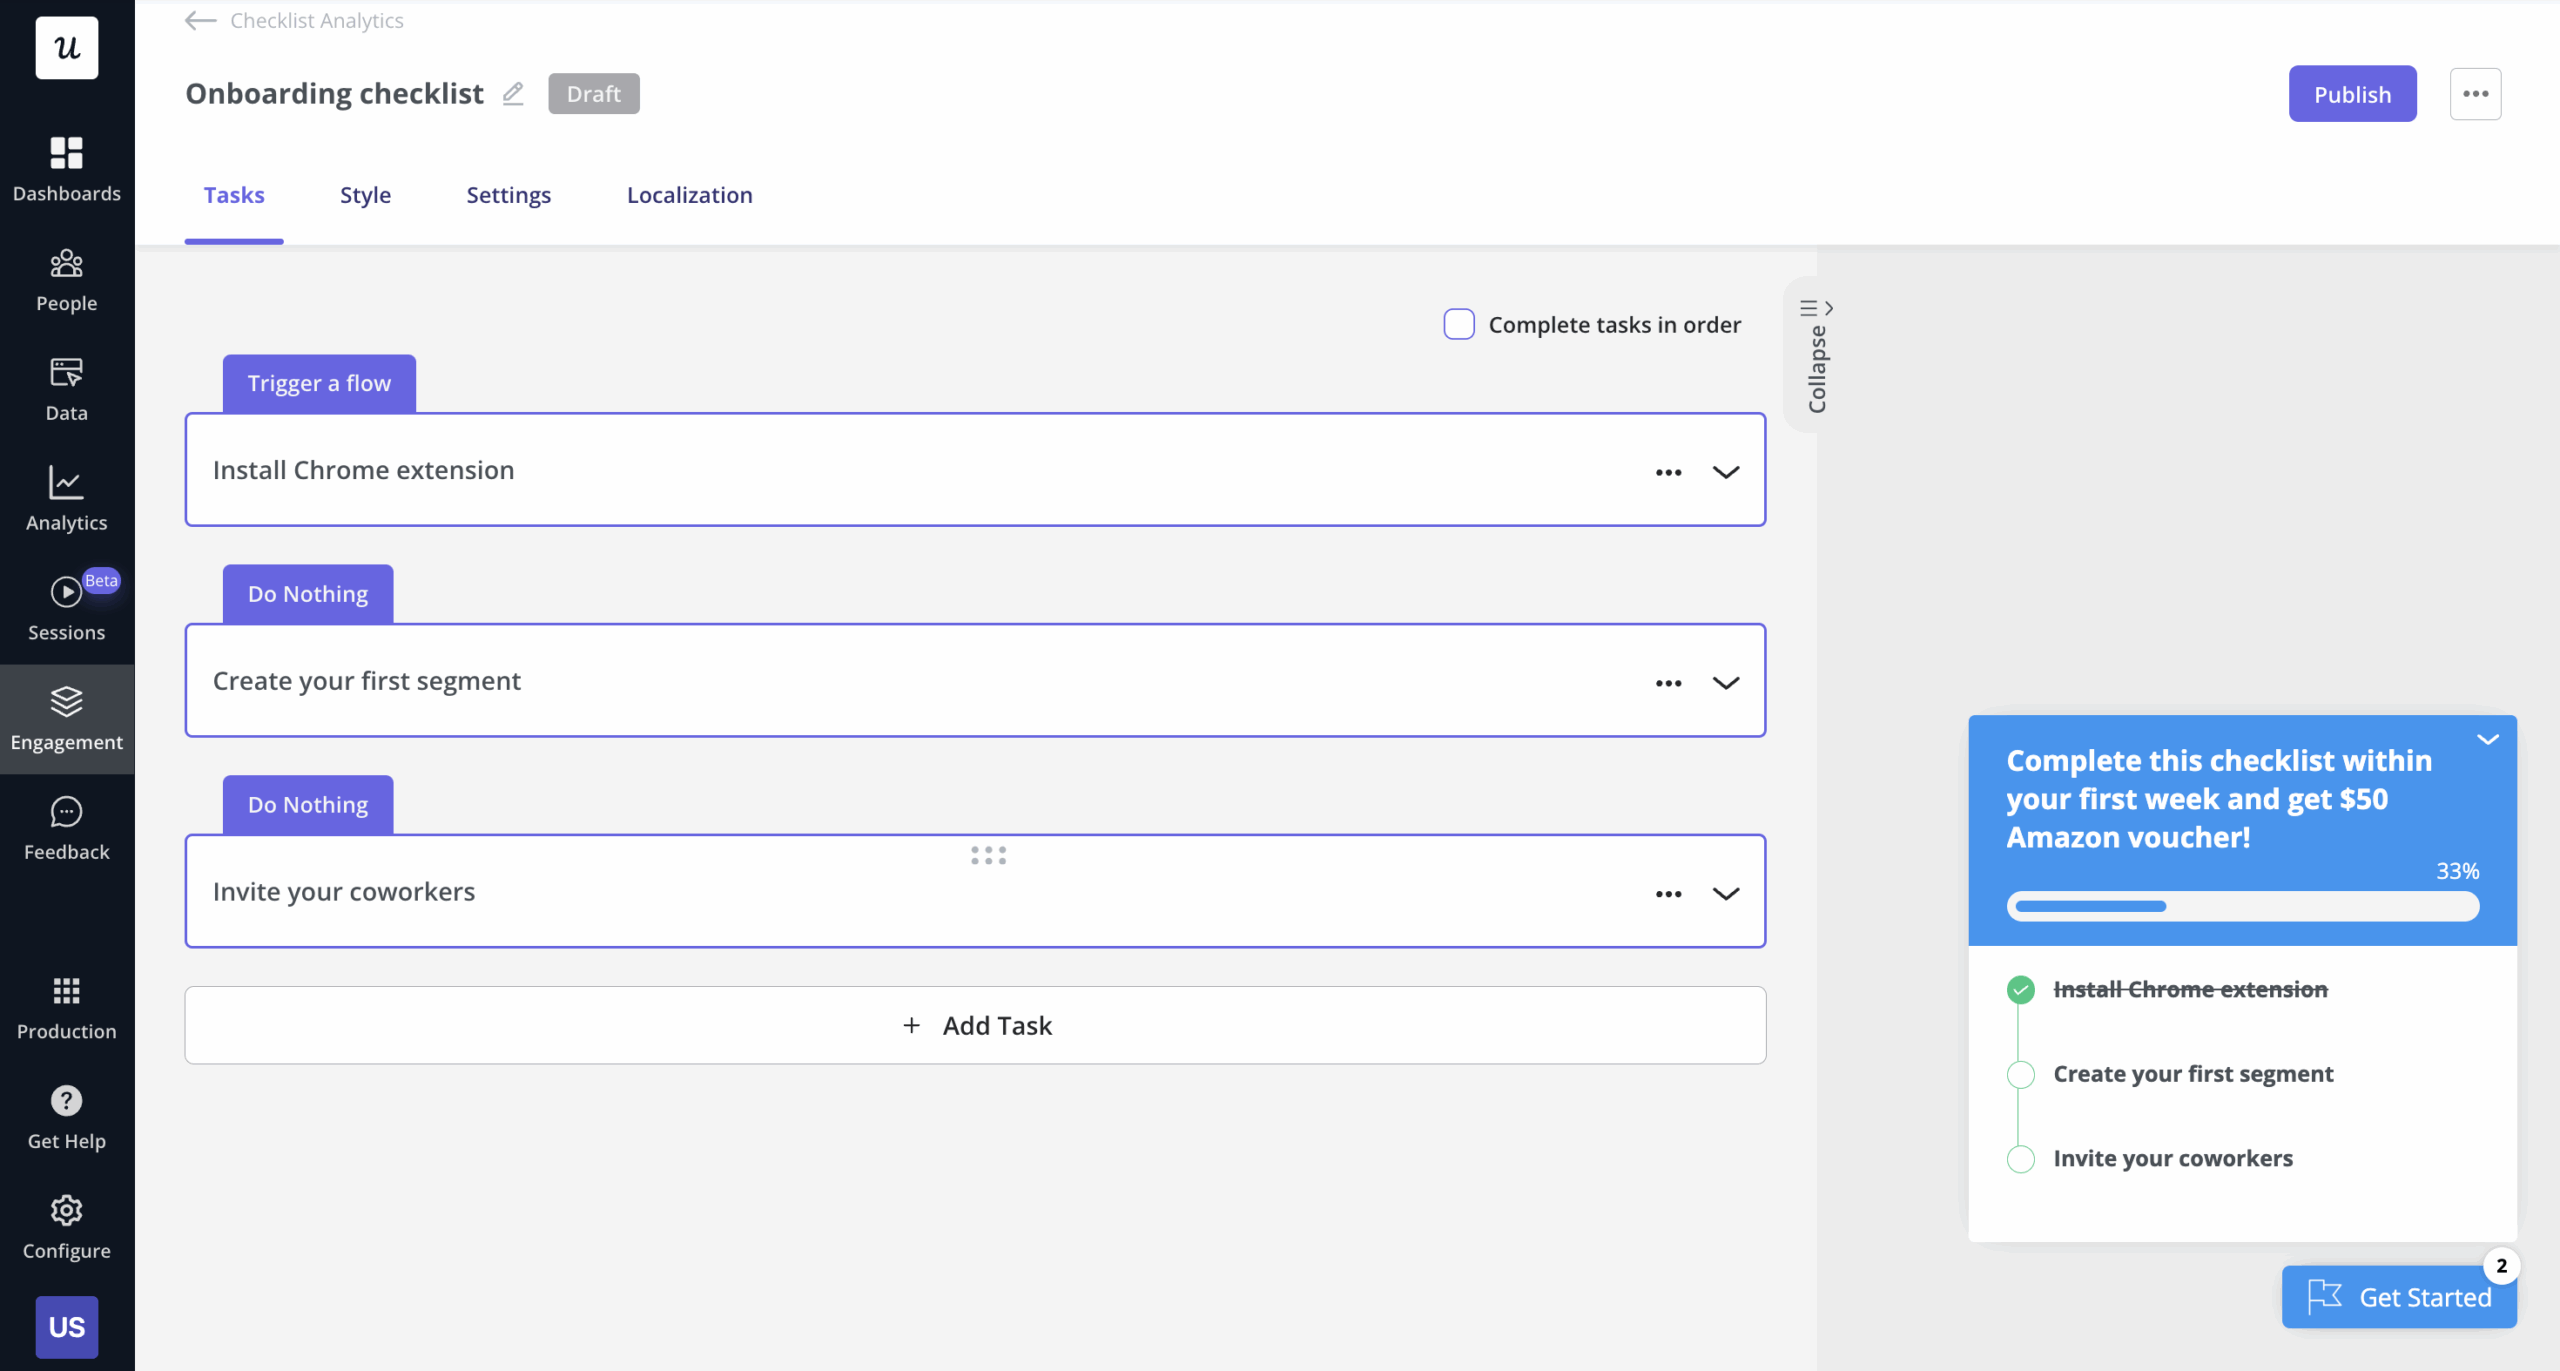
5. Create a checklist to activate existing customers
A checklist tells users exactly what to do and in what order, removing any guesswork that could kill first-session momentum. Adding a progress bar and pre-completed tasks leverages user psychology to make them more likely to finish remaining items on the list.
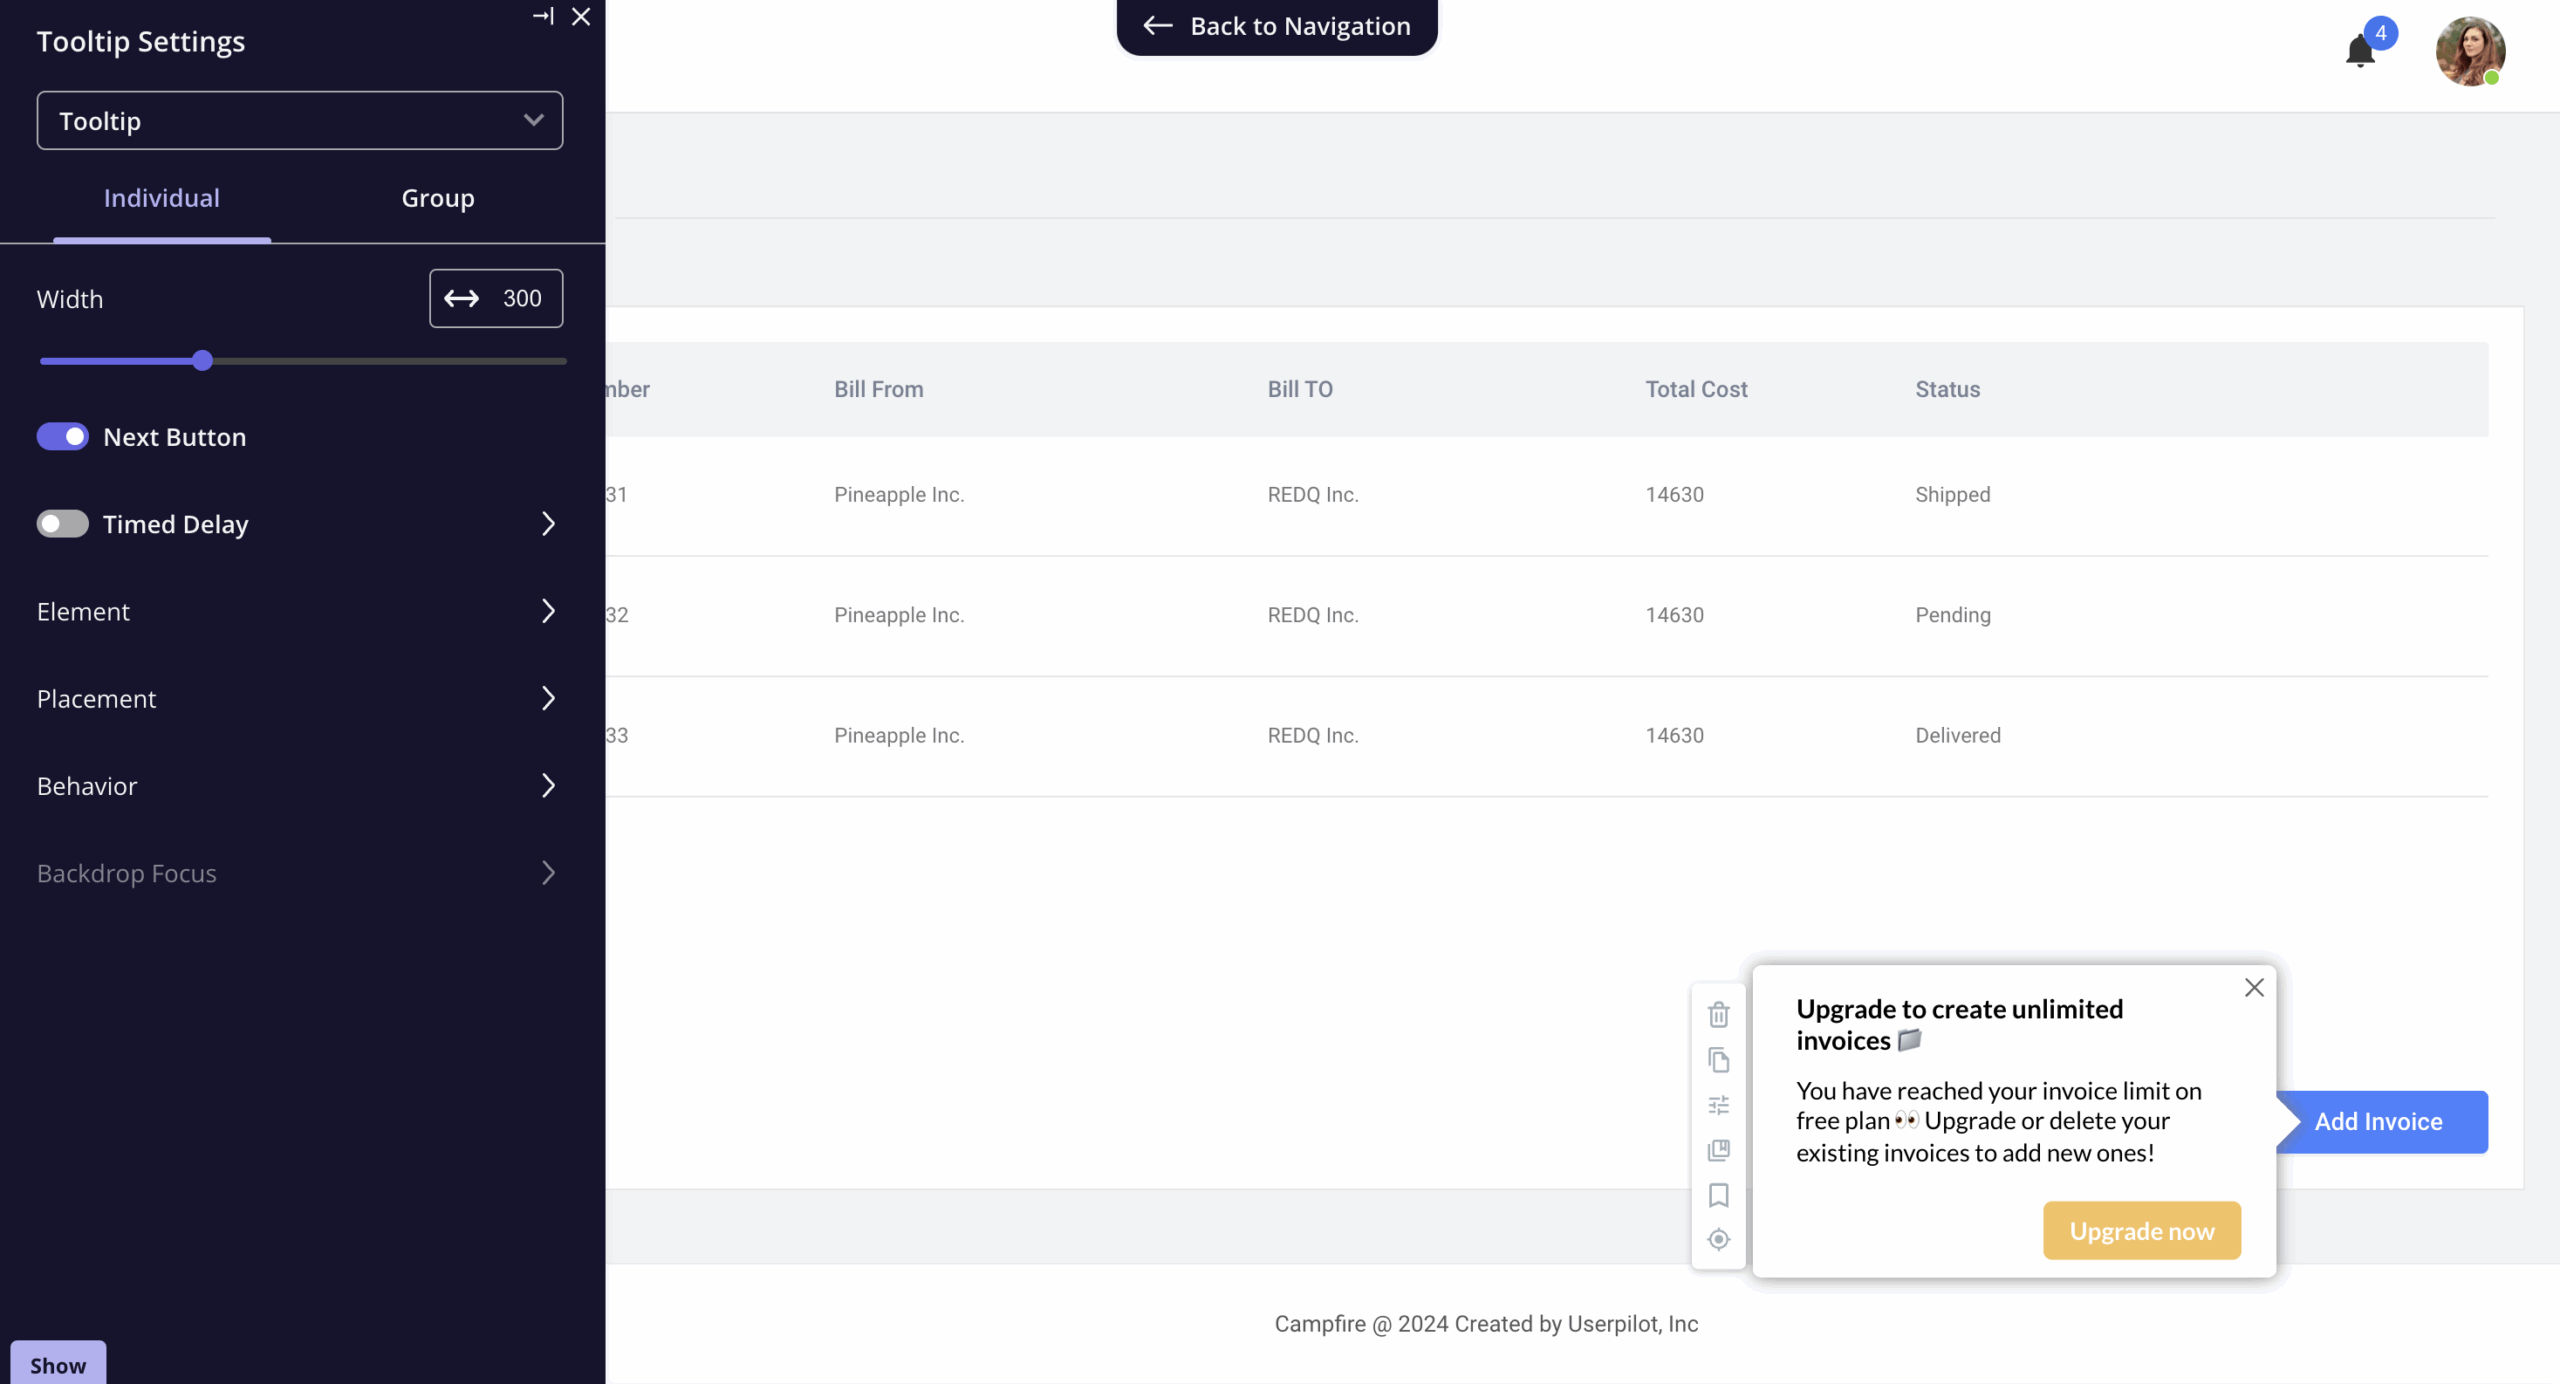
6. Announce new features to increase customer retention
Don’t sit on a new feature announcement until launch day. Tease it across in-app messages, social, newsletters, and paid ads before release, then use in-app messages after it ships to drive discovery and adoption. However, keeping these announcements on pace with feature velocity gets harder as AI continues to lower the amount of time and money needed to ship product updates.
Userpilot’s CEO, Yazan Sehwail, highlighted the challenges that occur as building products or features gets cheaper and faster:
“As producing and building features become a lot cheaper, instead of every quarter, you’re releasing one or two features, now you’re releasing 7, 8, 9. It becomes even harder for product teams to manually have to track each one and understand usage for each one.”
A feature nobody knows exists doesn’t provide value to any user, regardless of how quickly or cheaply you were able to ship it. That’s why in-app feature announcements are so key to driving feature adoption for new and old features alike.
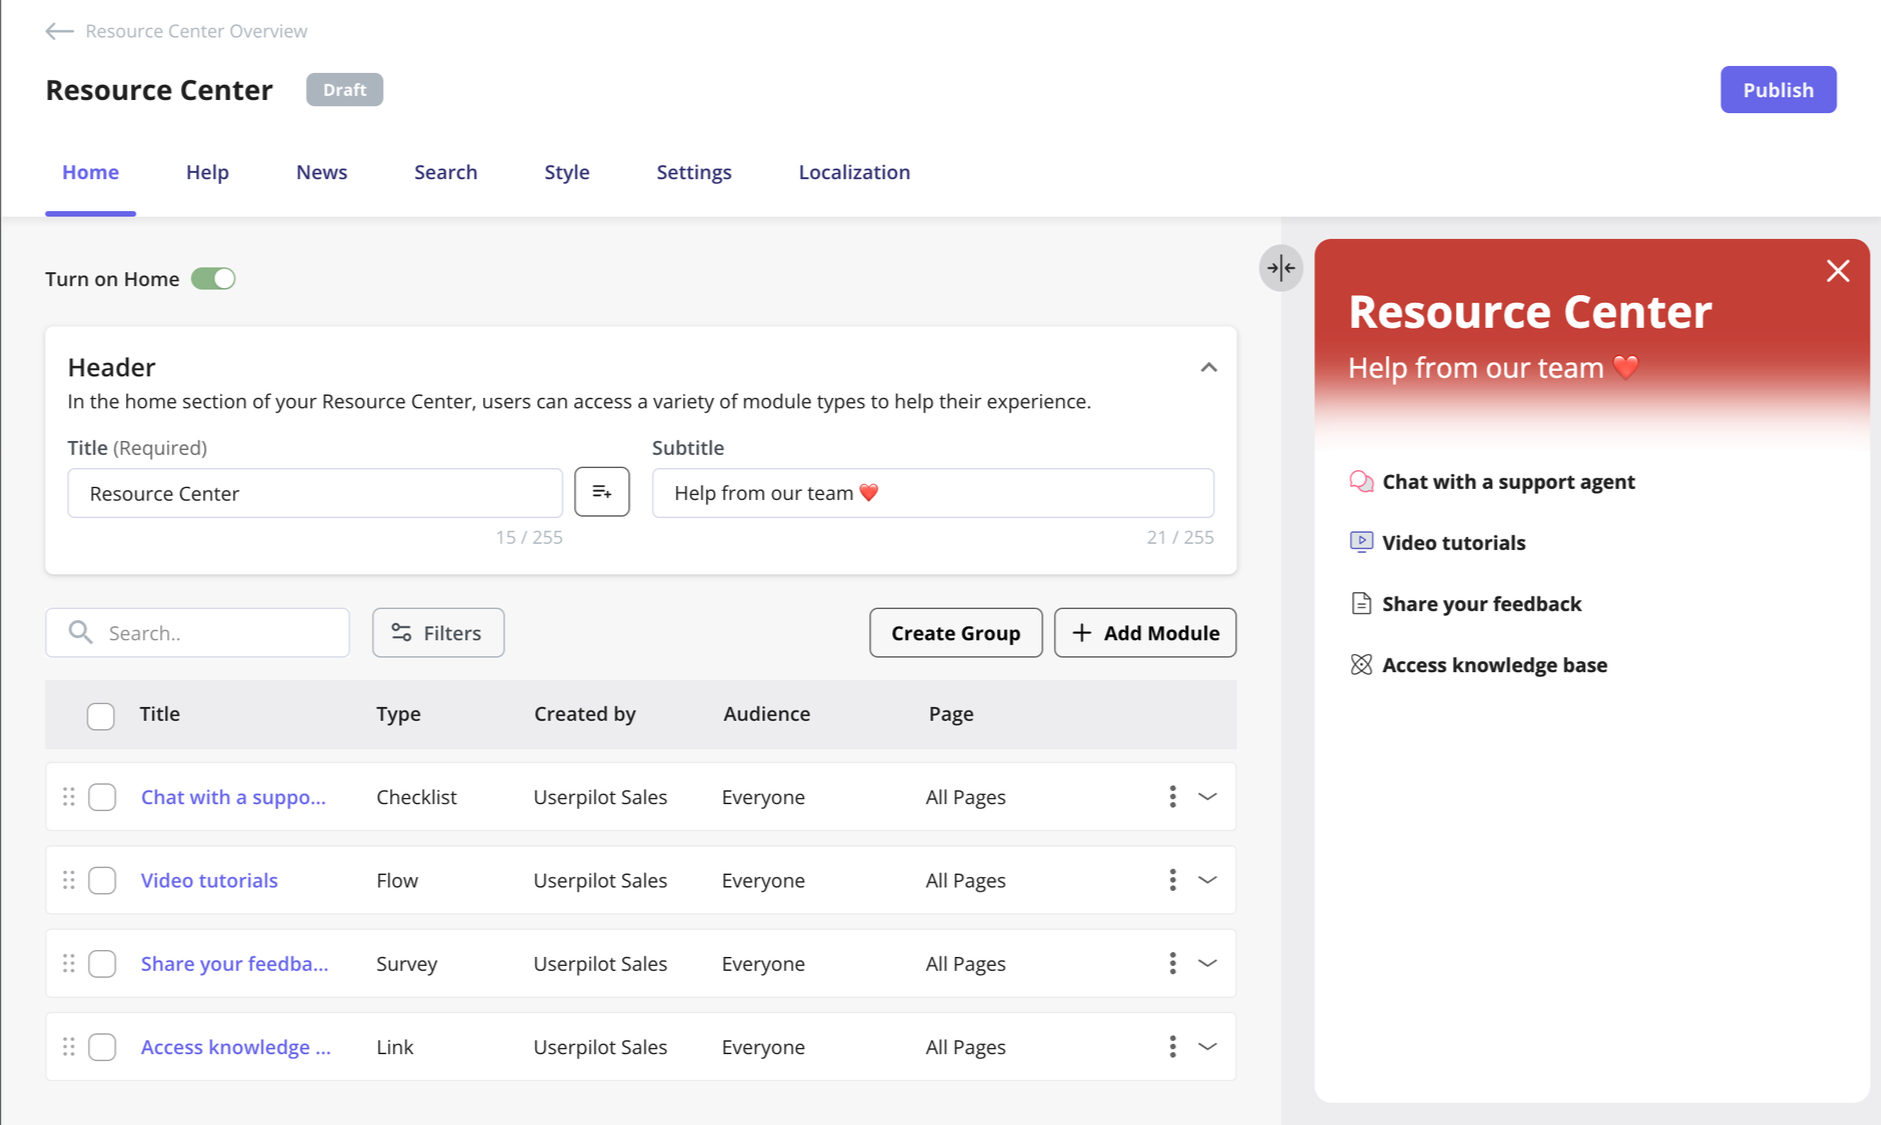
7. Provide self-service support to guide users
Most users would rather solve a problem themselves than open a support ticket, with 81% of all customers attempting to take care of matters themselves before reaching out to a live representative. Knowledge bases, video tutorials, and community forums provide the self-serve infrastructure that these users need to unblock themselves without waiting for CS agents to respond.
Investments in self-serve infrastructure also benefit companies by reducing support ticket volume instead of taking the easy (but expensive) way out by simply hiring more customer support representatives to handle the ever-growing number of tickets.
8. Collect customer feedback to measure satisfaction levels
Collecting customer feedback tells you how users are feeling and provides a steady stream of ideas for what to build next. When it comes to choosing feedback channels, in-app surveys typically get higher response rates than emails because they reach people while they’re actively using the product. This helps you capture fresher feedback that reflects user sentiment in the moment rather than asking them to recall their experiences from a week ago. However, email is still worth keeping around for reaching inactive users who’ve stopped opening the app.
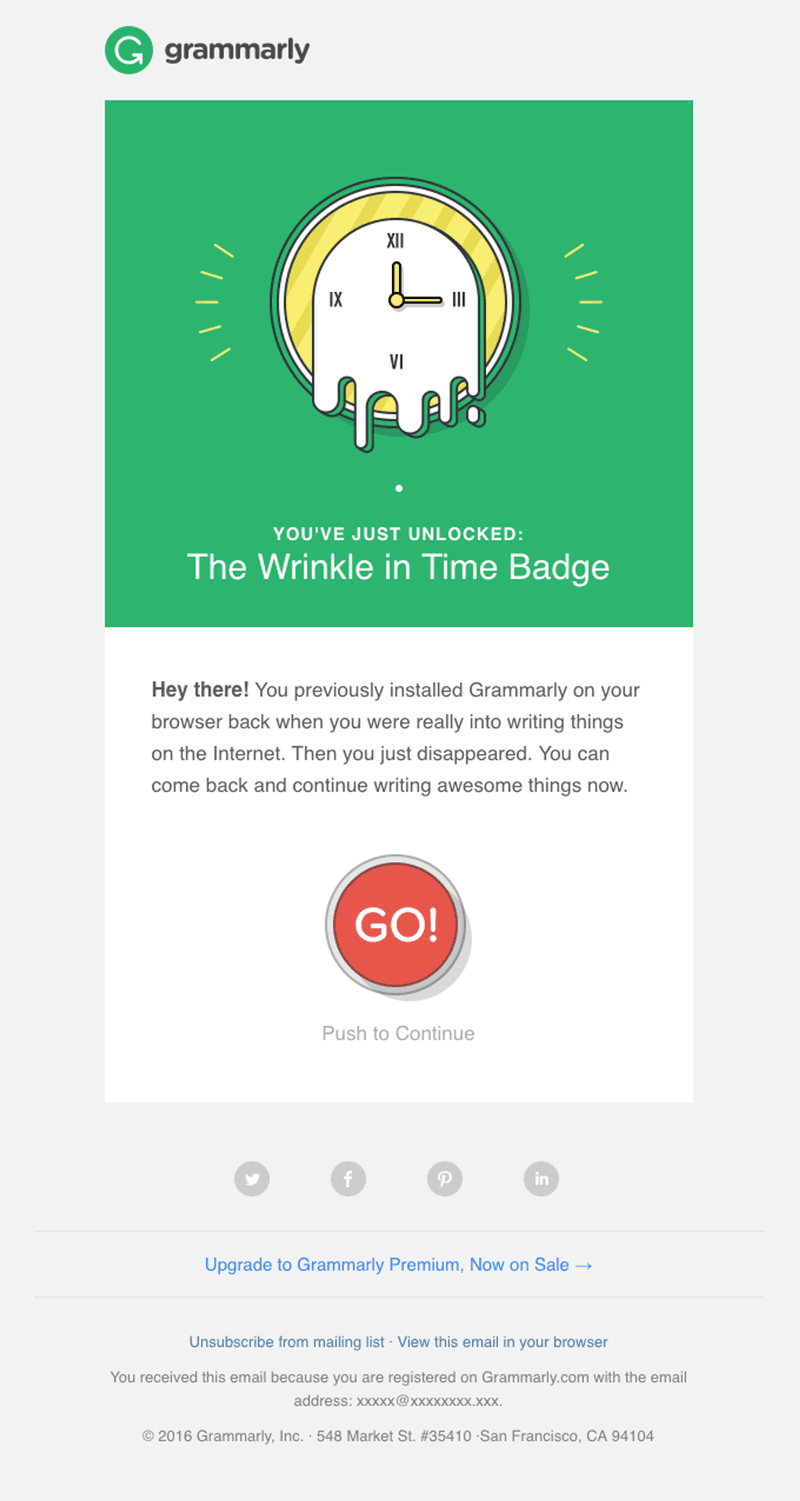
9. Send re-engagement email campaigns to inactive users
Email isn’t just a survey delivery mechanism but also one of the more reliable ways to win inactive users back. Grammarly’s re-engagement emails are a good reference for what personalized winback sequences look like in practice.
Re-engagement sequences work best when using a CRM that talks to your email and analytics tools (or at least an analytics tool that supports webhooks with third-party platforms). Userpilot covers both paths by letting you track engagement, segment inactive users, and trigger re-engagement emails via webhooks or sync the data into HubSpot and Salesforce to run the campaign from there.
10. Launch a referral growth strategy for getting new customers
Happy customers already want to tell people about your product, so all a referral program needs to do is offer an incentive to refer a friend or nudge them to leave a review on G2. Dropbox’s referral program is the textbook example that most growth marketers are familiar with, but it still holds up because the reward was immediate and mutual (with both sides getting more storage when the referral converted).

11. Trigger upsell messages to increase customer lifetime value
There are only two ways to grow customer lifetime value. You either keep customers longer or get them to spend more while they’re with you, ideally both. In-app upsell messages are how you do the latter without manual sales effort. Trigger upsells contextually when someone hovers over a premium feature, clicks on a locked product area, or is about to hit the usage limit on their current plan. Keep the frequency low since intrusive upsell prompts are exactly the kind of thing that makes users look for alternatives instead of upgrading their subscription.
Growth marketing strategy best practices
Now that you have eleven growth marketing strategies to choose from, the six best practices below will provide the structured execution necessary to get the most out of each one.
Set goals that align with the full customer lifecycle
Developing a growth marketing strategy starts with goal-setting, since it focuses your efforts and keeps them aligned with the product vision. A general goal like “increase revenue” or “grow market share” is a starting point but frameworks like OKR or BHAG can help flesh it out further. Personally, I prefer the SMART (Specific, Measurable, Achievable, Relevant, Time-bound) framework.
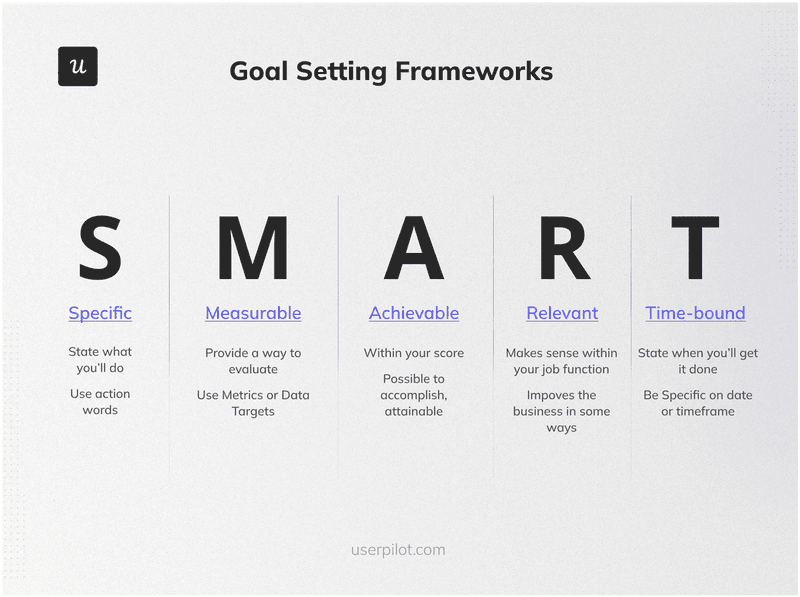
That said, I like adding a “C” for challenging. These “CSMART” goals read something like “increase MRR by 22% by the end of the year,” which is specific enough to plan against yet ambitious enough to move the needle.
Map the customer journey stages you’re optimizing for
Once goals are set, map the stages of the customer journey you’re trying to target. Most SaaS products share a similar progression of awareness, acquisition, activation, adoption, retention, referral, and revenue. Each stage answers a different question.
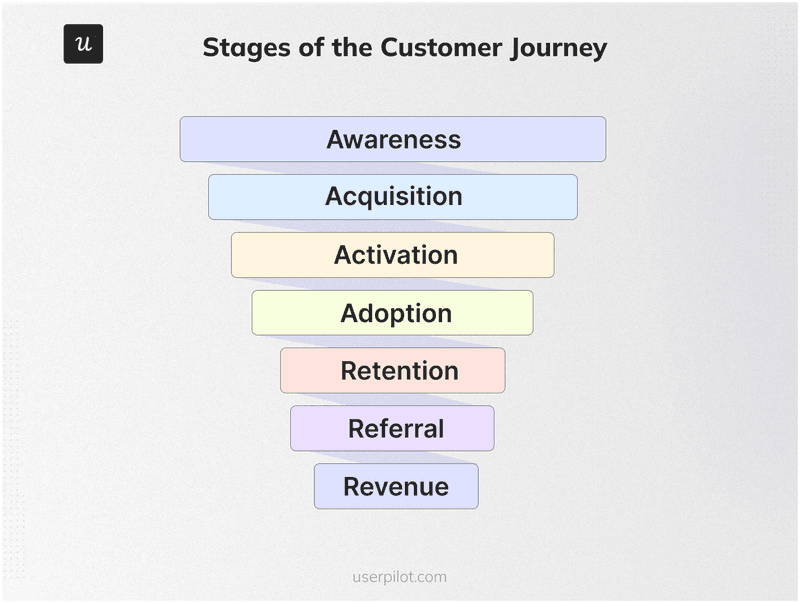
Awareness is when someone discovers you, acquisition is the free trial signup, and activation is the moment they experience real product value. The remaining stages of adoption, retention, and referral are where a growth strategy either compounds or stalls. Revenue is the last stage where freemium users upgrade to a paid plan or existing customers buy add-ons that generate expansion revenue.
Track metrics for each customer journey stage
Growth marketing touches every stage at once, which means you need metrics that span the entire lifecycle to accurately measure its results. This ranges from trial signup volume or customer acquisition cost at the top of the funnel all the way down to expansion MRR at the bottom.
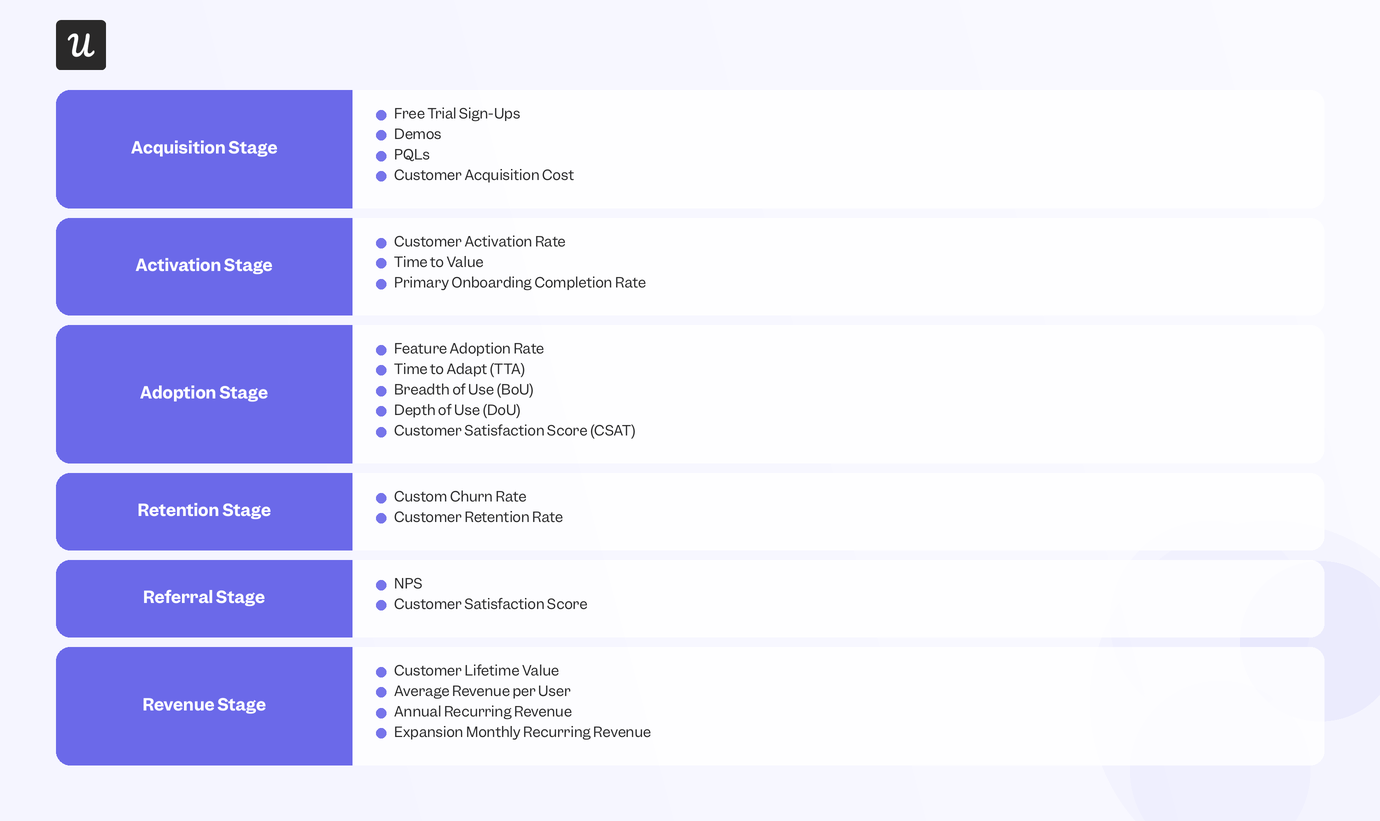
Don’t ignore metrics like time to value or NPS scores since they can determine whether users make it from the top of the funnel to the bottom or get stuck somewhere in between because they didn’t have their Aha moment soon enough.
Focus your efforts where the metrics are weakest
Once the metrics start flowing, look for where the numbers are actually lagging rather than spreading your effort evenly across every stage. A weak activation rate points you toward onboarding, while soft revenue numbers could require upsells. Behavioral user path analysis can help identify where users are stalling and thus provide hints on which stages require an intervention. Those who are getting stuck on onboarding need different guidance than a freemium user who hasn’t converted to premium despite months of constant product usage.
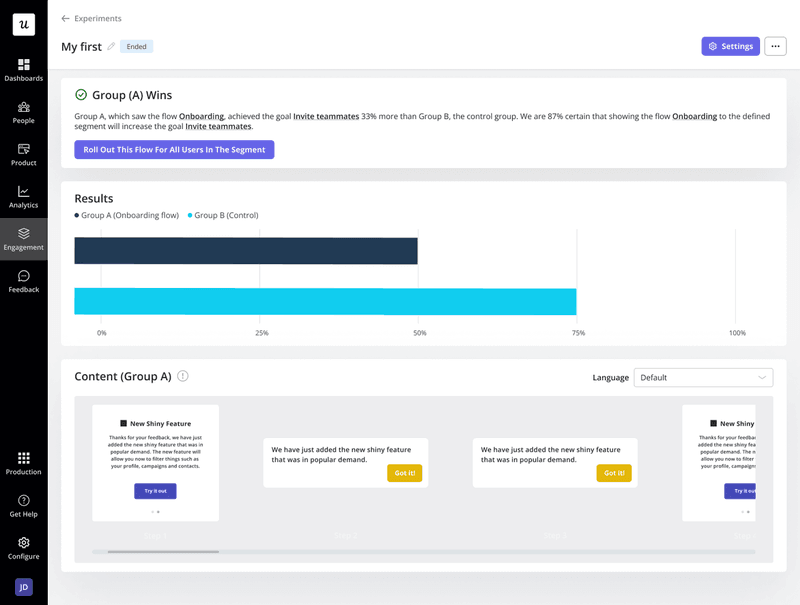
Run experiments before scaling what works
When you find out why a metric is underperforming, translate that diagnosis into a specific marketing tactic to execute on. A weak adoption number calls for in-app guidance that drives feature adoption while a lack of online reviews may just require prompting users with the highest NPS track records. Start with whichever change has the biggest expected upside, then gradually work your way down the list once the low-hanging fruit has turned into quick wins.
Userpilot product manager Abrar Abutouq’s own experimental instincts are worth taking inspiration from:
“Every single suggestion you gather from feedback, from AI or a teammate, it’s an experiment. You need to try it out. The product is all about experiments.”
Monitor results and continuously iterate
As changes go live, track their effect on the metrics they were meant to move. A unified dashboard aggregating every key metric makes this a five-minute check you can do daily instead of a monthly or quarterly report to manually compile. Even if the dashboard looks fine, keep collecting user feedback and running experiments. A/B testing your microcopy may not be as flashy as planning out an entire campaign, but these small details can have an outsized impact on growth.
Turn growth marketing into compounding growth, not just more activity
The fact that companies are spending $2.82 to get $1 of ARR back is proof that acquisition-only thinking can do more harm than good. It’s the version of growth marketing that spends money everywhere except on the customers that are actually using the product. True growth marketing works because it spreads its coverage across the entire lifecycle instead of stopping at the conversion event. The eleven strategies above operate at every stage to keep LTV:CAC sustainable, even as paid channels get pricier and organic reach takes longer to compound.
Running these strategies without a platform that connects product analytics, in-app engagement, customer feedback, and lifecycle automation means stitching together multiple tools that bleed insights at every handoff. Userpilot gives growth marketing teams one place to build segments, trigger flows, run experiments, and gather feedback across every stage of the journey. Book a demo to see what that can do for your growth marketing initiatives!
About the author