User Behavior Analytics (UBA): How AI Agents Are Changing Things for SaaS in 2026


User behavior analytics (UBA) is the reason we know a signup screen is confusing before a single support ticket says so. It shows you where accounts stall in onboarding, which button gets ignored, and which page people rage-click right before they leave. This human behavior shows you what area of your app needs improvements.
That’s starting to change, because a growing share of the traffic inside SaaS products now comes from AI agents that log in, call an API, and complete a task on a human’s behalf without ever touching a mouse.
User behavior analytics is different from plain web analytics in one specific way. Web analytics counts how many people visited a page. UBA tracks what they did once they got there: where they clicked, how far they scrolled, and which features they touched before they churned.
That distinction is exactly where AI agents cause a problem. Because UBA tools are built to read clicks, mouse movement, and hesitation, they have nothing to read once the “user” is a script calling an endpoint. In a nutshell, they’re blind to this traffic.
This post delves into the strategies you can use to track user behavior in the era of AI agents.

What user behavior analytics tools can actually track (and what changed)
User behavior analytics tools are built to answer one question: what does a real person do inside your product? For years, the answer came from four data types: clicks, mouse movement, in-app navigation, and direct feedback. Here’s a closer look at each:
- Click tracking shows which buttons, menus, or features people touch most inside your product. Dead clicks (taps on something that does nothing) flag confusing UI before a single support ticket does, and rage clicks flag outright frustration the same way.
- Scroll and cursor data works on the same principle. It shows what people ignore, where they hesitate, and how far down a page they actually get before giving up.
- Navigation data maps the exact path someone takes from page to page, including where they loop back or abandon a flow entirely.
- In-app surveys round out the picture with direct feedback collected at the exact moment a user hits a key step, eliminating guesswork.
All four data types share one assumption: that a human is on the other end doing the clicking, scrolling, and typing. That assumption is now wrong for a meaningful slice of SaaS traffic, and it’s only getting worse.
The blind spot of user behavior analytics tools
AI agents don’t use your product the way a person does. Instead of clicking through a UI, most agents connect through MCP (Model Context Protocol) servers or direct APIs, call the function they need, and get a structured response back.
There’s no cursor to track, page to scroll, or button to rage-click, because the agent never rendered the UI in the first place. To your click tracker, dead-click detector, and scroll heatmap, that entire interaction simply didn’t happen. Agents don’t answer surveys as well.
What makes this important is that it’s not an edge case. HUMAN Security’s 2026 State of AI Traffic and Cyberthreat Benchmark Report found that automation is now growing eight times faster than human traffic, with agentic AI traffic up 7,851% year over year. It’s likely that you already have some users deploying AI agents to get work done.
The two-pronged approach to user behavior analytics
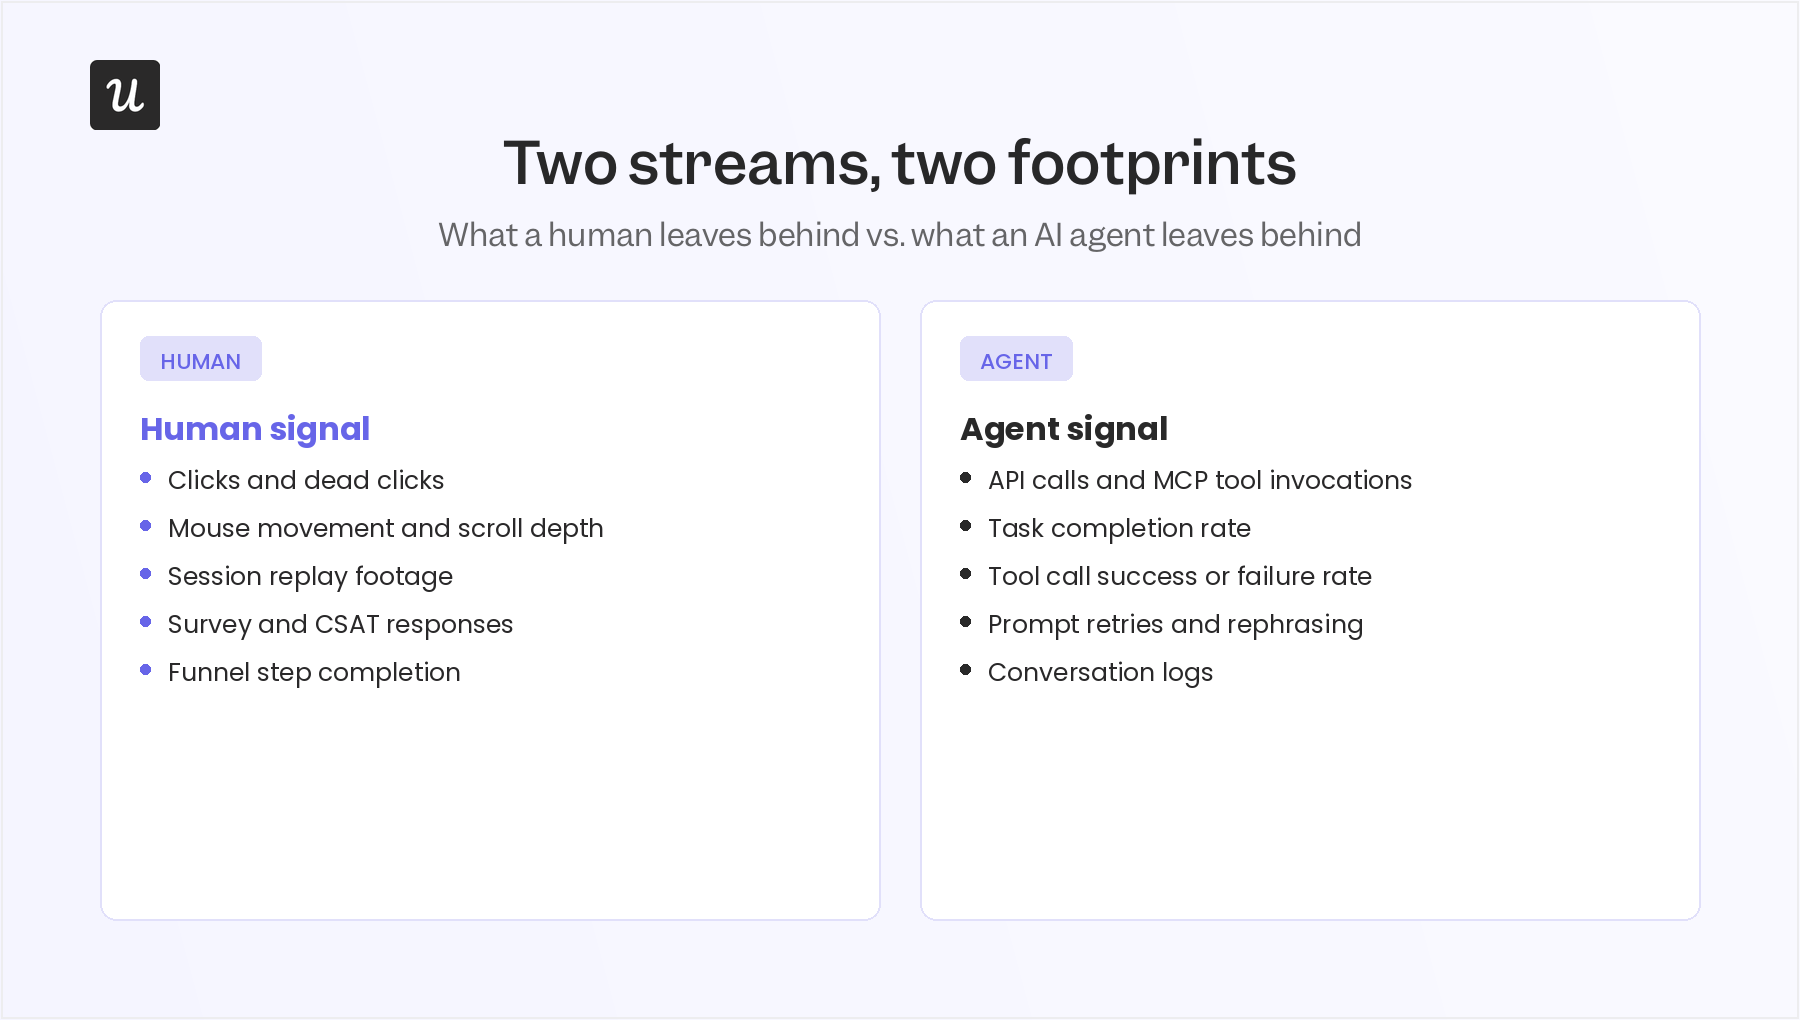
Once you accept that user behavior analytics now covers two different kinds of users, the fix involves running two tracks side by side, one for humans and another for agents, because they leave completely different footprints.
Analyzing human behavior
For human users, the five methods that already exist still hold up. They just need to run alongside the agent-side tracking below.
- Session replays: Watch an actual recording of a user’s session to see what they see, click on, and type. It helps you identify what “normal” behavior looks like so you can spot the abnormal kind.
- In-app surveys: NPS, CSAT, and CES surveys collect direct feedback at the moment it’s most accurate.
- Funnel analysis: Funnel tracking shows your entire user journey and tells you exactly where in a flow people drop off. It helps you find specific friction points to fix.
- Event tracking: Monitoring specific actions like signups, submissions, or feature clicks gives you the granular data everything else is built on.
- A/B testing: Running live variants of pages, features, and elements to test which one performs better among your users. It helps you make data-driven product decisions.
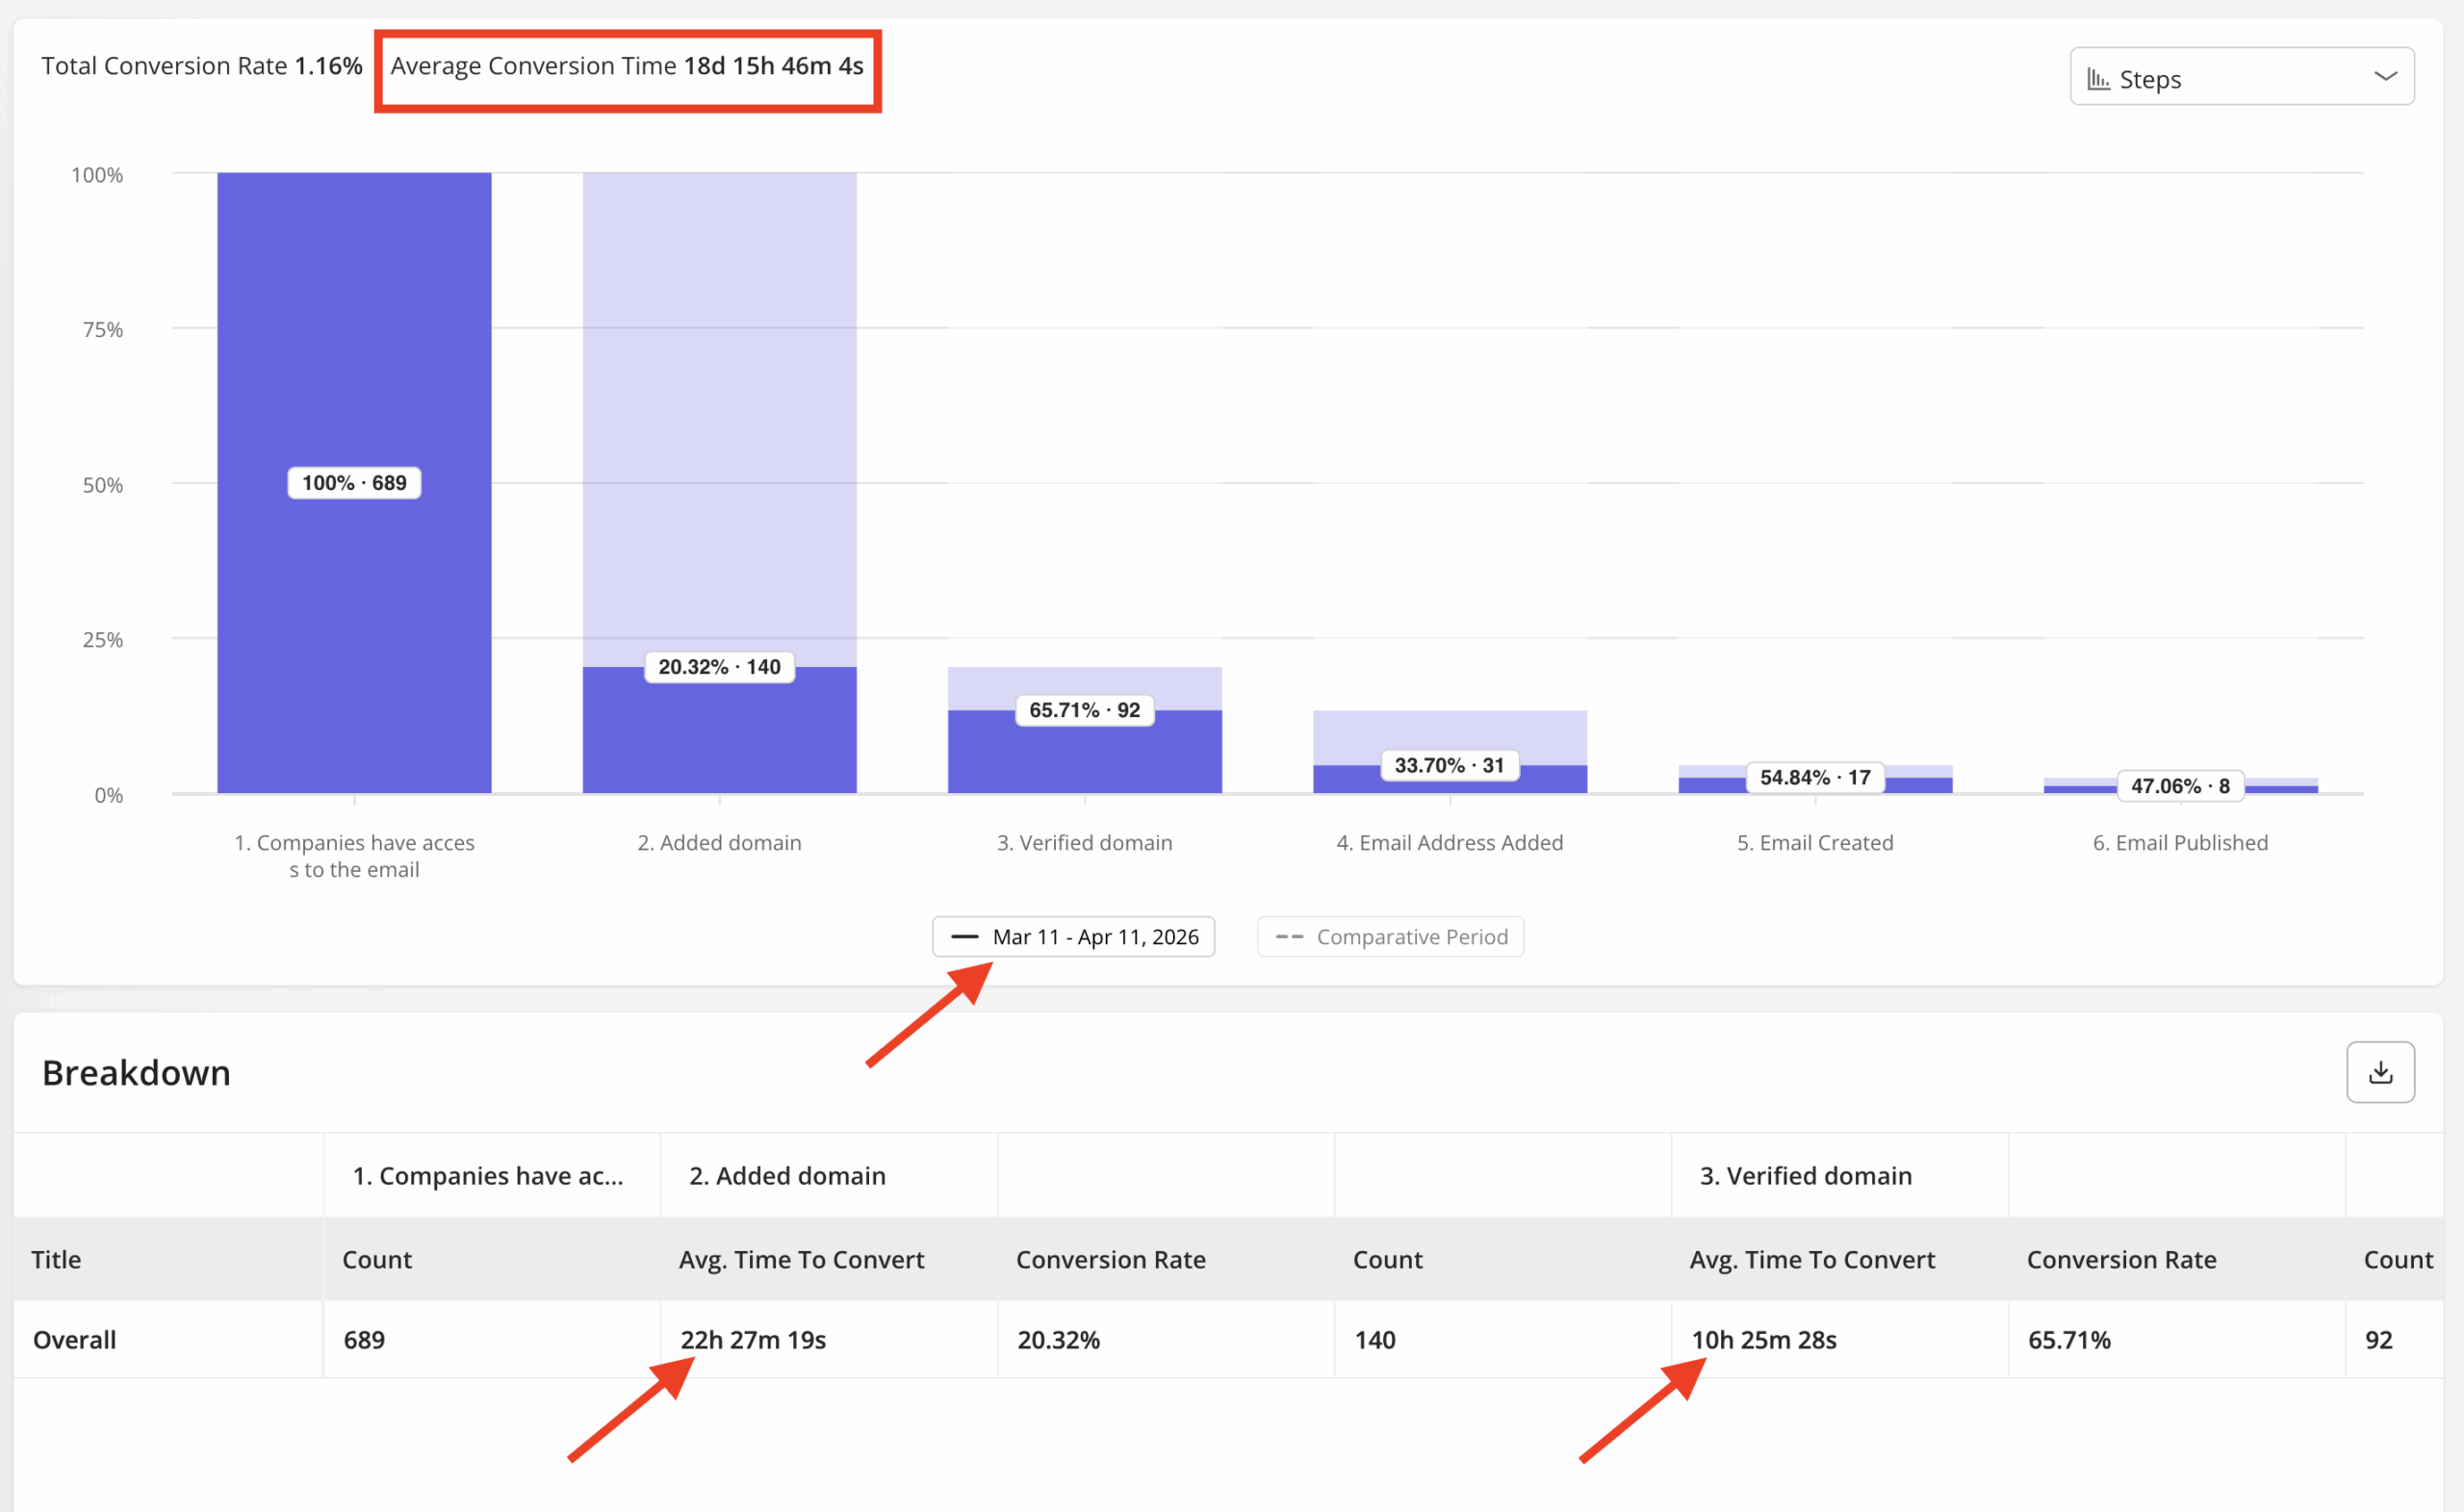
For instance, when Userpilot’s own email feature shipped, our funnel report showed a sharp drop-off right at domain verification, which told us that it needed fixing. Here’s a quick fix I made that halved the conversion time:
“Within a few hours, I just created a targeting modal and showed it to users and highlighted the correct steps for them to make it clear what to do next. That helped a lot in reducing friction and supporting users in real time without involving our dev team.”
Lia and MCP: Turning UBA into a plain-English query
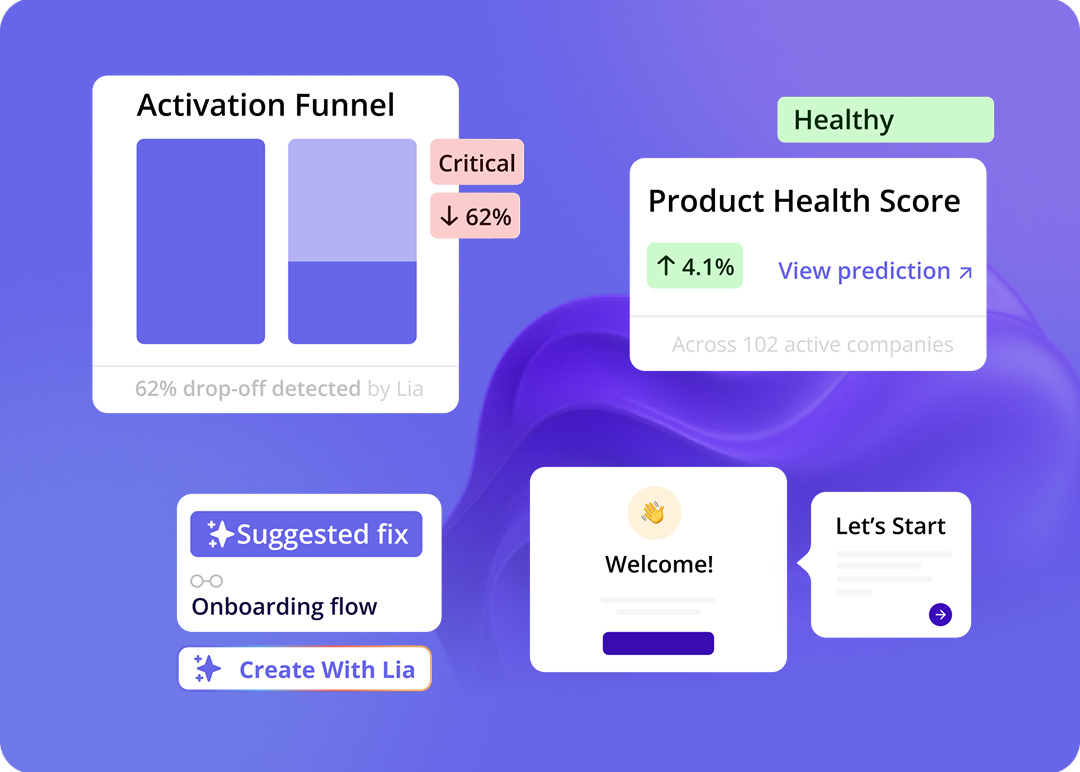
The five methods above are powerful, but they all require someone who knows how to read a funnel chart or a heatmap. Lia, Userpilot’s AI agent, changes that part. Instead of building a report, you ask a question in plain English, like why signups dropped last week, and it’ll pull the answer from the same underlying data instantly. It means you can access insights without the long, manual effort of fetching reports.
Additionally, Lia delivers the key findings in a digestible format and also suggests potential next actions that you can deploy to fix user friction.
And with our MCP Server, you can achieve this using any AI tool of your choice, such as Claude, ChatGPT, or Copilot. Once connected, you can ask queries in your AI tool and it’ll fetch insights without requiring you to access Userpilot.
Tracking AI agentic traffic
If human behavior needs the five methods above (the human stream), agent behavior needs a different lens entirely, because an agent’s version of a rage click is not a click at all. The agentic activity simply won’t show up in traditional tools.
That’s the reason why tools like Contentsquare have expanded their features this year specifically to give visibility into the agentic portion of your user base. With it, you can track the percentage of traffic that’s agentic and their navigation and conversion analytics.
Start analyzing your user behavior correctly
User behavior analytics was built for one kind of user, and for most of its history that was enough. It isn’t anymore, and pretending your existing dashboards already cover agent traffic just because nothing is technically broken is how teams end up flying blind on a growing share of their own product.
If you’re only running the human-side methods above, you are correctly measuring the behavior of only a part of your user base. And with agents like Lia, this process becomes much faster. The right strategy is to use the speed of agents like Lia to analyze human users and using different methods to track agentic traffic.
Get a demo of Userpilot now to start analyzing user behavior at scale with straightforward natural language queries.
FAQ
Can existing user behavior analytics tools detect AI agents at all?
Partially, and only by accident. Most UBA tools flag a session with no mouse movement and no scroll depth as low quality or a bounce, not as an agent, so the traffic gets filtered out rather than understood. You need a tool that treats API calls and MCP tool invocations as first-class events.
Is UEBA the same thing as agent behavior analytics (ABA)?
No, though they share a family resemblance. UEBA is the security-side category Gartner defined in 2015 for tracking any nonhuman entity, while ABA is a 2026 specialization built specifically to baseline AI agents acting with their own credentials, and it’s usually paired with product-side agent tracking rather than living only in the SOC.
Do I need a separate tool to track AI agent behavior, or does my analytics stack already cover it?
If your stack was built before 2025, it almost certainly doesn’t, because click-based event tracking has nothing to attach to an API call. This is exactly why you need specialized tools that are specifically built to track agentic traffic.
About the author