I Tested Top PostHog Alternatives for Product Teams in 2026


As a product manager, I know the struggle of choosing the right analytics software. We’re constantly looking for solutions that help us understand user behavior, drive adoption, and ultimately, build better products.
PostHog, with its all-in-one approach to product analytics, session replay, and feature flags, often comes up in conversations.
It’s a powerful tool, especially for engineering-heavy teams that appreciate its open-source nature and self-hosting options. However, from my experience, “all-in-one” doesn’t always mean “best-in-class” for every single feature.
In this guide, I’ll break down some of the most popular PostHog alternatives, comparing their strengths, weaknesses, and what kind of team they’re best suited for.
Why seek a PostHog alternative?
Companies choose PostHog because it operates as a “Product OS”, offering all kinds of product-related analysis tools like:
- Open-source product analytics (funnels, trends, retention, paths, cohorts, dashboards).
- Free feature flags (1M free requests/month, up to 10 variations).
- Experiments (A/B testing and multivariate tests with statistical significance).
- Session replays (with mobile recordings, console logs, network activity, DOM explorer, and AI summaries) and heatmaps (with click, scroll, and mouse movement via toolbar overlay).
- Autocapture (for clicks, pageviews, form interactions).
- Easier querying via HogQL (instead of SQL).
But despite being a robust, open-source platform, PostHog has its trade-offs. Here’s what often prompts teams to look elsewhere:
- Overwhelming complexity & UX: For teams without dedicated data analysts or a large engineering team, PostHog’s interface can feel overwhelming, demanding more time and technical skill for setup and reporting.
- Incomplete data collection: Because client-side tracking can be blocked by ad software, PostHog might miss a meaningful portion of event data unless you switch to server-side or proxy tracking. This can skew how you interpret real user behavior.
- High self-hosting overhead: While self-hosting offers control, it demands substantial engineering resources for setup, maintenance, scaling, and security, often trading a SaaS fee for high internal engineering costs.
- Limited specialized depth: While it covers many areas, some of its tools, like A/B testing or session replay, might not offer the same depth or specialized features as dedicated platforms.
- Unpredictable scaling costs: PostHog’s usage-based pricing can lead to unexpected expenses as your product grows and event volume skyrockets.
These pain points highlight the need for PostHog alternatives that offer either simpler usability, more specialized capabilities, or a more predictable cost structure.
Top PostHog competitors in detailed comparisons
Let’s start with a side-by-side overview of all the PostHog alternatives. I picked these tools based on their G2 reviews, their popularity, and the maturity of their product analytics features. They include:
| Tool | Best For | Outstanding Features Compared to PostHog | Pricing | G2 Rating |
|---|---|---|---|---|
| Amplitude | Large product teams focused on predictive & retention. | Advanced retention analysis, predictive cohorts, and statistical significance testing. | Free starter tier; paid plans from $49/month; custom pricing thereafter. | ~4.5 / 5 |
| Mixpanel | Cross-functional teams owning metrics & events. | Deep event-tracking, segmentation, user/corporate metrics ownership. | Free tier available; custom pricing thereafter. | ~4.6 / 5 |
| Userpilot | Growth & product teams wanting analytics + in-app action. | Combines analytics with built-in in-app engagement; no-code flows, user surveys, and session replay. | Starts ~US $299/month for smaller teams. | ~4.6 / 5 |
| Heap | Teams wanting full retroactive capture with minimal setup. | Full autocapture of events, visual tagging, and path analysis with less upfront instrumentation. | Free plan up to ~10 K sessions/month; custom paid plans from there. | ~4.4 / 5 |
| LogRocket | Engineering/support teams focused on debugging & performance. | Session replay combined with console logs, network requests, and real-user sessions → strong dev focus. | Free tier available; paid plans start from $69/month. | ~4.6 / 5 |
| FullStory | UX/Customer experience teams. | Strong digital experience intelligence: heatmaps, frustration signals, session replays with UX focus. | Custom pricing only (contact sales). | ~4.5 / 5 |
| Plausible | Privacy-conscious website teams. | Lightweight, cookie-free web analytics; simpler than full-blown digital analytics platforms. | From ~$9/month; self-hosted open source option. | ~4.7 / 5 |
| Statsig | Engineering-led teams doing feature releases & experimentation. | Unlimited feature flags, warehouse-native experimentation, and usage-based pricing scales. | Free tier includes analytics + flags + session replays; Pro plan starts at $150/month. | ~4.7 / 5 |
Now, I’ll go into detail on each tool, focusing on how its features compare to PostHog and their pros/cons according to G2 reviews.
1. Amplitude: Product analytics with predictive insights
Amplitude is a top-tier PostHog competitor designed for product growth. It feels more structured than PostHog, with a strong focus on long-term user behavior, customer retention, and lifecycle analysis.
Nevertheless, Amplitude’s pricing can be less transparent and often higher, especially for advanced features, compared to PostHog’s generous free tier and clear usage-based model.
Amplitude vs PostHog side-by-side comparison
| Features | Amplitude | PostHog |
|---|---|---|
| Product analytics | ✔ | ✔ |
| Autocapture | ✔ | ✔ |
| Core charts (funnels, trends, paths, retention cohorts) | ✔ | ✔ |
| Predictive cohorts | ✔ | ✖ |
| Session replay | ✔ | ✔ |
| Heatmaps (click/scroll) | ✔ | ✔ |
| SQL query | ✔ | ✔ |
| Impact analysis (causal-style feature effect readout) | ✔ | ✖ |
Why it’s a good PostHog alternative:
- ML-powered predictive analytics: Amplitude’s Predictive Cohorts use machine learning to segment users based on their future behavior probability (i.e., users likely to churn, convert, or activate soon). PostHog has no equivalent ML prediction capability.
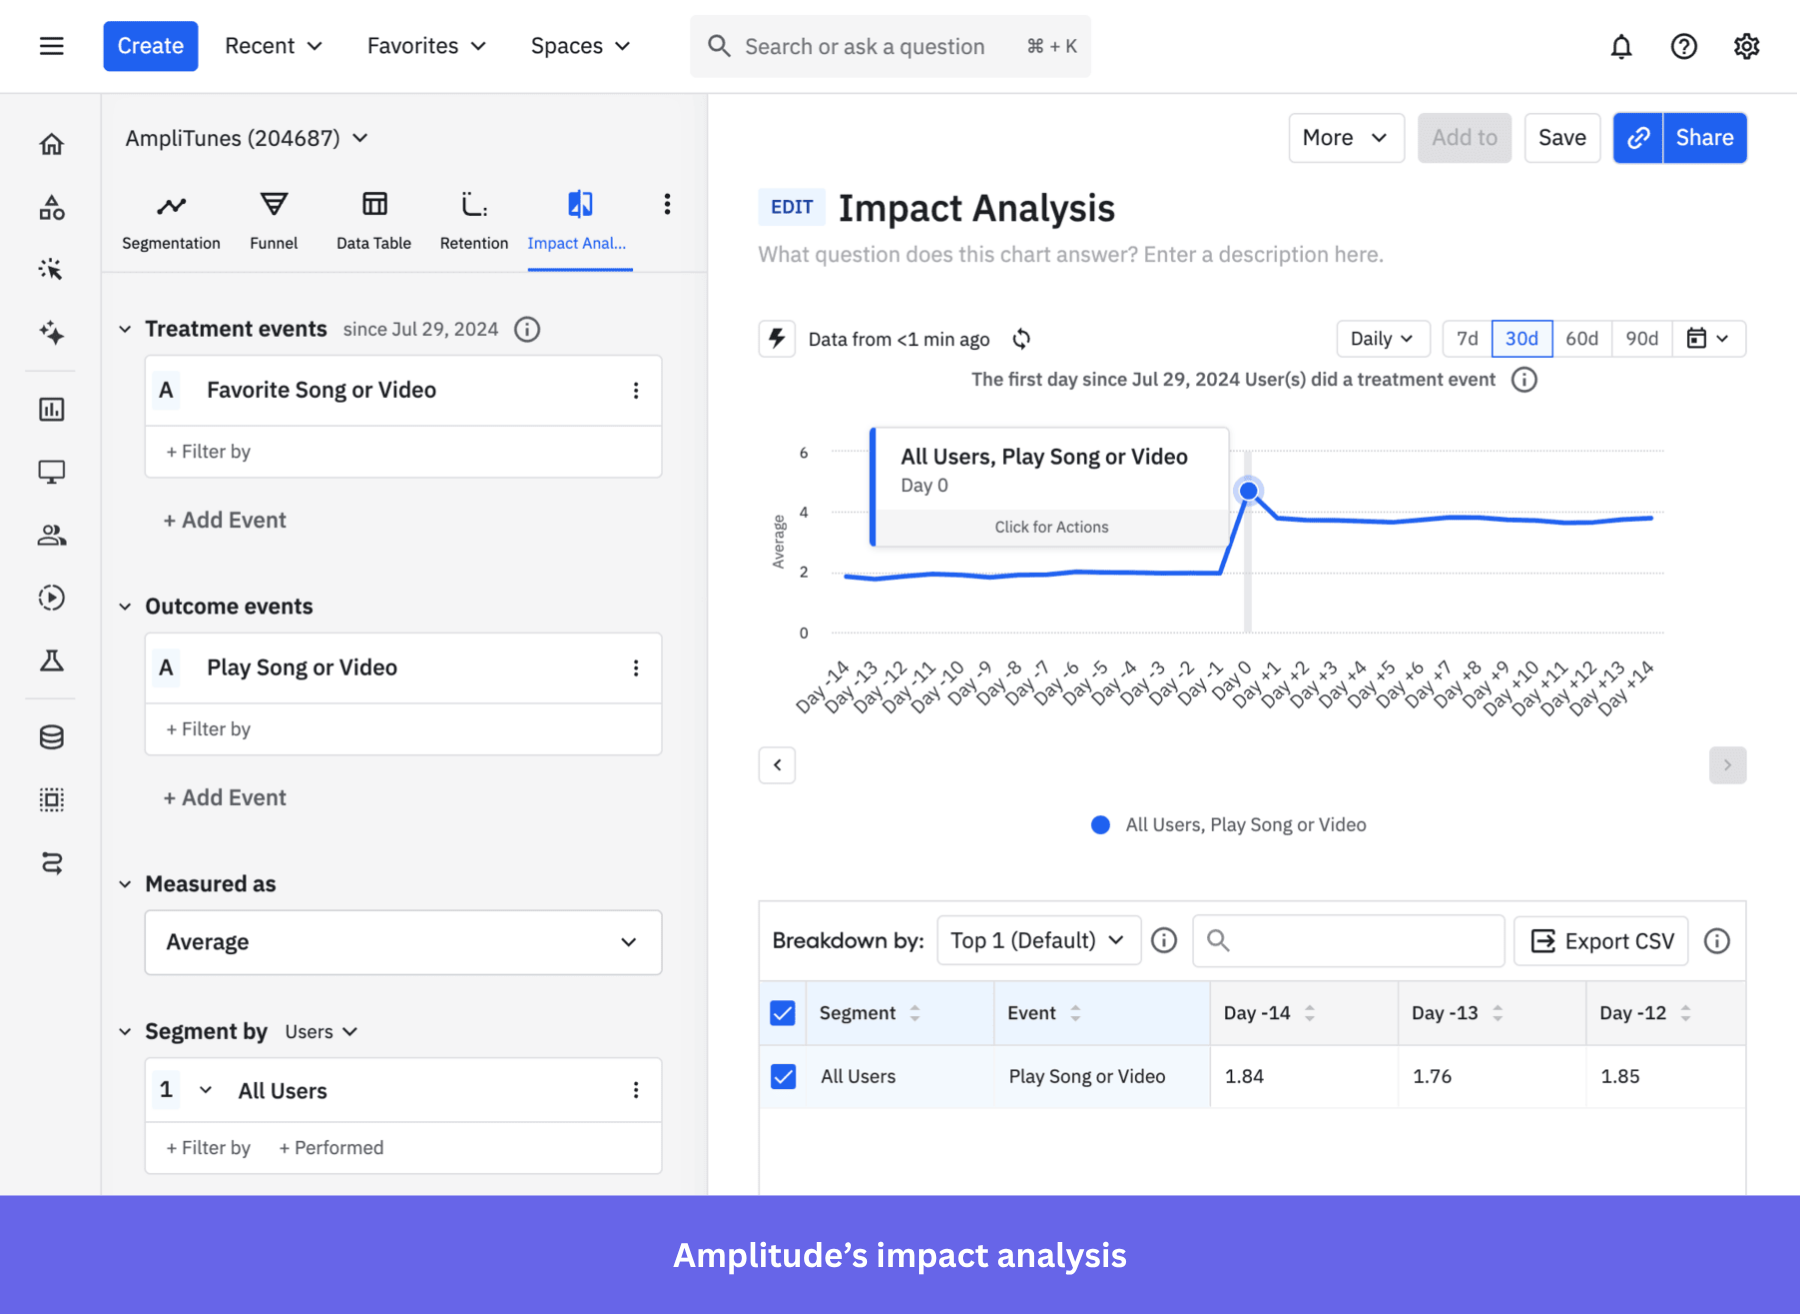
- Causal inference via Impact Analysis: Amplitude’s dedicated Impact Analysis chart measures how engagement causes behavioral changes, not just correlation. Combined with Compass (which automatically correlates in-app behaviors with retention rates), it gives you a scientific approach to finding “aha moments.” PostHog offers funnels and retention analyses, but no causal inference with statistical significance.
- Friendlier for non-technical users: Although Amplitude is a complex tool, it supports more no-code features than PostHog. For example, adding feature flags for A/B testing in Amplitude can be done without any code on a visual UI, whereas PostHog requires experience with React.
- 130+ native integrations with marketing and analytics stacks: Amplitude integrates with Braze, HubSpot, Salesforce, Segment, and 130+ tools, plus offers multi-touch attribution and campaign analytics. PostHog has very few integrations in comparison (only GitHub, GitLab, Linear, and Jira).
Amplitude pros and cons
| Pros | Cons |
| ✅ Cross-platform data: It can help you understand how users move behave across native mobile apps, web apps, and web pages. | ❌ Steep learning curve: Although it doesn’t require as much coding as Posthog, Amplitude’s interface and advanced features are still very complex. The steep learning curve can be an obstacle for non-technical users. |
| ✅ Mature analytics tools: Amplitude’s features go deep into predicting user behaviors, correlating actions with metrics, and exploring product data. | ❌ Unpredictable pricing at scale: The MTU-based pricing makes it hard to budget since you can’t predict it month by month. It also makes the product too expensive for businesses with low margins and high traffic. |
| ✅ Easy collaboration: Reports and dashboards are easy to share with other teams, such as leadership, marketing, UX teams, etc. | ❌ Feature waste: Due to Amplitude’s massive feature set, it’s easy to end up paying for unused tools if your team doesn’t need advanced predictive analytics or large experimentation. |
2. Mixpanel: Event-driven analytics for growth teams
Mixpanel has been a longtime player in product analytics, known for its focus on event analytics and deep segmentation. It relies heavily on manual event instrumentation, which can be a drawback if you prefer autocapture (although it does offer autocapture).
Unlike PostHog, it doesn’t offer built-in A/B testing or feature flags. But I think where Mixpanel makes a difference is how it helps teams take ownership of their metrics. It gives PMs, marketers, and even non-technical users the freedom to explore data, build custom dashboards, and track custom events without always bringing in engineers.
Mixpanel vs PostHog side-by-side comparison
| Features | Mixpanel | PostHog |
|---|---|---|
| Product analytics | ✔ | ✔ |
| Core charts (funnels, trends, user paths, retention cohorts) | ✔ | ✔ |
| Autocapture | ✔ | ✔ |
| Driver/Correlation discovery | ✔ Signal quantifies the correlation between an event and a goal. | ✔ Funnel Correlation auto-highlights events/properties that most affect conversion. |
| Launch/Feature impact readout | ✔ | ✖ |
| SQL query | ✔ JQL exists but is in maintenance mode and scheduled for deprecation (Dec 31, 2025). | ✔ |
| Heatmaps | ✔ | ✔ |
| Session replay | ✔ | ✔ |
Why it’s a good PostHog alternative:
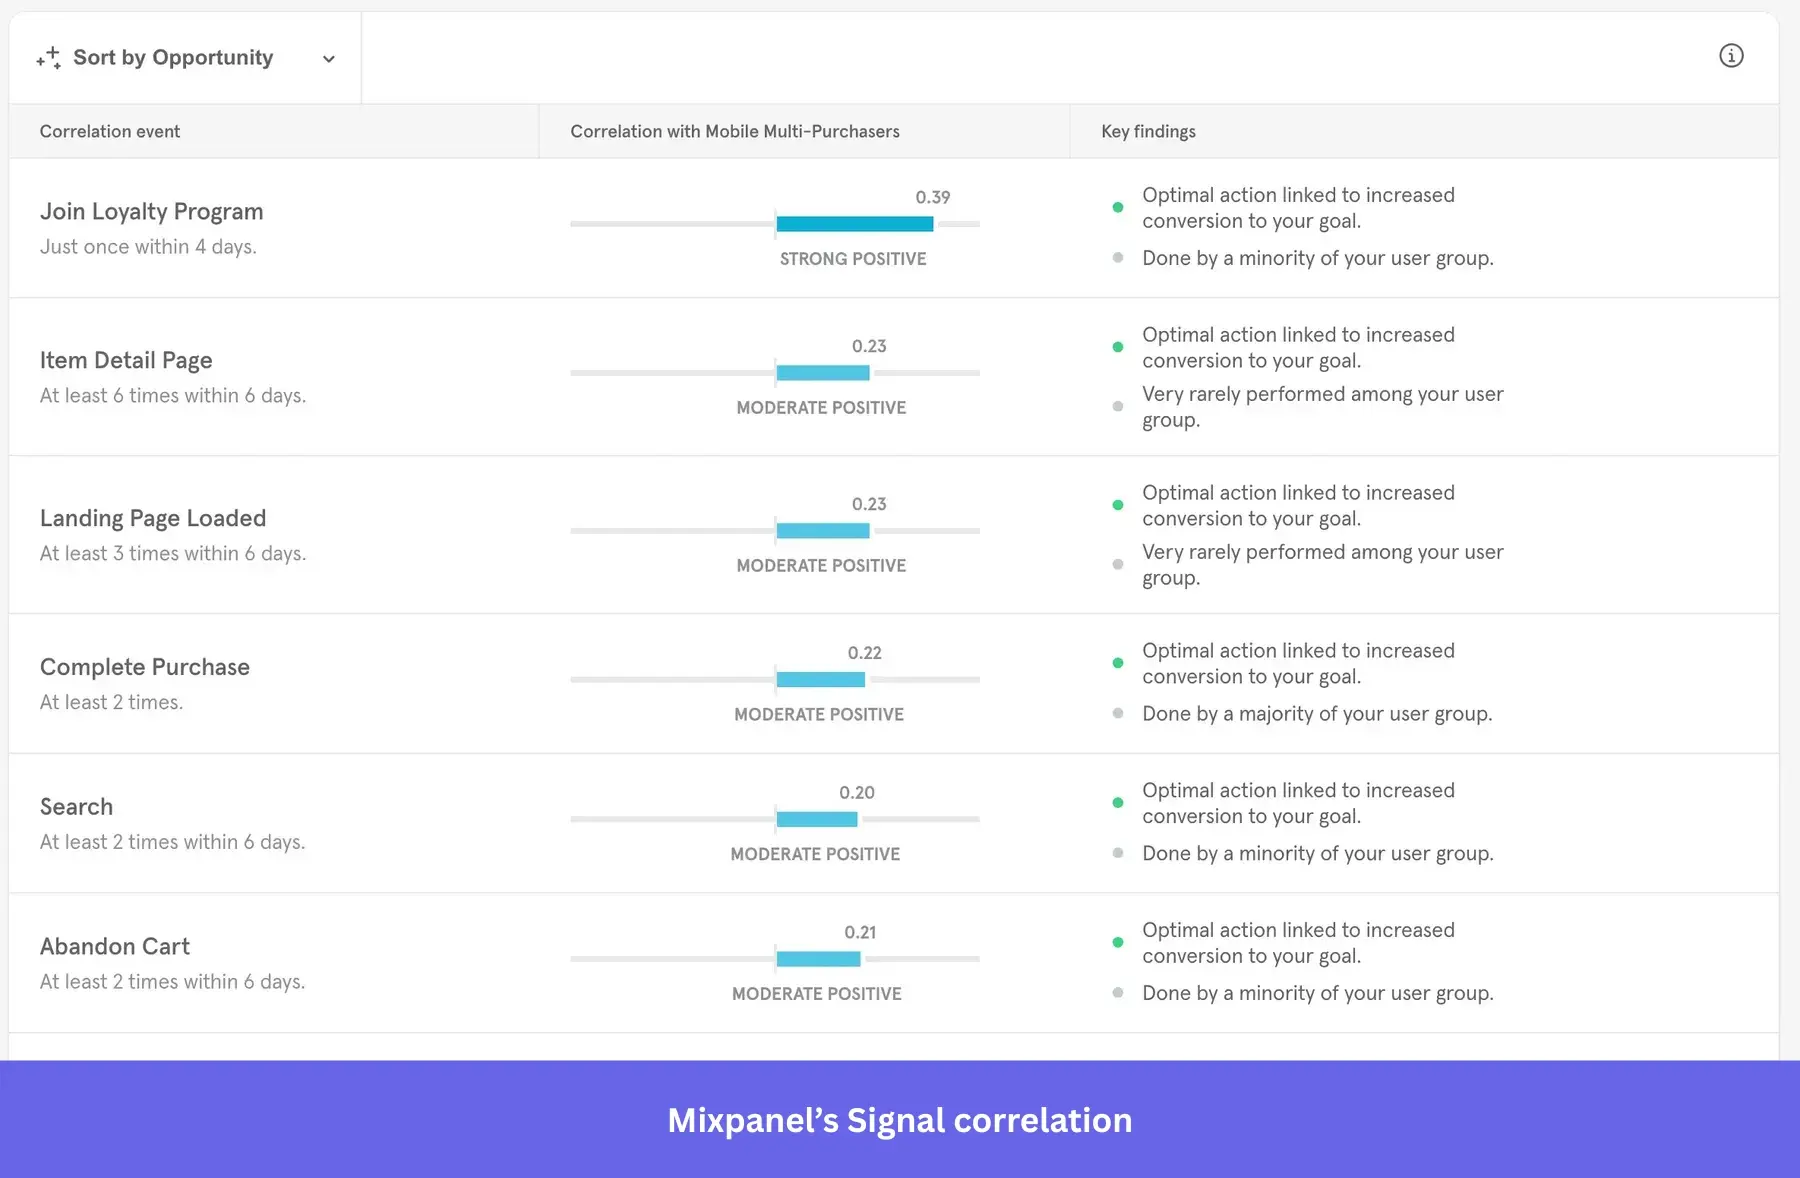
- Signal/correlation discovery: Mixpanel’s Signal report uses the phi coefficient and a proprietary Opportunity Score to automatically discover which user behaviors drive retention and conversion. PostHog has no equivalent automated correlation tool, meaning you must manually hypothesize and test.
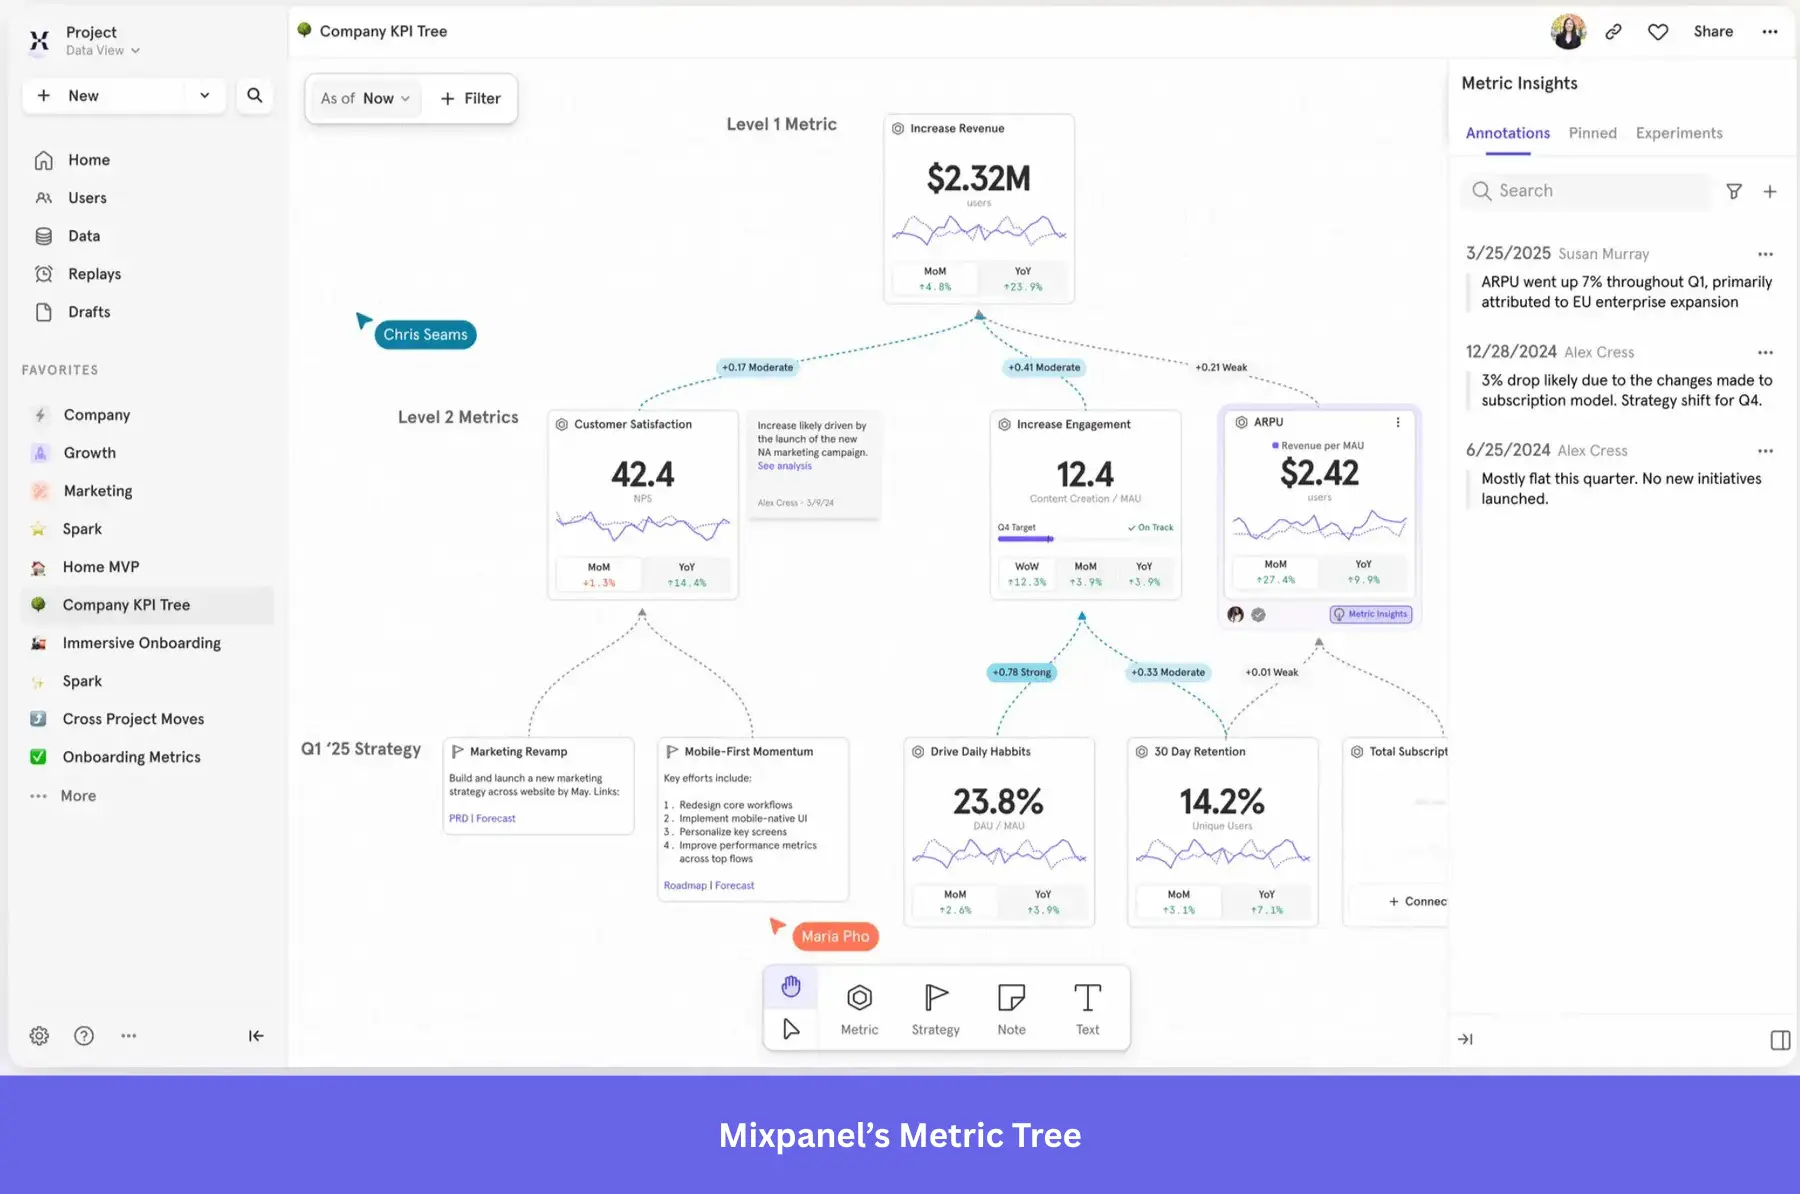
- Metric Trees: Mixpanel’s unique Metric Trees provide a visual hierarchy connecting north-star KPIs to team-level metrics with correlation analysis. Teams can trace from experiment → metric impact → business outcome in one platform. PostHog has no strategic alignment or metrics hierarchy feature.
- Enterprise data governance via Lexicon: Mixpanel’s Lexicon provides event naming standards for your whole organization (including property descriptions, formulas, and sensitive data classification). PostHog’s more open, developer-driven approach can lead to data quality issues in big corporations.
- More accessible UI for non-technical teams: Mixpanel drag-and-drop reporting, Boards (dashboards), and no-code query builder let PMs and marketers self-serve reports. PostHog requires more technical proficiency since it’s designed for engineers, even for HogQL/SQL access.
Mixpanel pros and cons
| Pros | Cons |
| ✅ Friendlier for product teams: Once Mixpanel is properly set up, it becomes intuitive to create custom charts and analyze behavioral data without touching any code. | ❌ Still requires technical skills: Setting up and configuring Mixpanel still requires Dev help, especially for ensuring a clean taxonomy for tracking custom events. |
| ✅ Granular analytics: Besides being more user-friendly than PostHog, it’s also more advanced. With tools that correlate behaviors with conversion/retention. | ❌ Scaling gets expensive: The event-based pricing means it will become expensive for any high-traffic product. Making it better for B2B businesses with lower volumes but higher ARPU. |
| ✅ Generous free plan: Similar to PostHog, Mixpanel’s free plan is enough for smaller businesses with simpler needs (but without having to track the usage of each feature separately). | ❌ Standout features locked behind Enterprise plan: Signal, Experiments, and Feature Flags are Enterprise-only, which reduces accessibility and drives up costs. |
3. Userpilot: No-code product analytics with in-app engagement layers
Userpilot is a comprehensive suite for product growth. With its intuitive product analytics features, it’s not just a platform for tracking numbers but also a space where analytics, in-app guidance, and feedback come together.
Userpilot lets you track behavior, analyze trends, and instantly act on those insights through modals, tooltips, and other in-app elements. It’s built so that literally anyone on your team (with or without technical expertise) can find insights, launch user surveys, or design contextual experiences.
Userpilot vs PostHog side-by-side comparison
| Features | Userpilot | PostHog |
|---|---|---|
| Product analytics | ✔ | ✔ |
| Autocapture | ✔ | ✔ |
| Session replay | ✔ | ✔ |
| Core charts (funnels, trends, paths, retention cohorts) | ✔ | ✔ |
| User/Company profiles | ✔ With sessions, top events, survey answers, and sentiment data. | ✖ |
| Feature flags | ✖ | ✔ |
| A/B testing | ✔ (Flows only) | ✔ |
| SQL access | ✖ (Data export only) | ✔ |
| Open source | ✖ | ✔ |
| In-app engagement for both web and mobile apps (tooltips, modal, slideout, etc.) | ✔ | ✖ |
Why it’s a good PostHog alternative:
- It closes the insight-to-action loop: When Userpilot analytics identifies a funnel drop-off, you can immediately create a contextual tooltip, modal, or walkthrough to address it within the same platform. PostHog has zero in-app guidance capabilities (no product tours, tooltips, or onboarding flows), so you must pair it with multiple tools, which creates a risk for data silos.
👉 Take Amplemarket’s story as an example. Their product team replaced PostHog with Userpilot to bring together analytics, feedback, and engagement in one place. Within weeks, they had:
- Boosted feature adoption by 5–10x using in-app tooltips and guides.
- Cut event setup time from 2 weeks to 5 minutes with no-code tracking.
- Used session replays and feedback surveys to spot friction instantly.
- It reduces engineering dependency: Userpilot’s Chrome extension lets product, UX, and marketing teams build flows, tag features, create surveys, and analyze data without writing code. PostHog requires engineering for setup, event instrumentation, SQL queries, and dashboard configuration.
- Predictable MAU-based pricing instead of usage-based: Userpilot charges per MAU (Monthly Active Users) with fixed plan pricing. PostHog charges separately per event, per session recording, per feature flag evaluation, and per survey response. Making it extremely complex to calculate and predict.
- Growth Agent Lia: Userpilot offers an AI Agent that analyzes product data (surveys, session replays), detects anomalies and drop-offs, clusters feedback, and automatically creates in-app messages/tours/surveys to address identified issues. While Posthog AI only focuses on summarizing and creating visuals with AI. If you’d like to try it out before everyone else, you can join the beta waitlist here.
Userpilot pros and cons
| Pros | Cons |
| ✅ Deep native analytics: Like PostHog, Userpilot includes advanced behavioral reports, autocapture, and session replays for complete friction diagnosis (plus the engagement features). | ❌ Steep learning curve: Fully adopting Userpilot requires a lot of time to learn due to its comprehensive feature set, especially for advanced processes. |
| ✅ Fully no-code: All features, including the in-app flows and advanced analytics reports, can be used without writing code or spending dev time. | ❌ No free plan: Unlike Posthog, there’s no free tier in Userpilot. Making it less accessible for smaller businesses. |
| ✅ All-in-one platform: It provides one platform for product analytics, user engagement, and customer feedback, preventing data silos. |
4. Heap: Retroactive analytics via autocapture
Heap carved out its niche by offering automatic data capture, removing the need for extensive upfront instrumentation. It’s one of the favorite PostHog alternatives for teams focused on user experience and rapid iteration.
Heap’s main advantage often lies in its fully retroactive data capture and visual tagging, simplifying the initial setup.
And while I know autocapture isn’t unique anymore (PostHog and others have caught up), Heap has been perfecting it since 2013! Its ability to collect and analyze historical user data without setup delays still makes it one of the most reliable analytics tools for catching missed insights.
Heap vs PostHog side-by-side comparison
| Features | Heap | PostHog |
|---|---|---|
| Product analytics | ✔ | ✔ |
| Effort/Friction scoring | ✔ | ✖ |
| SQL queries | ✖ | ✔ |
| Heatmaps ↔ Replay workflow | ✔ Heatmaps with a direct “watch matching session replays” link from results. | ✖ |
| Correlation/ drivers in funnels | ✖ | ✔ |
| Autocapture | ✔ | ✔ |
| Open-source | ✔ Contact support for self-hosted installs. | ✔ |
Why it’s a good PostHog alternative:
- Effort analysis provides unique quantitative friction scoring: Unlike PostHog, Heap’s quantitative friction scoring can automatically show which funnel steps require the most user interactions (clicks, form changes, submits), helping you distinguish between low-motivation drop-offs (users not interested) and high-friction drop-offs (product is too hard).
- Point-and-click event definition for PMs: Heap’s Event Visualizer is a visual, no-code interface for defining raw events. Product managers click on page elements to name and track them without SQL or engineering tickets. PostHog’s event definition is more developer-centric, requiring code instrumentation or technical autocapture configuration.
- Access to deeper Contentsquare’s ecosystem: Since the 2023 acquisition, Heap lets you access the broader Contentsquare platform, including advanced zoning analysis within heatmaps, deeper user feedback tools (interview invitations, user tests, screening questions, etc), and impact quantification, synthetic monitoring, and more. PostHog’s UX analyses are limited to simple session replays or error tracking.
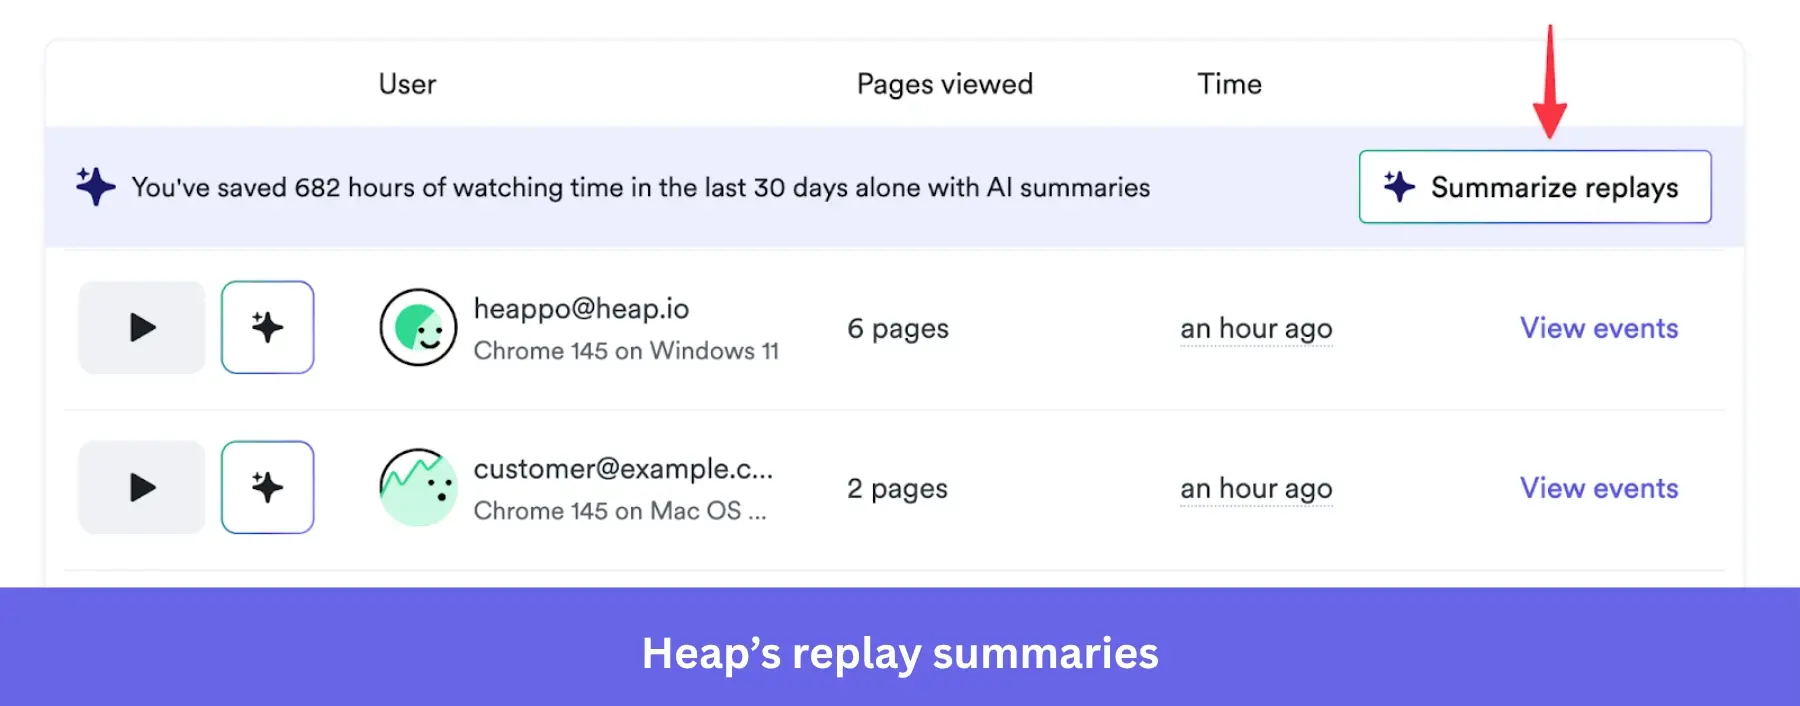
- Heap Illuminate: Heap Illuminate is an AI-powered platform for analyzing user behavior. It automatically creates user segments that correlate with conversion/retention, surfaces the most impactful events between funnel steps, and alerts you about rage clicks for you to fix UX issues. PostHog AI, on the other hand, only focuses on synthesizing data or creating dashboards without a specific direction.
Heap pros and cons
| Pros | Cons |
| ✅ Autocapture eliminates manual setup: You don’t need to consider what you’ll need to measure in the future. You can simply log in and look at past historical data you didn’t explicitly plan to track. | ❌ Expensive price scaling: Autocapture + session-based pricing means it can scale very aggressively depending on your product’s traffic. |
| ✅ Quick setup: It’s easy to set up and get started. It’s also very intuitive for non-technical users. | ❌ Steep learning curve for advanced features: While you can pick it up and start using Heap quickly, some advanced reports are more complex and do require time to learn. |
| ✅ Advanced analytics: With access to Contentsquare’s ecosystem, combining Heap’s autocapture with deep qualitative insights (from sessions and heatmaps) provides all the context you need to analyze user behavior. | ❌ Risk of disorganized data: Heap’s autocapture collects massive volumes of raw data but lacks the capacity to organize it properly (i.e., using detailed filters or removing redundancies). Making it tedious to find and label the data for your analysis. |
5. LogRocket: Developer-focused analytics and performance monitoring
LogRocket, established in 2016, offers session replay and front-end monitoring with a strong developer slant. It helps software teams debug user issues by combining replays with error tracking and performance monitoring.
You can view network requests, console logs, errors, and user interactions within the context of a session replay. This makes LogRocket a better fit for engineering-heavy teams or small businesses that rely on quick debugging and reliable dedicated support.
LogRocket vs PostHog side-by-side comparison
| Features | LogRocket | PostHog |
|---|---|---|
| CPU & memory monitoring | ✔ Built-in CPU & memory usage tracking to diagnose spikes/leaks. | ✖ |
| Autocaptured performance + logs | ✔ | ✔ |
| UX frustration signals | ✔ First-class Issues: rage clicks, dead clicks, network errors, etc. | ✔ Rage clicks only. |
| Clickmaps and Heatmaps | ✔ | ✔ Heatmaps only. |
| Product analytics and core charts | ✔ | ✔ |
Why it’s a good PostHog alternative:
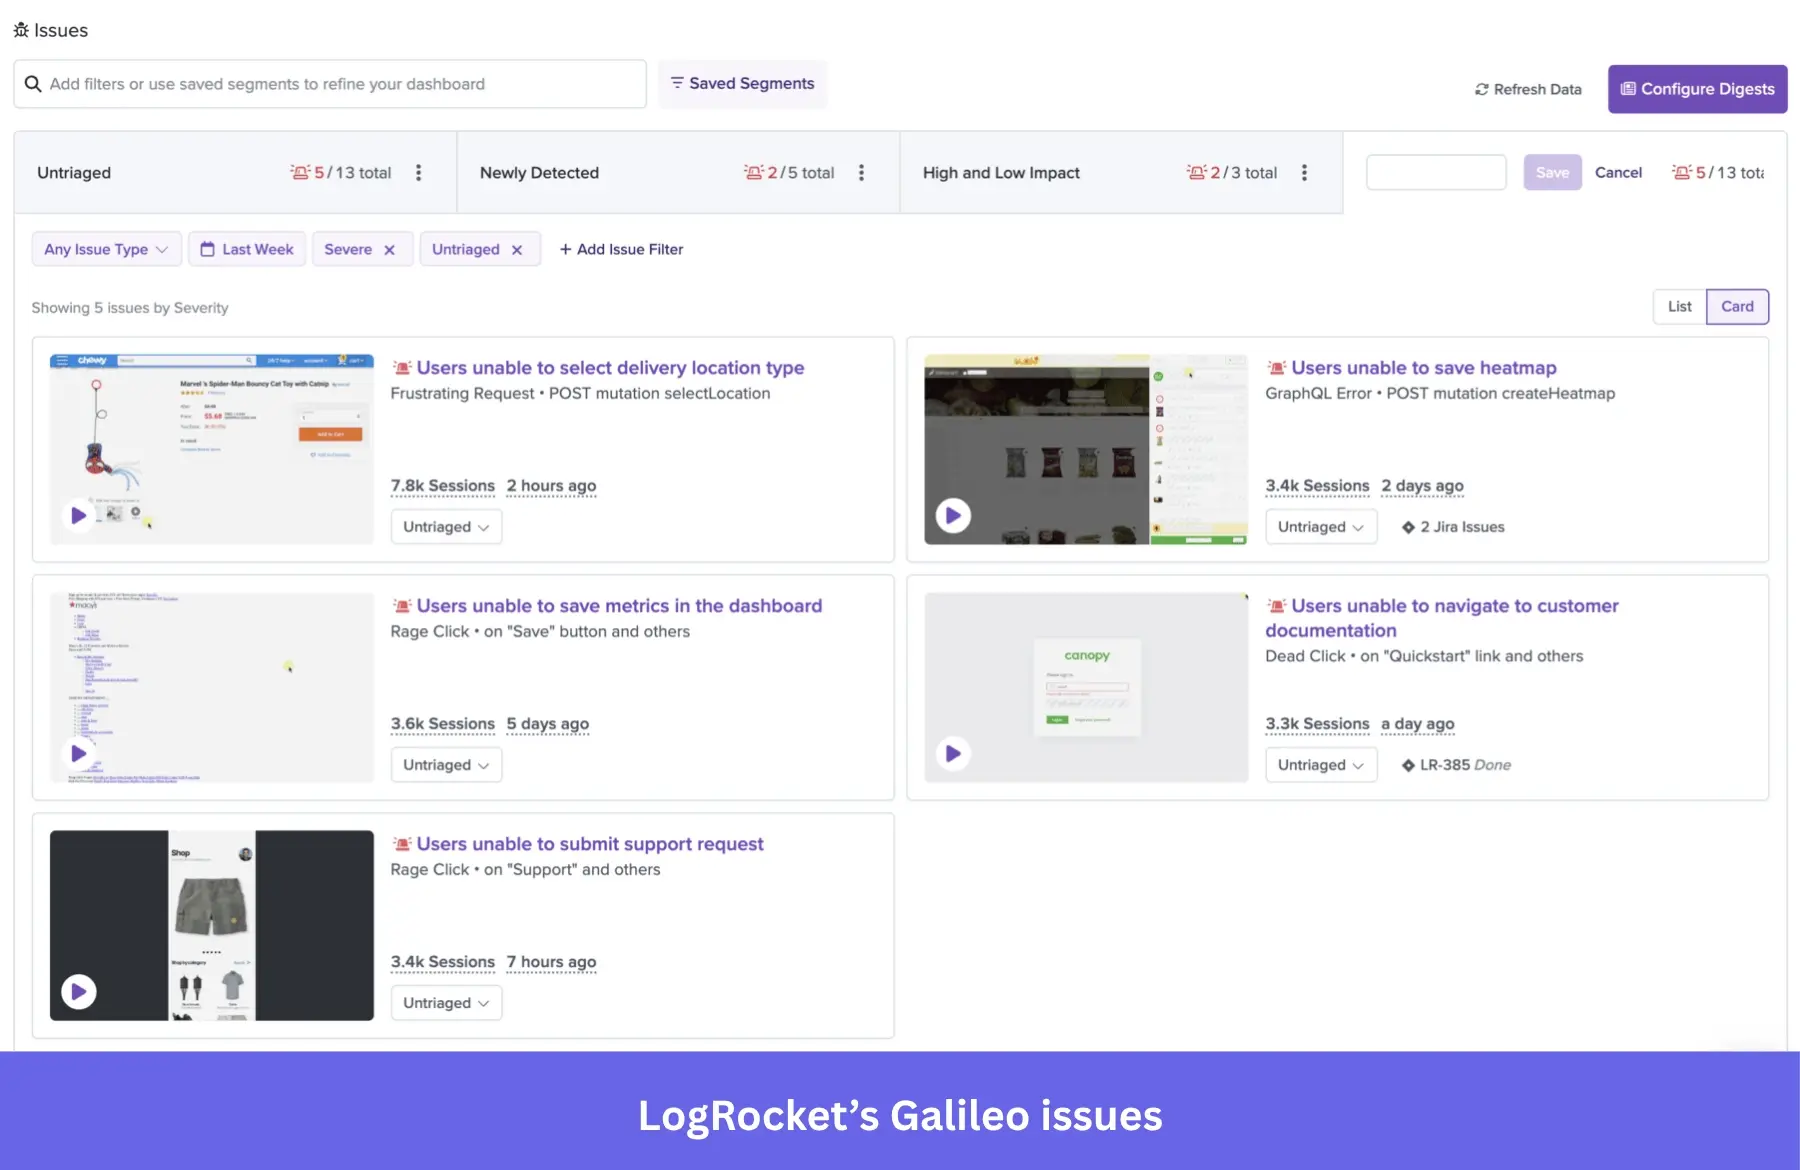
- Purpose-built for error monitoring: Every JS error, network error, and exception is linked to a pixel-perfect session replay with full DOM reconstruction, console logs, and stack traces. LogRocket’s Galileo AI proactively surfaces high-impact issues with severity scoring. PostHog only has error tracking, no source maps, issue triaging, or AI tracking.
- Client-side performance monitoring: LogRocket monitors browser-level CPU usage, memory consumption, browser crashes, long tasks, and network speed within sessions. PostHog does not track CPU, memory, or network performance. This is critical for debugging memory leaks, performance regressions, and slow rendering on low-end devices.
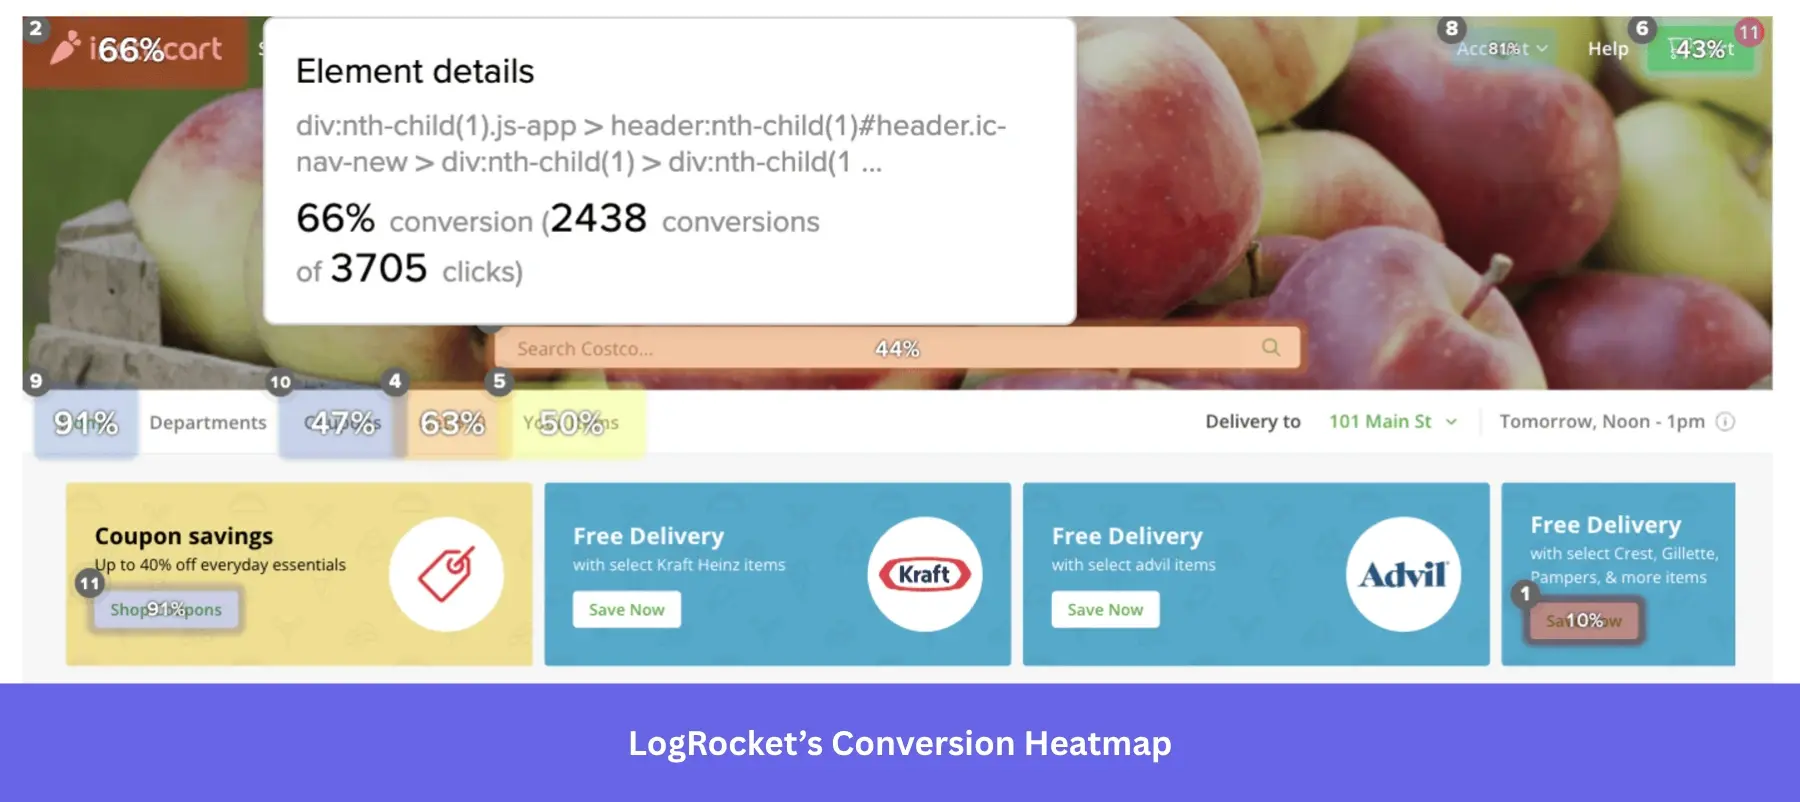
- Conversion rate heatmaps: LogRocket offers a unique heatmap type that correlates clicks with goal achievement, showing which elements drive conversions. PostHog’s heatmaps show click density and scroll depth, but don’t connect to conversion rates.
- AI-powered issue discovery: LogRocket’s Galileo AI automatically categorizes issues by severity score, generates descriptions, and spotlights high-impact frustration patterns. You can ask PostHog AI to find UX issues in session replays, but nothing deeper.
LogRocket’s pros and cons
| Pros | Cons |
| ✅ Session replay for debugging: It shows all the technical parameters behind a session (i.e., console logs, memory usage, network speed, etc), saving a lot of time during debugging. | ❌ Pricing scales quickly: It gets expensive for products with high traffic or as you scale your business. |
| ✅ Intuitive UI: It can filter sessions based on specific events or user properties. It also lets you skip inactivity or slow down the playback. | ❌ Replay quality issues: Session replays can be slow to load or laggy. So much so, fonts and styles aren’t always captured. |
| ❌ Filters not retroactive: Advanced filters like log message and invisible elements are not retroactive. It doesn’t scan existing historical sessions. |
6. FullStory: Digital experience intelligence insights
FullStory less of a traditional product analytics tool and more of a digital experience tool, primarily through powerful session replay and heatmaps. It’s often used by UX researchers and customer support teams to troubleshoot issues and understand user journeys.
FullStory vs PostHog side-by-side comparison
| Features | FullStory | PostHog |
|---|---|---|
| Product analytics with core charts | ✔ | ✔ |
| Autocapture | ✔ | ✔ |
| Frustration signals as first-class objects | ✔ Built-in Rage/Dead/Error Clicks + Thrashed Cursor; Frustrated Sessions default segment. | ✔ Rage clicks only. |
| Heatmaps | ✔ | ✔ |
| Mobile heatmaps and conversion maps | ✔ | ✖ |
| SQL query | ✖ | ✔ |
Why it’s a good PostHog alternative:
- Proprietary frustration detection: FullStory’s five frustration signals (Rage Clicks, Dead Clicks, Error Clicks, Thrashed Cursor, Frustrated Sessions) automatically surface pain points without manual setup. PostHog tracks rage clicks only. Plus, FullStory’s Ragehooks can trigger real-time actions (e.g., launch live chat) when users exhibit frustration during checkout.
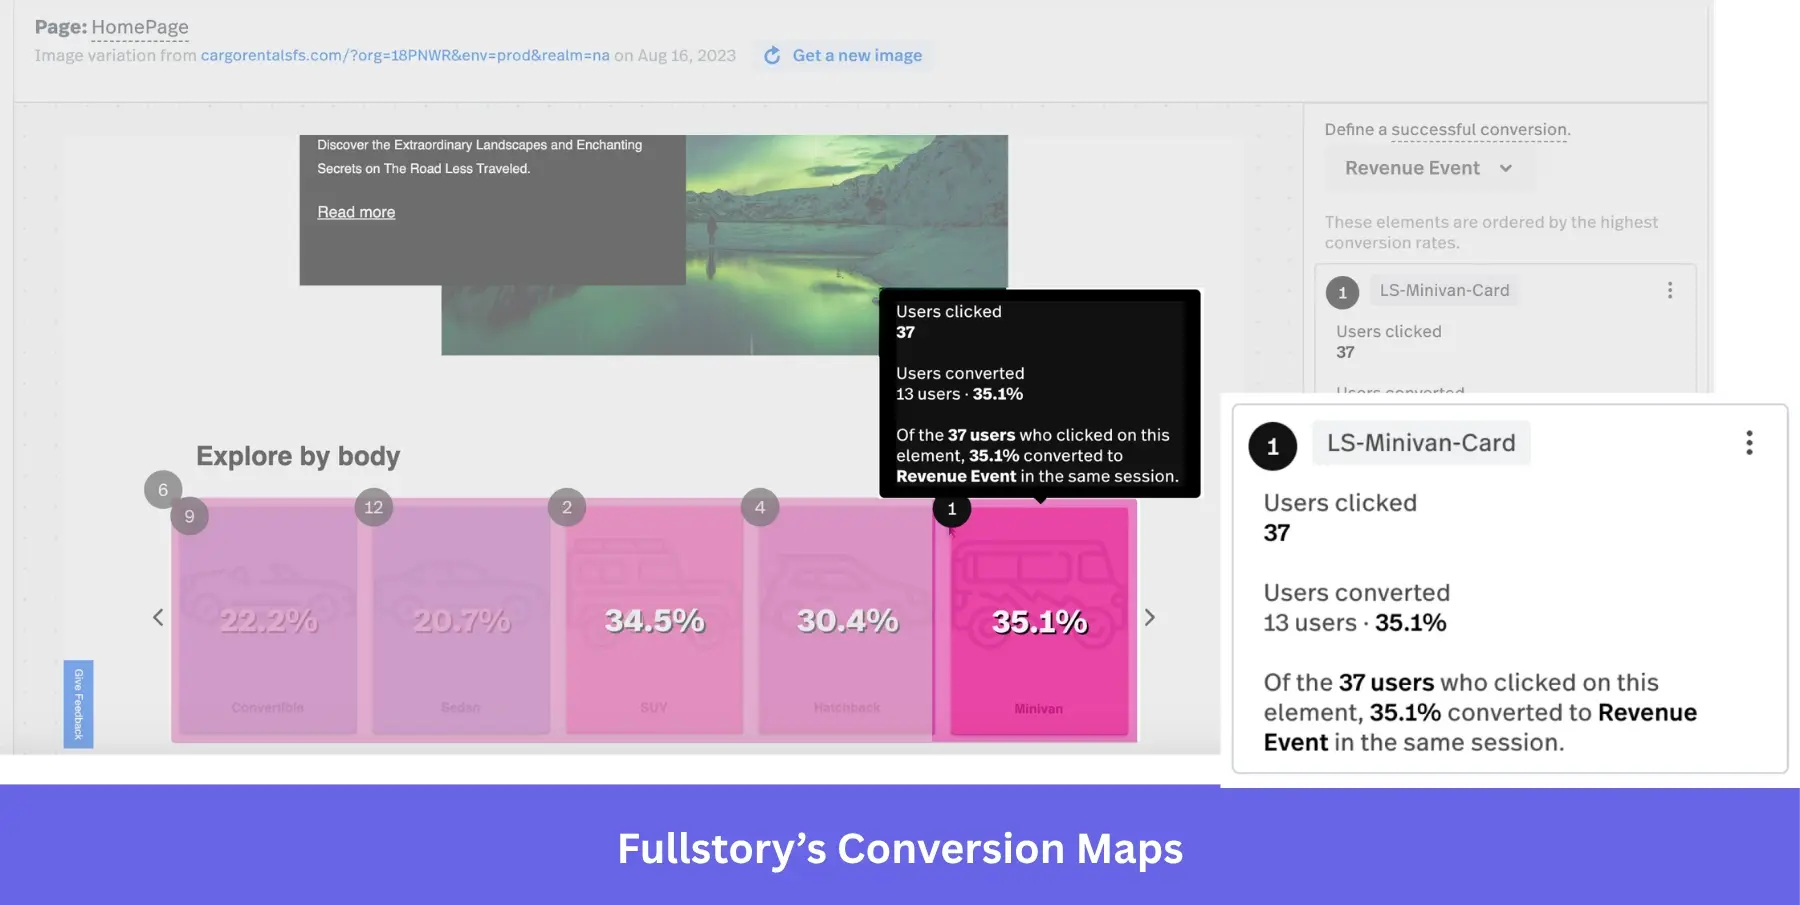
- Conversion maps: FullStory’s conversion maps show which page elements correlate with conversions (e.g., “Do shoppers who interact with the Reviews section convert higher?”). PostHog has no equivalent element-level conversion analysis.
- Mobile-specific heatmaps and analytics: FullStory offers mobile heatmaps (click maps + conversion maps for iOS/Android), mobile session replay, and mobile frustration detection. PostHog has mobile replay but lacks mobile-specific heatmaps and the depth of mobile DX analytics.
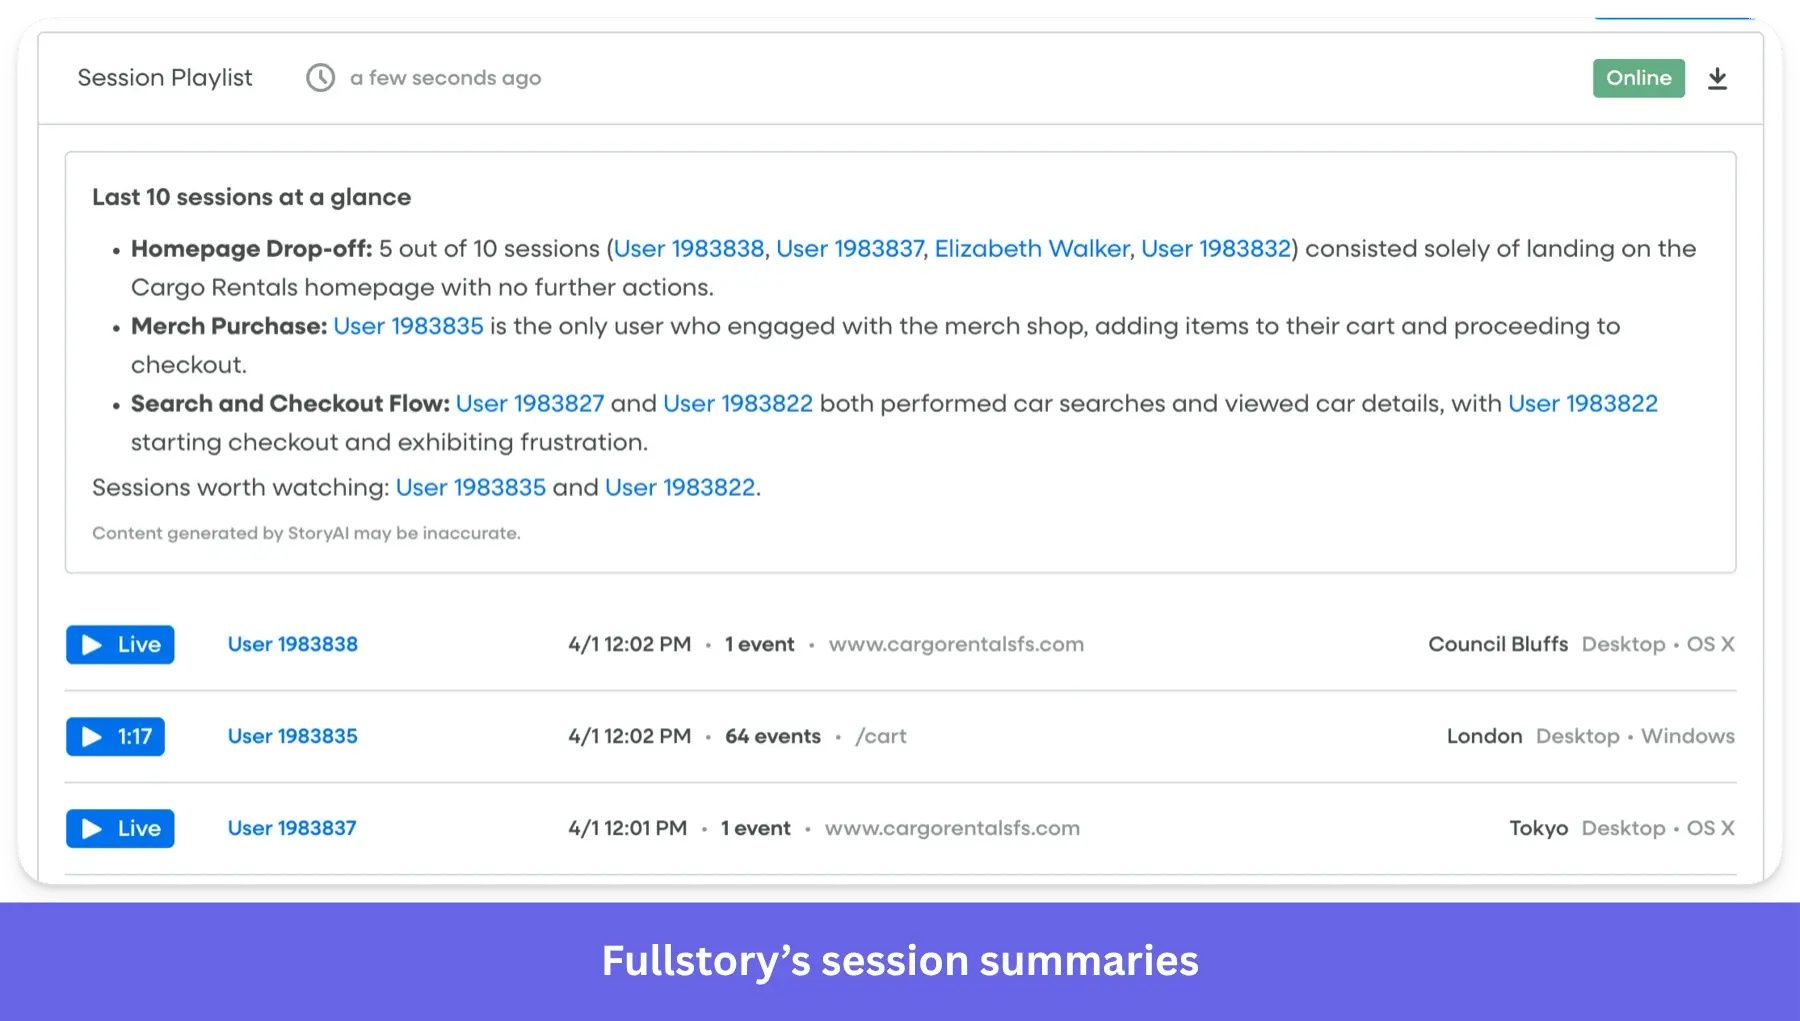
- Session replay for non-technical stakeholders: FullStory’s replay is designed for sharing across teams (UX designers, customer success, and executives). With shareable session links, StoryAI summaries, and the intuitive UI that makes it accessible to other users. PostHog’s replays are more developer-focused with console logs and a DOM explorer.
Fullstory pros and cons
| Pros | Cons |
| ✅ Session replay quality: Fullstory’s pixel-perfect replays show the exact interactions without missing any detail. They’re also very easy to filter and manage. | ❌ Steep learning curve: There’s a significant learning curve due to its comprehensive features. |
| ✅ Intuitive UI: Even those without technical expertise can quickly understand user behavior. | ❌ Expensive at scale: It can get prohibitively expensive when tracking all sessions. Especially for smaller teams. |
| ✅ Complete qualitative analysis: With AI-powered heatmaps and session replay tools, you can completely understand why users behave a certain way. | ❌ Limited shareability and customization: The reports are not very customizable, and you can only share them by exporting them as PDFs. |
7. Plausible: GDPR-compliant insights for website analytics
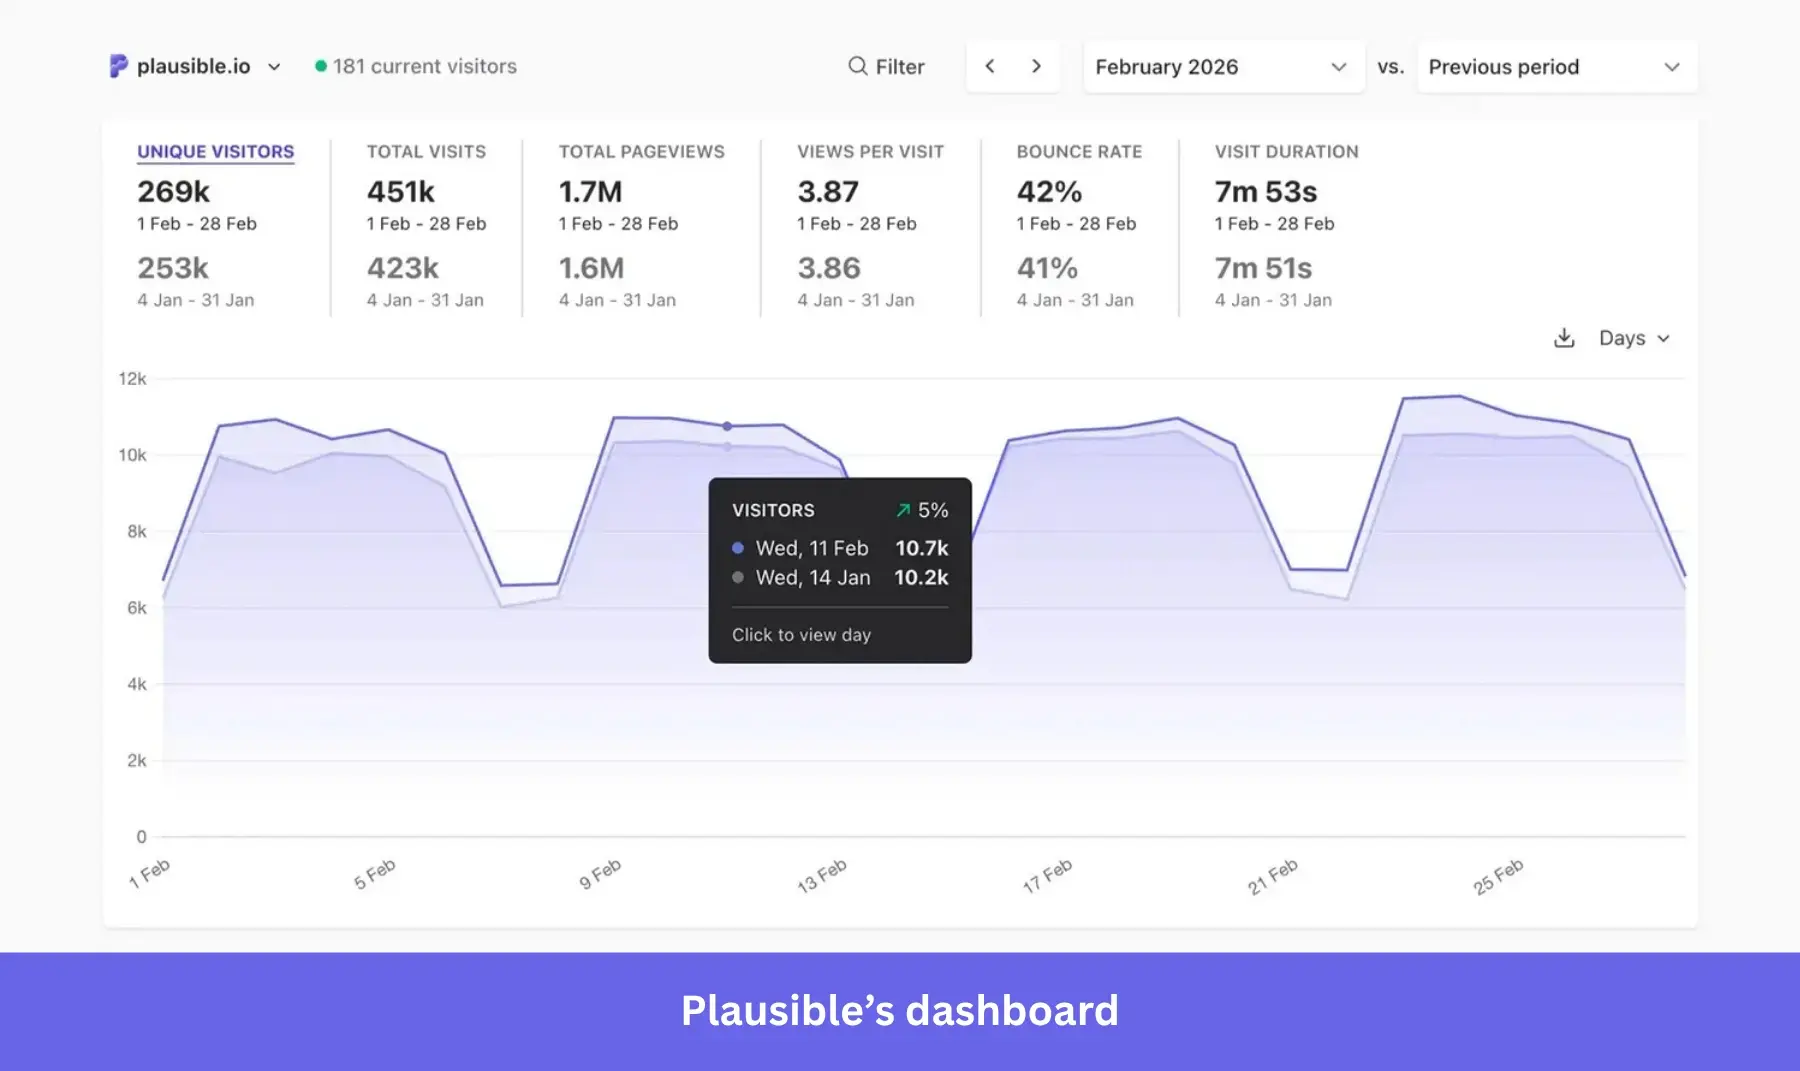
Plausible Analytics is a lightweight, open-source web analytics tool focused on providing GDPR-compliant insights. It’s fast, easy to use, and doesn’t rely on cookies, making it a favorite for privacy-conscious website owners.
Plausible vs PostHog side-by-side comparison
| Features | Plausible | PostHog |
|---|---|---|
| Web analytics dashboard | ✔ | ✔ |
| Goals/ conversions | ✔ | ✔ |
| UTM/campaign attribution | ✔ | ✔ |
| Self-hosting option | ✔ | ✔ |
| Privacy model | ✔ Cookieless by default. | ✔ Optional with an explicit configuration. |
| Ultra-light tracking script | ✔ | ✖ |
| Managed first-party proxy to bypass ad blockers | ✔ | ✖ |
| Autocapture | ✖ | ✔ |
| Session replay | ✖ | ✔ |
Why it’s a good PostHog alternative:
- GDPR compliance out of the box: Plausible is cookieless and collects no personal data, meaning sites can eliminate cookie consent banners entirely. PostHog, while offering cookieless options, tracks individual user behavior by default and requires GDPR configuration.
- Sub-1KB script: Plausible’s tracking script is under 1 KB (~45x smaller than GA, dramatically smaller than PostHog’s SDK). This means better Core Web Vitals, faster page loads, and reduced bandwidth. This is a huge advantage for content sites, blogs, and marketing pages where performance directly impacts SEO rankings and user experience.
- Cost-effective for website analytics: Plausible starts at $9/month with all features included on every tier. Pricing only scales on pageviews, and the other plans only add more sites and team management options. PostHog’s free tier is generous, but pricing complexity across multiple meters makes true costs hard to predict.
- Easier self-hosting via Docker: Plausible CE deploys with a single Docker Compose file plus ClickHouse. PostHog’s self-hosting requires ClickHouse, Kafka, PostgreSQL, Redis, and more. In fact, a PostHog doc says, “We’ve literally never seen the self-hosting math work out”, as they heavily incentivize teams to use PostHog cloud.
Plausible’s pros and cons
| Pros | Cons |
| ✅ Fast, accurate, and simple: Plausible is very lightweight, and the setup takes a couple of minutes. It’s also more accurate than Google Analytics. | ❌ Limited depth: It offers fewer analytics options than GA4. |
| ✅ Cookieless user experience: Its privacy-first setup makes it so users don’t have to receive a disruptive cookie notice when visiting your site. | ❌ Paid tool: Although Plausible isn’t expensive, GA4 is free. Therefore, it’s a better choice for simple privacy compliance and a user-friendly interface. |
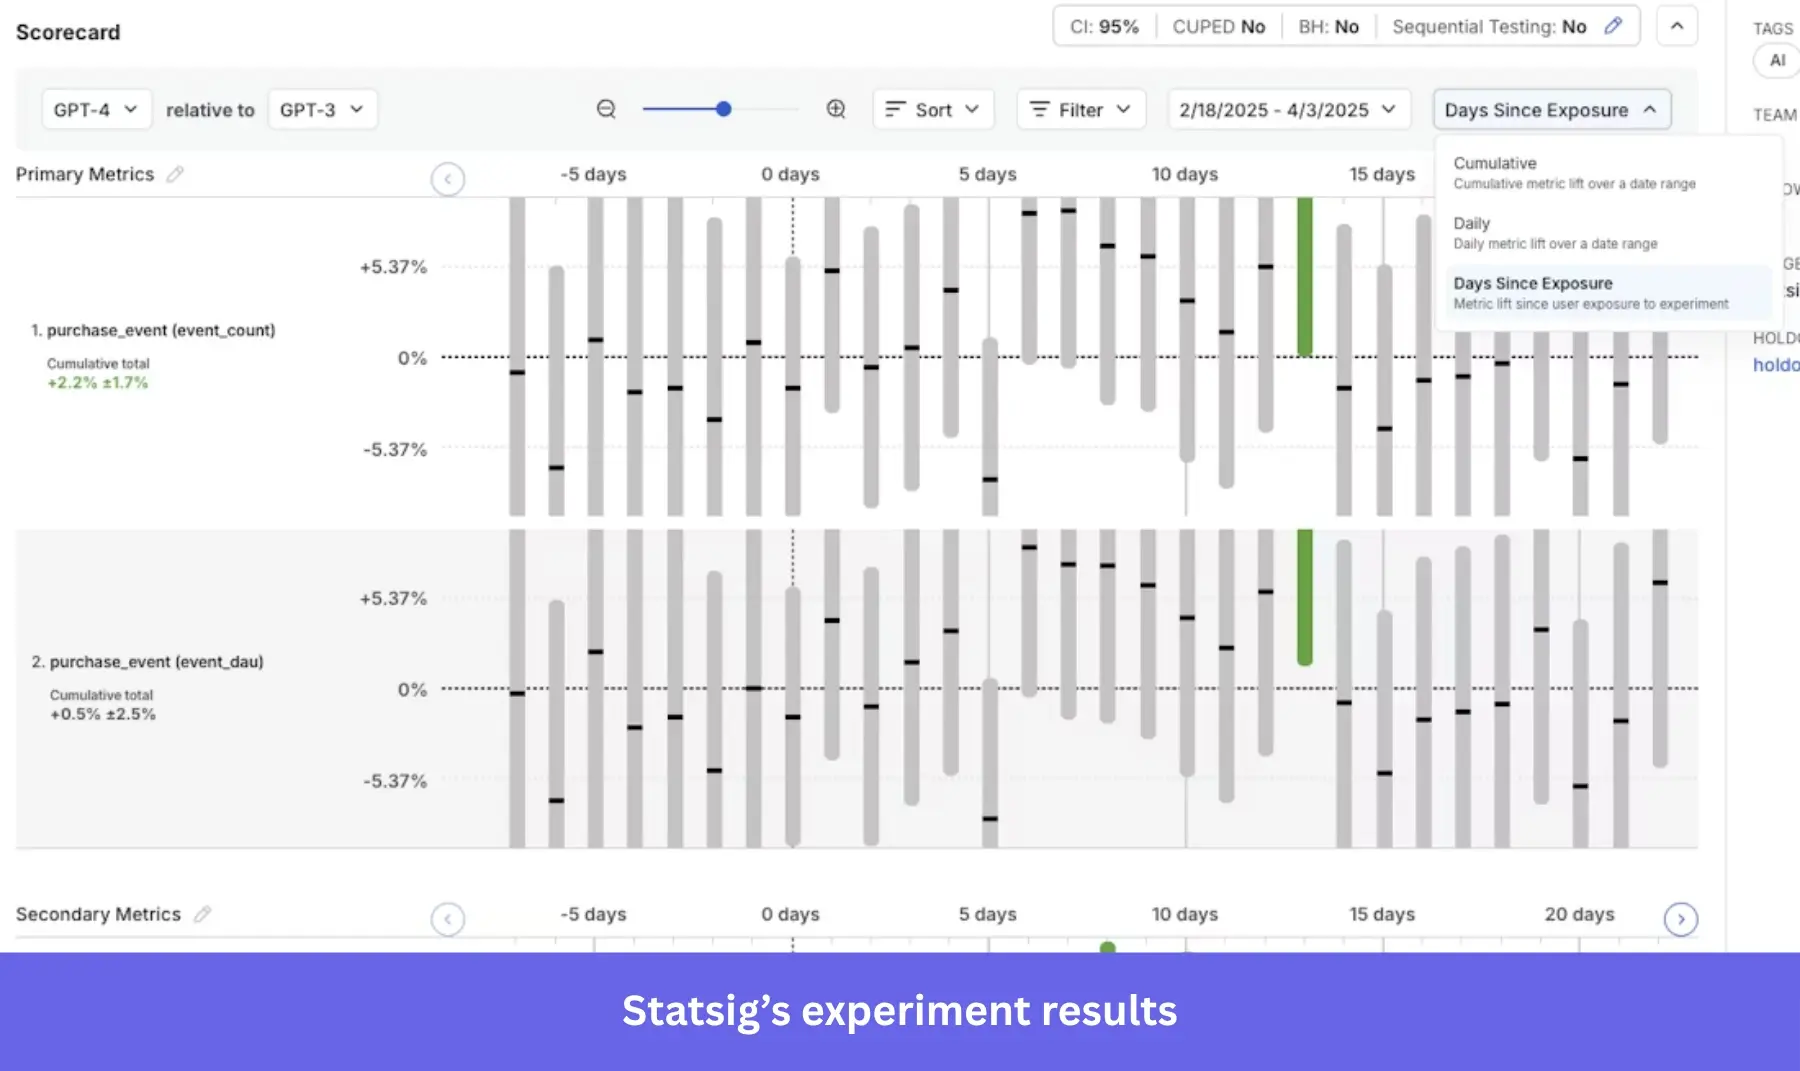
8. Statsig: Feature flags and experimentation at scale
Statsig is a robust platform focused on enterprise-grade feature flags capabilities, A/B testing, and experimentation. It boasts impressive scalability, handling trillions of events daily with a generous free tier and affordable event-based pricing structure.
Statsig vs PostHog side-by-side comparison
| Features | Statsig | PostHog |
|---|---|---|
| Product analytics basics (events, funnels, retention, paths, dashboards) | ✔ | ✔ |
| Session replay | ✔ | ✔ |
| Heatmaps | ✖ | ✔ |
| Feature flags | ✔ | ✔ |
| A/B/n experiments | ✔ | ✔ |
| Warehouse-native experimentation | ✔ Run experiment analysis directly on your data warehouse. | ✖ |
| Sequential testing (anti-peeking) | ✔ | ✖ |
| SRM checks (traffic split health) | ✔ | ✖ |
| Session replay (native) | ✔ | ✔ |
| Heatmaps (native) | ✔ | ✔ |
| SQL query | ✔ | ✔ |
Why it’s a good PostHog alternative:
- Enterprise-grade experimentation with statistical rigor: Statsig includes CUPED (detects 20-30% smaller effects), sequential testing with valid p-values, SRM checks, Bonferroni correction, Winsorization, stratified sampling, interaction detection, and Benjamini-Hochberg procedure as standard features. PostHog offers basic A/B testing without any of these advanced methods.
- Unlimited free feature flags and automatic rollbacks: Statsig provides unlimited flags free forever, no evaluation charges at any tier. PostHog charges $0.0001/request after 1M free monthly requests. For a high-traffic app with 100M flag evaluations/month, PostHog would charge ~$990 just for flags, while Statsig would charge $0. Statsig’s flags also include automatic rollbacks when guardrail metrics breach a threshold, while PostHog requires manually converting flags to experiments.
- Mutual exclusion layers: Statsig supports mutual exclusion layers, holdout experiments, experiment templates, meta-analysis, and interaction detection. This lets you run many concurrent tests without mixing users in the same layer (and messing up the results). PostHog’s holdout testing is harder to use, has no built-in mutual exclusion, no metrics libraries, and limits metric visibility per experiment.
- Simpler, cheaper unified pricing: PostHog charges separately across 7+ product meters (analytics, flags, replays, experiments, in-app surveys, error tracking, data warehouse). Statsig bundles everything under one usage-based model (events + replays).
Statsig pros and cons
| Pros | Cons |
| ✅ Ease of use: Statsig can run experiments quickly and without friction, lowering the barrier to performing tests for anyone in your team. | ❌ Mild learning curve: It might be hard to get into Statsig if you have no experience with experimentation tools or statistical terms. |
| ✅ Practical warehouse integrations: Statsig’s warehouse-native mode lets you run experiments without creating potential data silos. Your source of truth stays in Snowflake/BigQuery. | ❌ Flawed bot traffic detection: Bots might get caught up in the experiments, messing with the final results. |
| ✅ Generous free plan: You get unlimited feature flags for free, and the paid plans are more affordable than other platforms. |
Pick the right PostHog alternative for your use case
Before you commit to a platform, think through how your team actually works.
- Who will use the tool? If your users are non-technical product managers and marketers, avoid heavy engineering tools. Look for platforms that support visual customer segmentation and no-code setups.
- What is your primary goal? If you want to fix bugs, you need advanced session replays. If you want to increase activation rates, you need a tool that combines analytics with in-app messaging.
- What is your budget? Beware of usage-based pricing that charges across five different meters. Look for transparent pricing models.
Here’s how I’d choose some of these tools if I were in different teams:
- If the team is highly technical and I only need general product analytics features for a SaaS, I’d go for PostHog (might turn out more affordable than Amplitude or Mixpanel).
- If I wanted to self-host an analytics tool for a simple product, I’d go for Plausible.
- For complex/enterprise products that require rigorous optimization, I’d choose Amplitude, Mixpanel, or Heap (depending on our technical resources).
- For combining product analytics with no-code in-app engagement for independent product teams, I’d choose Userpilot (plus Statsig for more scientific testing).
So, what product analytics tool will you choose?
Userpilot strives to provide accurate information to help businesses determine the best solution
for their particular needs. Due to the dynamic nature of the industry, the features offered by
Userpilot and others often change over time. The statements made in this article are accurate
to the best of Userpilot’s knowledge as of its publication/most recent update on April 1, 2026.
About the author