Should You Use LogRocket for Session Replay? Detailed Capability Review



You should use LogRocket for session replay if your main goal is helping engineers reproduce frontend issues and understand the technical context behind them. It combines visual recordings with console logs, network requests, errors, performance data, and application state, which makes it especially useful for debugging.
From the SaaS teams I’ve worked with at Userpilot, the limitation usually appears when product managers start using those same recordings to improve onboarding, activation, or feature adoption. LogRocket can show what happened in an individual session, but the wider workflow of finding patterns, segmenting affected users, collecting feedback, and responding inside the product often still requires other tools.
I’ll break down what LogRocket’s session replay includes, how its analysis and debugging features work, and where it makes sense in a SaaS product stack.

How does LogRocket session replay work under the hood?
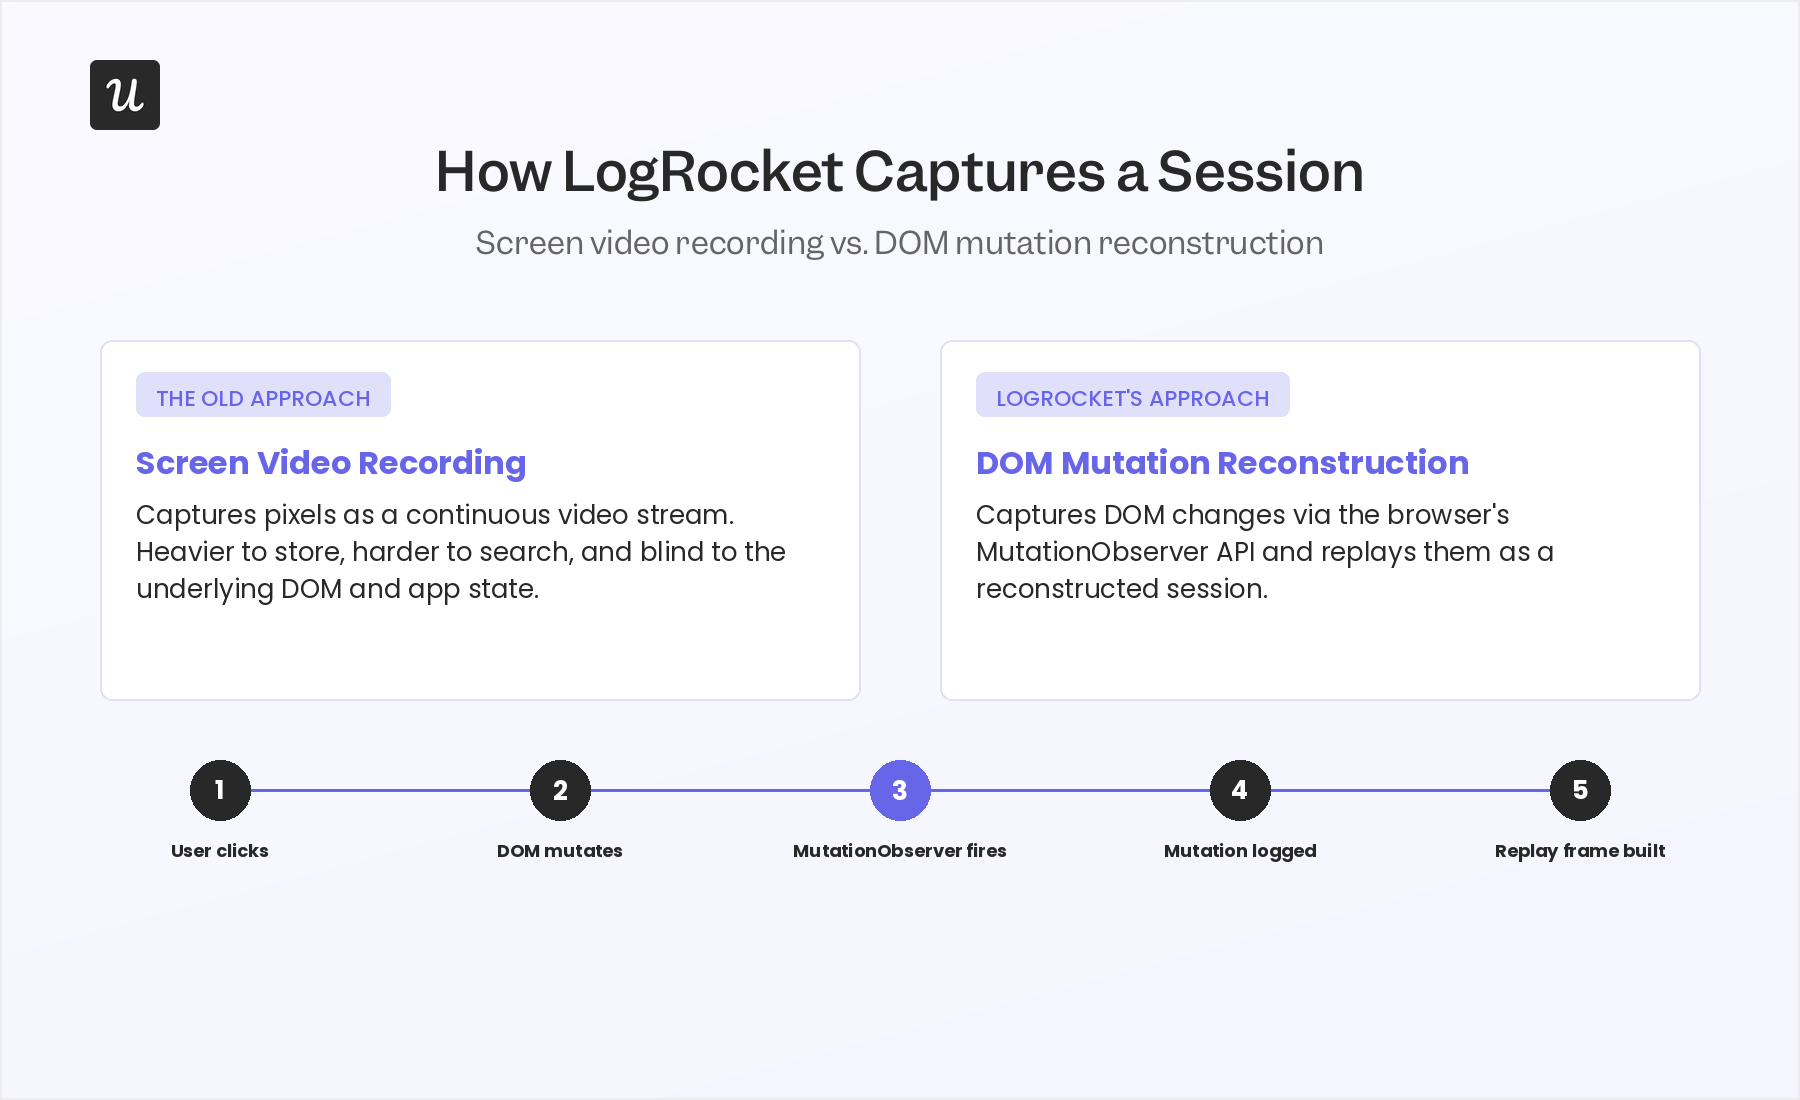
LogRocket reconstructs each user session from DOM mutations and event data instead of recording a video. It then pairs that replay with console logs, network logs, JavaScript errors, performance data, and Redux state on a single timeline.
This combination makes LogRocket especially useful for tracing frontend issues. You are watching what a user clicked and seeing the technical context around what broke, slowed down, or failed to load.
What does the SDK capture, technically?
LogRocket’s SDK uses the browser’s MutationObserver API to capture DOM mutations, then replays them as a reconstructed session rather than as a video file. This approach affects storage cost and what the SDK can and cannot see.
The same SDK instruments XMLHttpRequest and fetch to capture network requests, headers, and status codes, with rules you control that mask sensitive data and can exclude sensitive user data entirely if needed. It also hooks into the browser console, Redux, performance APIs, and exception handlers, including JavaScript exceptions and other backend errors surfaced through integrations. The SDK captures clicks, scrolls, and mouse movements to visualize user activity in web applications, but it doesn’t separately log hovers and form submissions in the session-replay data model.
On the performance side, LogRocket tracks page-load times, CPU and memory usage, and Cumulative Layout Shift, the same kind of signal Google groups under Core Web Vitals, so a slow page and a buggy one show up in the same timeline.
With this capture layer, LogRocket lets you combine multiple filters across user identification, URLs, custom events, and network or performance conditions, with more than 50 filtering options in total. At session volume, that advanced filtering is the difference between scrolling through user sessions one by one and narrowing straight to the handful that match a pattern you are chasing.
What’s a session in LogRocket’s model?
A session is a reproduction of one user’s journey through your app, scoped by LogRocket’s session-definition rules rather than a fixed time window. LogRocket treats multi-tab activity as sub-sessions, each with its own viewport range tied to the parent session.
Inside the replay, you can follow a user across multiple tabs automatically or lock the view to a single tab. That sub-session model is one of LogRocket’s strengths because most session replay tools show you the tab you opened instead of the one the user switched to.
What does the Session Replay view itself give you?
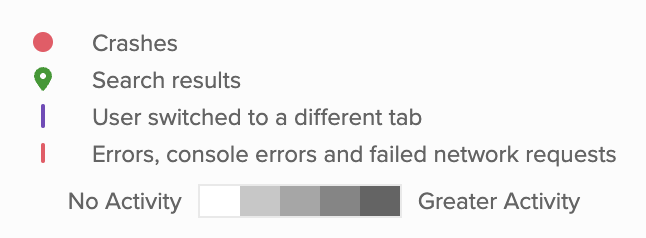
The viewer looks like a video player: a scrubber, play and pause controls, a navigation URL bar, and a tab switcher. Above the scrubber sits a time bar that doubles as an activity heatmap, white for idle stretches and dark gray for active ones, with red lines marking errors and failed requests and purple lines marking tab switches.
A side panel toggles between Session Info and Events. Session Info answers who this user is and what they were running:
- User ID, email, session count, first and last seen, session duration, total time on site, and any custom traits you have set.
- Device, browser, IP, referrer, SDK version, and release.
Events gives you a filterable, multi-select timeline built from custom events and built-in ones, supporting event-based analytics as you trace user actions and user journey step by step. Click any event to jump straight to that moment, or open View Similar Sessions to see whether the same pattern shows up elsewhere in your user funnels.
What are the features layered on top of raw replay?
On top of the visual replay, LogRocket adds heatmaps and scrollmaps, performance monitoring, network and console logs, Redux state tracking, a filterable event timeline, DOM inspection, and issue signals for errors and user frustration.
Galileo AI to reduce time to insight
Galileo is LogRocket’s AI layer, and it shows up in three places:
- Galileo Highlights automatically summarizes sessions so you don’t have to watch every one end-to-end, and it can review up to 10 sessions by a single user at a time, surfacing patterns of user frustration without manual review.
- Ask Galileo lets you query session data in natural language to understand user behavior analytics at a glance, with a default of 100 sessions per query unless you broaden the scope.
- Galileo Funnel Insights goes a step further with funnel analysis, explaining the reasons behind a drop-off point beyond its location.
Bundled developer-debugging features
LogRocket stitches network requests, console output, Redux state, and JS exception tracking into the same timeline as the replay, which is the feature engineers pay for. On top of that timeline:
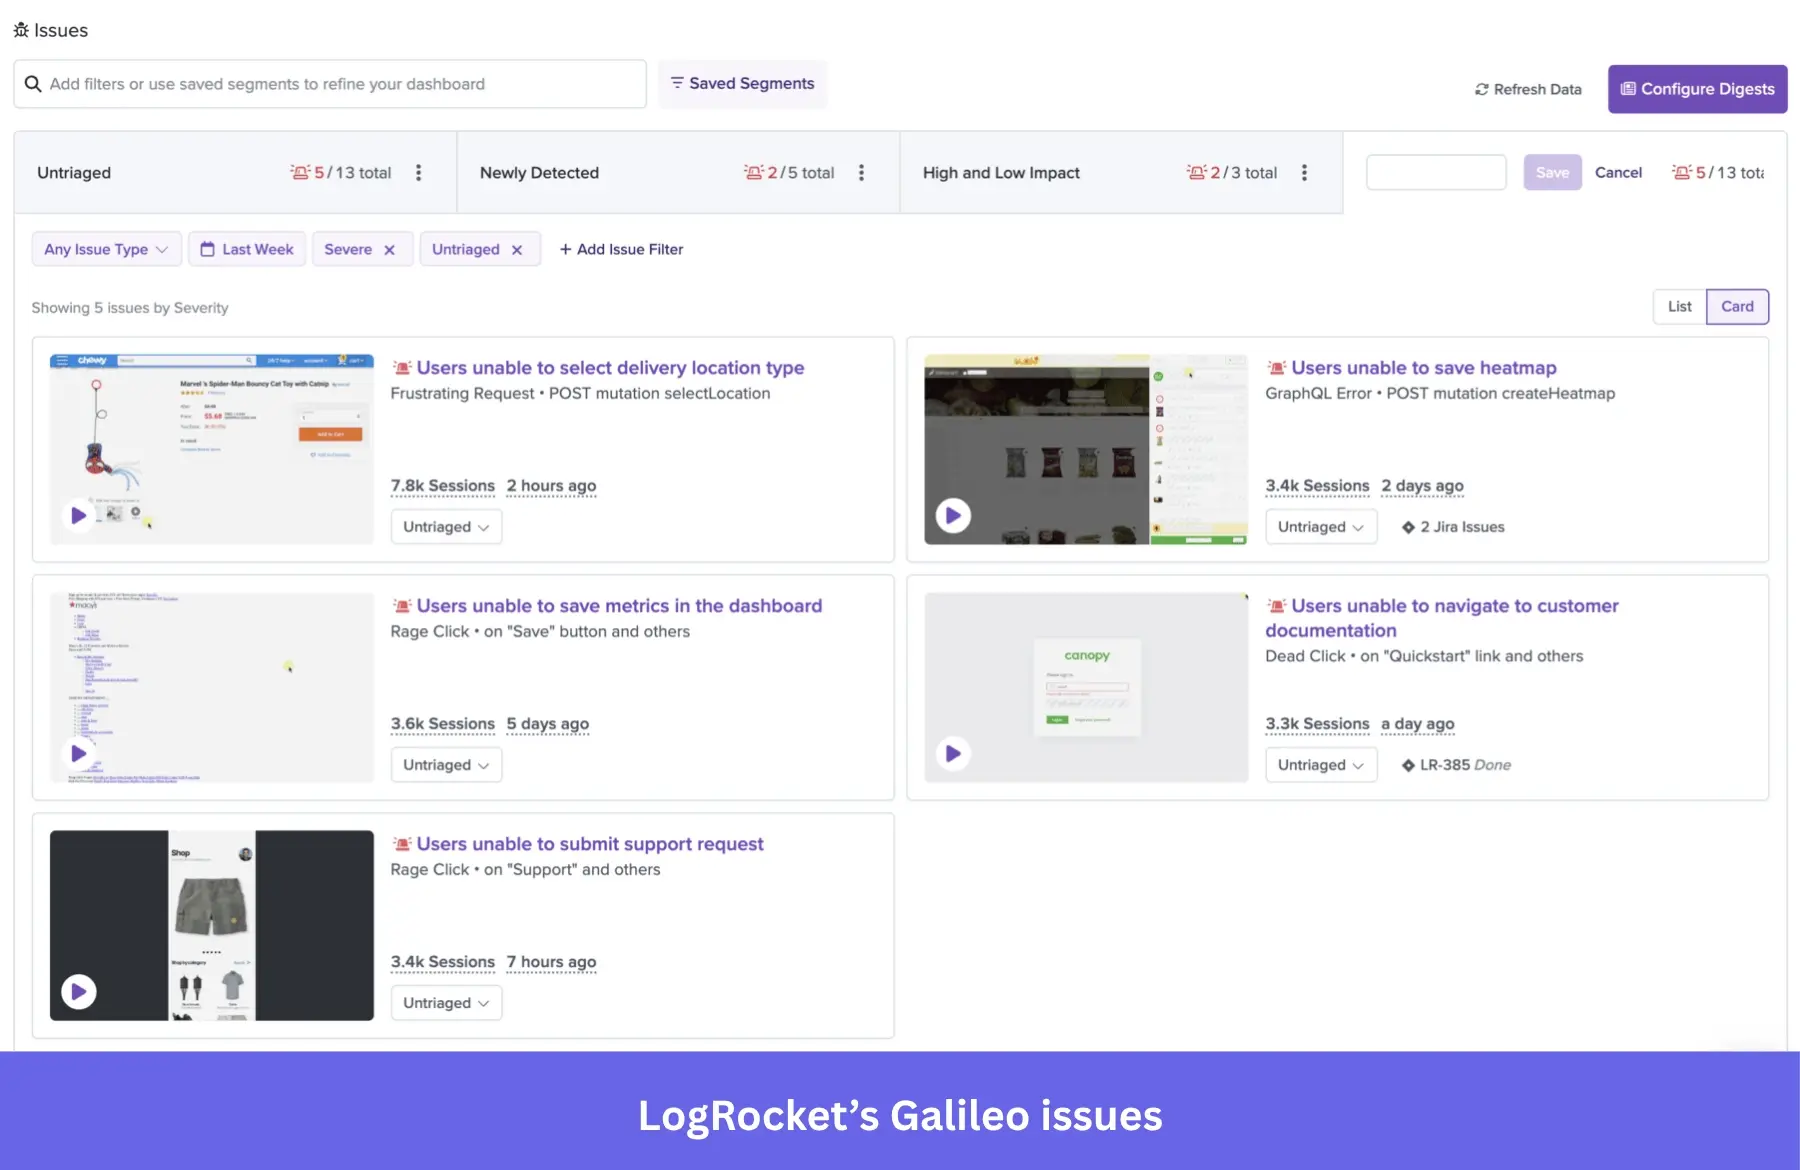
- The Issues view adds Severe Issues, Dead Clicks, and Issues Alerts, plus a newer Issue Analyzer in beta that uses Galileo to study patterns across related sessions and suggest a root cause.
- LogRocket supports source maps and integrates with Sentry, Bugsnag, and Rollbar, so error data doesn’t live in two disconnected tools.
- Datadog integration traces frontend performance data through to backend errors, instead of leaving engineering teams to guess where a slow request broke.
For teams already living in an AI coding agent, LogRocket’s MCP server pipes reproduction steps straight into tools like Cursor or Claude Code, instead of someone pasting a session link into a ticket. The Jira and GitHub integrations let you create a tracked issue straight from a session, and a Streaming Data Export add-on pushes the same data into Snowflake, BigQuery, or a handful of other warehouses if you want it outside LogRocket entirely.
What product analytics features sit alongside replay?
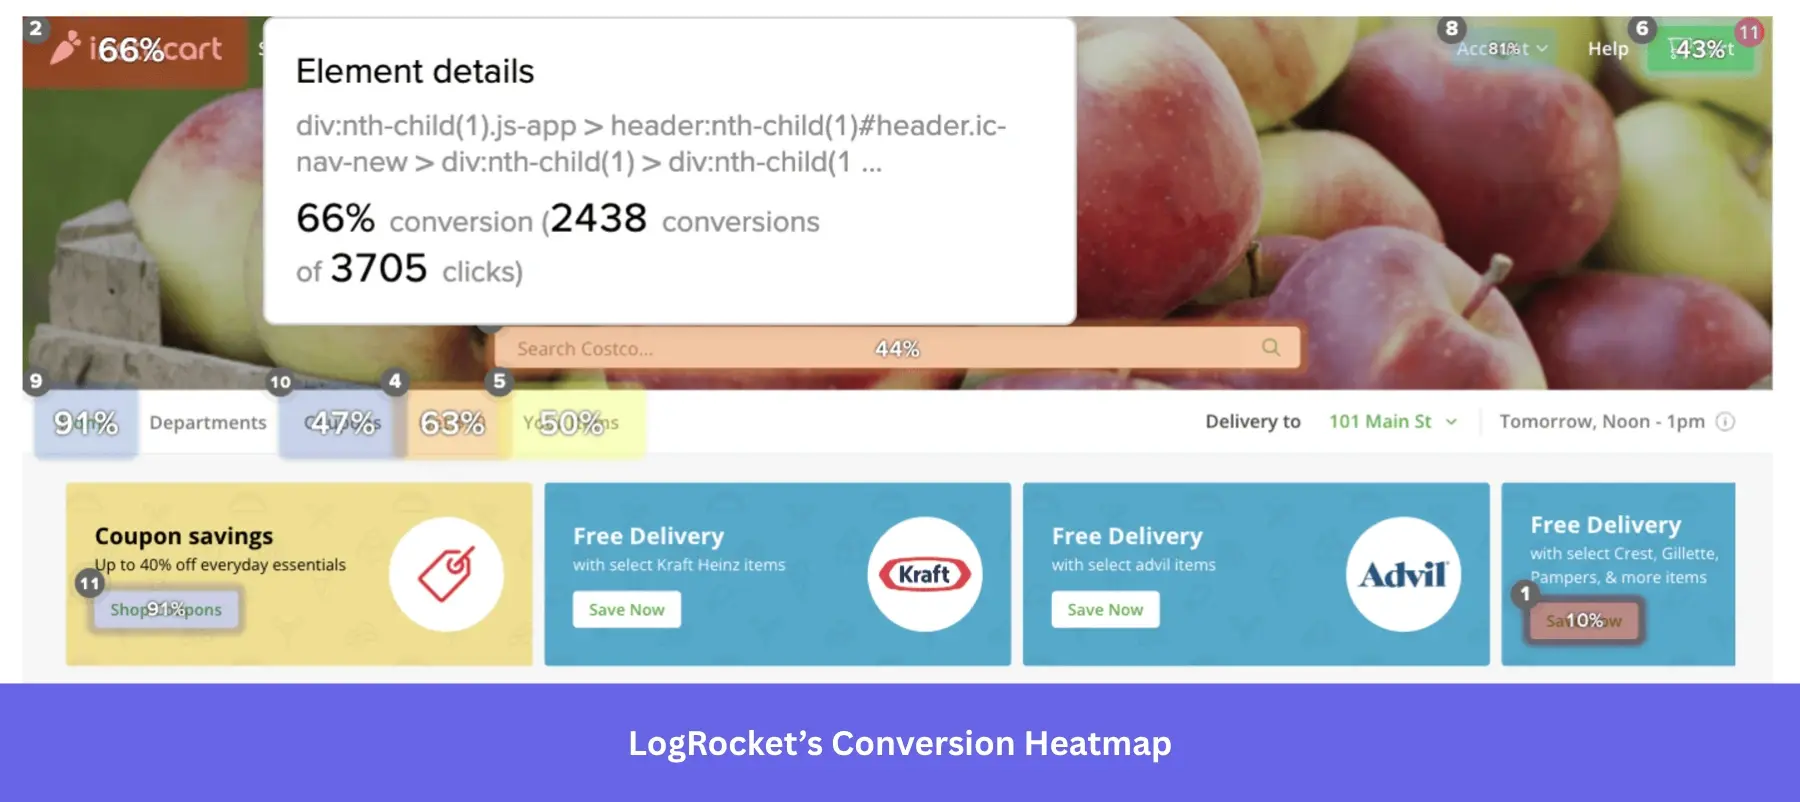
LogRocket also ships heatmaps (clickmaps, scrollmaps, hovermaps, and conversion-rate heatmaps) that show where users interact and where they don’t. It pairs those with funnels, path analysis, retention analysis, and Session Playlists for grouping related recordings. Analytics dashboards, filters, metrics, and alerting round out the analytics side, and the same data underpins feature adoption tracking if you want to know whether a new release is boosting engagement. Designers can use heatmaps to spot confusing navigation or misleading calls to action before they lead to a drop-off in the funnel.
What platforms does it cover?
On web, LogRocket handles iframes, Shadow DOM, and server-side rendering without extra configuration. On mobile apps, it covers iOS, Android, and React Native, with mobile-specific selectors, a performance dashboard for tracking metrics, and dedicated crash-reporting types.
Parity is not complete, though. Dead Clicks, Frustrating Network Requests, and Scroll Depth filtering are web-only and don’t exist on Android or iOS, and LogRocket doesn’t support Surveys on mobile at all. Core replay, network and console capture, Redux state, and the Galileo Issues and Highlights features are at parity across web apps and mobile, so the gaps sit specifically in the secondary detection and engagement layers.
When is LogRocket session replay the right (and wrong) fit?
- Engineering-heavy teams that want replay tied directly to logs, network calls, and Redux state get real value here, because LogRocket was built around that workflow first.
- Products with bug reports that are hard to reproduce from a support ticket alone are the classic use case.
- Teams that need mobile and web parity in a single tool also have a real reason to choose LogRocket over a web-only replay product.
- Support teams that want to open the exact session tied to a ticket instead of asking the customer to reproduce the problem get fast, concrete answers here.
Where teams sometimes outgrow it or look elsewhere
If your use case is pure no-code product analytics tools, including Userpilot, PostHog, and Heap, tend to feel lighter day-to-day and have a less complex setup and a shorter learning curve. In-app guidance, onboarding flows, and NPS programs sit entirely outside LogRocket’s scope, which is why teams running those motions usually pair it with a dedicated PLG tool rather than asking LogRocket to cover both. High-volume sites can also feel the brunt of LogRocket’s pricing model, since costs scale with session volume and seats rather than with a flat fee.
How much does LogRocket session replay cost?
LogRocket prices by sessions, which differs from the older “Team plan, $99, up to 10,000 MTUs” framing. Now, the free plan gives you 1,000 sessions a month with one month of retention and three seats, and Core starts at $69 a month for 10,000 web sessions on an annual commitment, or $295 a month at the Professional tier once you need Galileo AI and the full product analytics suite.
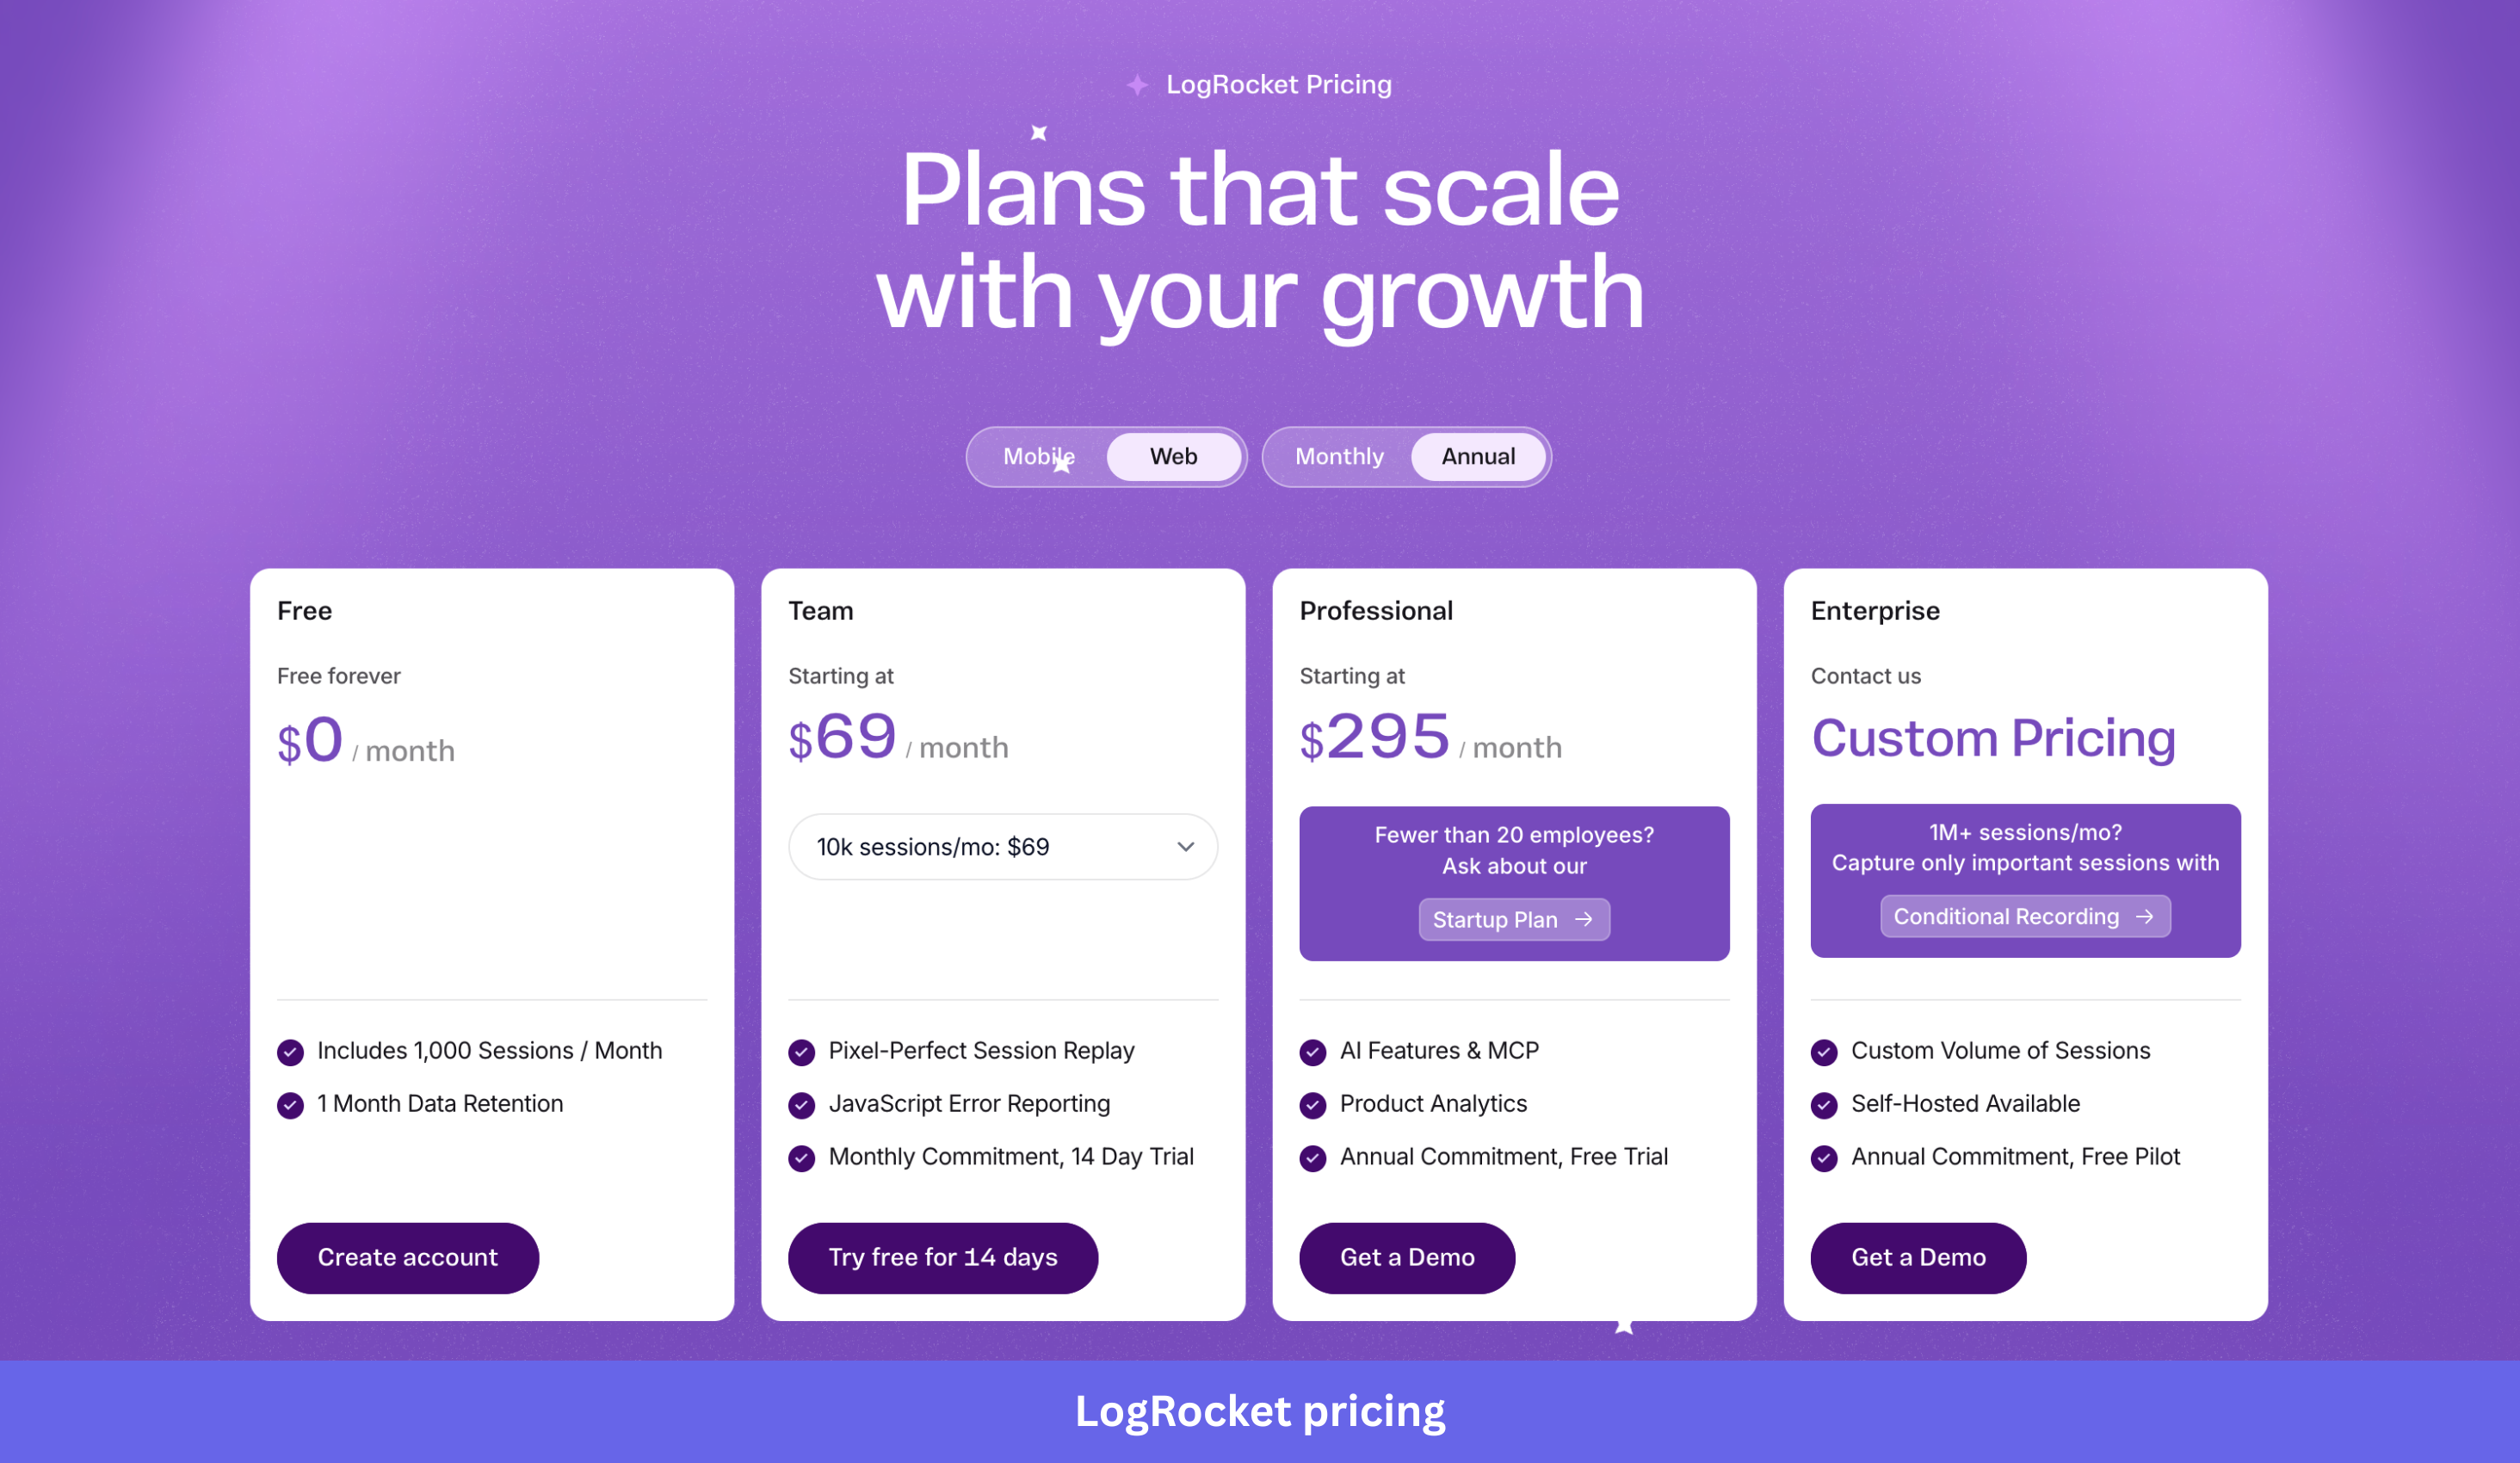
Core is limited to replay and the raw logs underneath it, as LogRocket gates these other features behind the Professional or Enterprise plans:
- The AI layer (Galileo Highlights, Ask Galileo, and Funnel Insights)
- The Issue Analyzer
- Deeper issue detection (network errors, rage and dead clicks, and mobile crashes)
- The full product analytics suite (funnels, heatmaps, and retention analysis)
Budget around the mobile number if your roadmap is mobile-first. Core for mobile starts at $139 a month for the same 10,000-session allowance that costs $69 on web, because mobile SDKs and crash diagnostics cost more to support at scale.
Enterprise pricing is custom-built for teams running more than 1 million sessions a month, and it is the only tier that offers self-hosting options. The gap appears between Free and Core, with users wishing there was an affordable sweet spot for smaller teams. If you’re a small team deciding whether LogRocket is worth it, weigh the Free-to-Core jump against your session volume before committing to Core’s annual term, since there’s no cheaper monthly fallback if you’re wrong.
What do users say about LogRocket session replay?
LogRocket’s pitch is squarely developer-first as it pairs replay with logs, network data, stack traces, and performance telemetry, and sells that combination to engineering teams debugging production issues. It’s excellent at proving what happened when nobody can otherwise agree on it. However, this engineering-first interface becomes much harder to defend once you are the person trying to act on engagement data rather than confirm a bug.
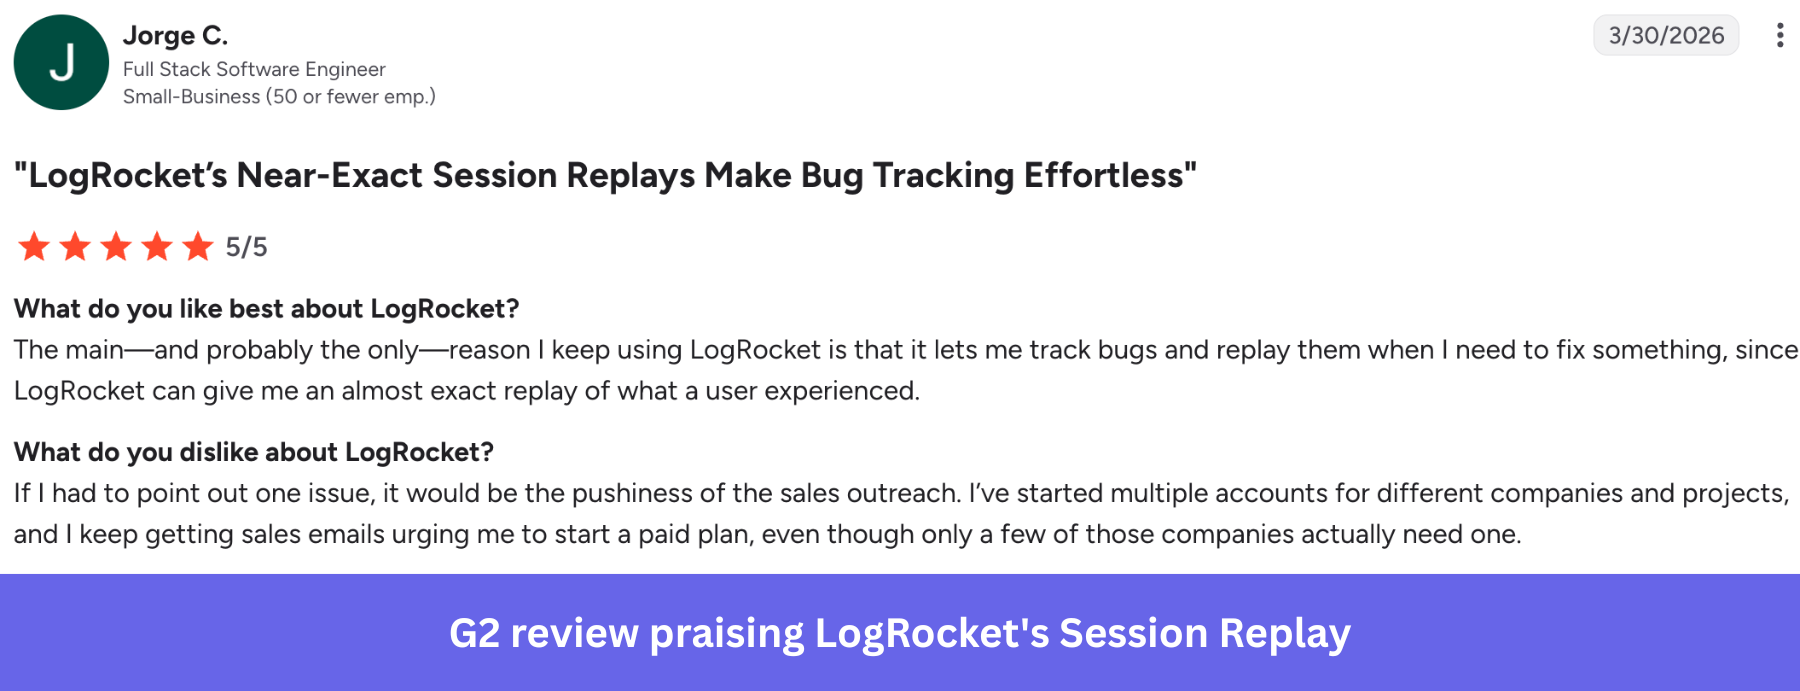
Users praise LogRocket for its replay quality, which holds up when you need it.
- This user calls the replay itself the real game-changer, accurate enough that they can just watch the session instead of going back and forth with the customer.
- Another review describes it as a near-exact reproduction of the user’s experience.
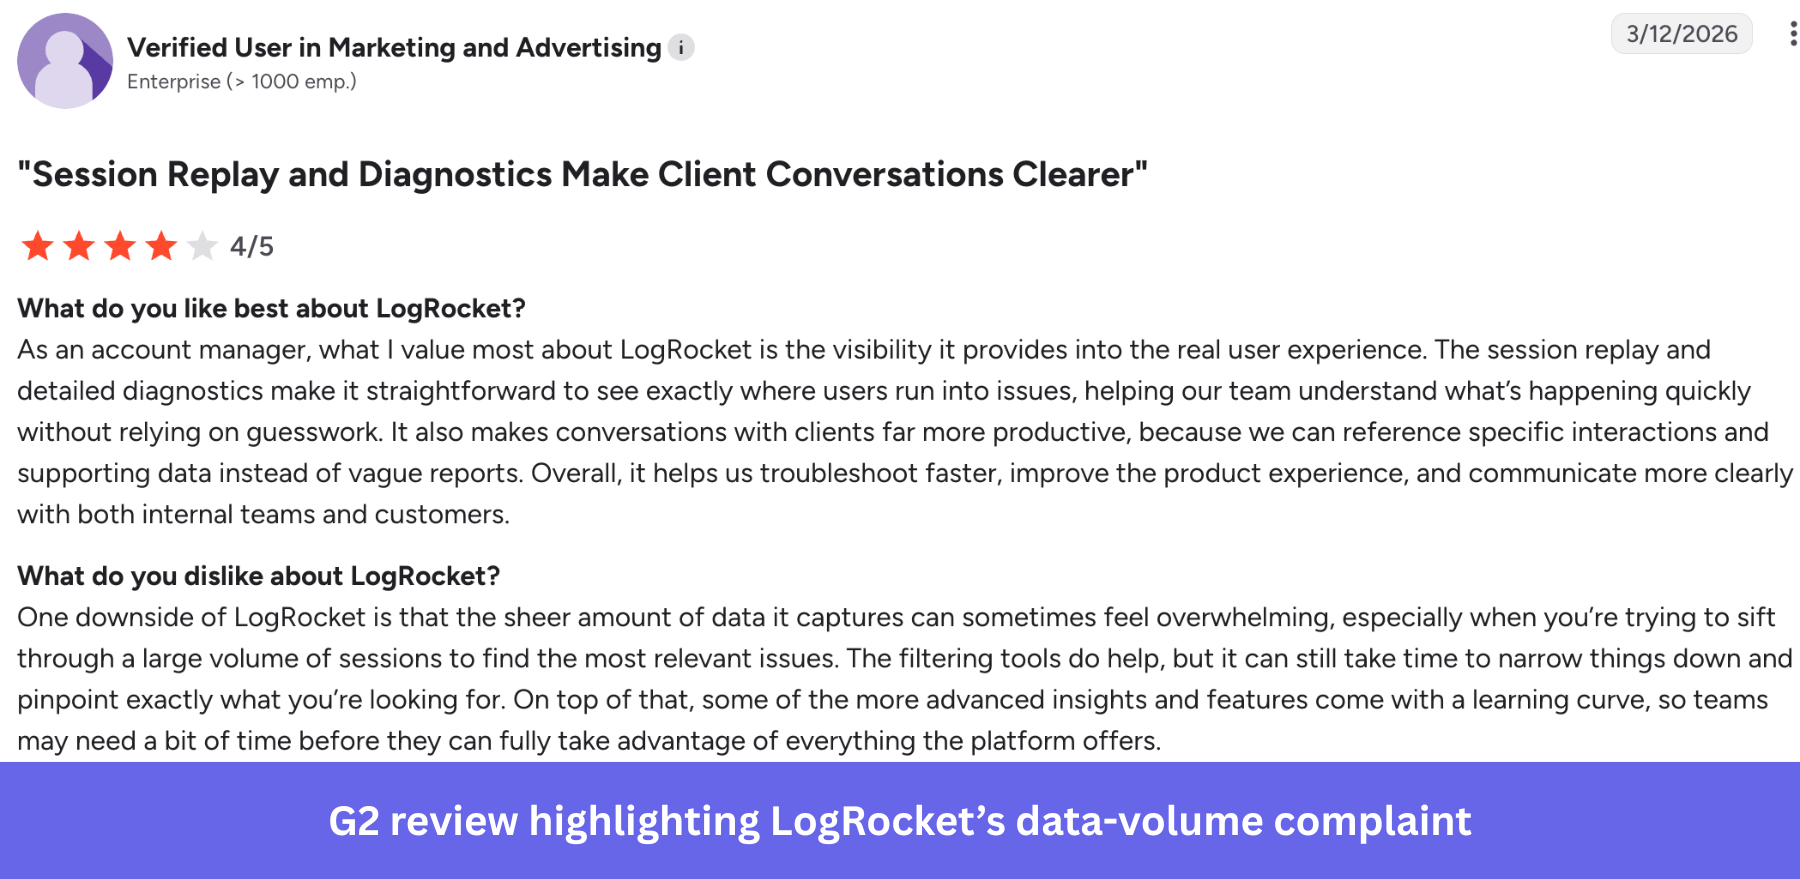
Most users’ complaints are around LogRocket’s performance, data volume, and who the tool is built for.
- This user says the dashboard and session loading feel sluggish, and that the interface isn’t always intuitive to navigate or filter.
- Another user says the sheer volume of captured data can feel overwhelming, and that the more advanced features come with a learning curve.
- A developer on r/reactnative says the interface assumes you are looking for technical problems rather than behavioral ones, and that their product team barely touches it.
That last point is the same gap I know well from the PMM seat. LogRocket lists surveys as limited and sells feedback as an add-on, so the moment you want engagement insights rather than bug evidence, it stops being the right tool for the job.
There’s also a data residency concern. LogRocket hosts standard-plan data on US servers and has no out-of-the-box EU cloud, though it is certified under the EU-U.S. Data Privacy Framework for cross-border transfers. Self-hosting is the only path to EU-based residency, and LogRocket reserves it for Enterprise, so an EU-based team on a standard plan should factor that into procurement before signing.
Why you might choose Userpilot instead!
If you are debugging a production issue and need replay tied to logs, network calls, and Redux state, LogRocket and its Galileo AI layer are hard to beat at that specific job. That’s until your question changes from “what happened” to “what do I do about it.”
In my experience, users were clearly discovering a feature, the activation numbers proved it, and the team still could not explain why engagement stalled past that first interaction. In that situation, you can see the discovery problem in a replay, but you can’t use a replay to fix the engagement problem.
Userpilot helps you act on that engagement data rather than just watch it happen. You’ll have access to in-app onboarding flows, full survey programs, and behavior-triggered guidance in our core product.
Book a demo to see how you can turn engagement data into onboarding flows, surveys, and guidance that improve product adoption.
Disclaimer: Userpilot strives to provide accurate information to help businesses determine the best solution for their particular needs. Due to the dynamic nature of the industry, the features offered by Userpilot and others often change over time. The statements made in this article are accurate to the best of Userpilot’s knowledge as of its publication/most recent update on July 31, 2026.
FAQ
Is LogRocket session replay free?
Yes. The Free plan includes 1,000 sessions a month, one month of retention, and three seats, with no credit card required to start.
Does LogRocket have funnels and cohorts?
Yes, but only on the Professional plan and above. LogRocket excludes funnels, path analysis, heatmaps, and retention analysis from Free and Core.
How much does LogRocket cost?
Core starts at $69 a month for web (10,000 sessions, billed annually) or $139 a month for mobile at the same session volume. Professional starts at $295 a month and unlocks Galileo AI and the full analytics suite. Enterprise pricing is custom.
Is LogRocket GDPR compliant?
LogRocket sanitizes and masks sensitive data client-side before it leaves the browser and is certified under the EU-U.S. Data Privacy Framework, but standard plans host data on US servers. EU-based residency requires self-hosting on the Enterprise plan. Confirm current certification status on LogRocket’s own trust page before treating this as a compliance guarantee.
About the author