Sales-led companies have a higher user activation rate than product-led companies. Does it mean they do something better to activate their users?
That’s one of the questions about user activation rates that we explore in our Product Metrics Benchmark Report 2024. And there are plenty more! You will also learn how to increase it for your SaaS product!

What is the user activation rate?
User activation rate is the percentage of new users who reach the activation milestone in their journey with the product.
To calculate it, simply divide the number of activated users by the total number of new users in a given period, and multiply it by 100. So, if you have 1000 new sign-ups in July and 375 of them reach the activation stage, the activation rate is 37.5%.
Sounds easy?
It is. If you know exactly what the activation milestone is. Or in other words, at what point, do users experience initial product value firsthand. For example, in a project management tool, this could be creating a new project for the first time.

Why is activation rate important for SaaS businesses?
Activation rate is one of the key product success metrics, and it has the largest impact on overall product performance.
According to Fairmarkit, a 25% improvement in new user activation leads to a 34% increase in monthly recurring revenue (MRR).
It makes sense:
Experiencing value is pretty essential for users to adopt a product. What would be the point of using software that doesn’t solve a problem or satisfy a need?
And once users adopt the product, they’re more likely to keep using it and paying subscriptions, upgrade to higher plans, and buy additional products. All of which increases their lifetime value.

What is the average activation rate for SaaS companies?
The average activation rate is 37,5%, and the median activation rate is 37%.
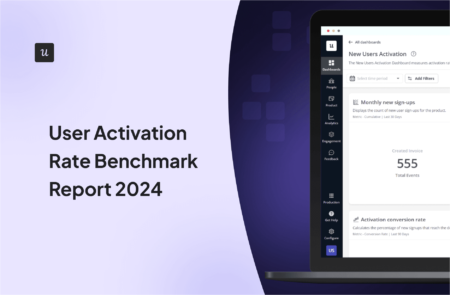
This was based on data from 62 B2B companies collected with Userpilot’s New User Activation dashboard.
How does the figure compare to other benchmarks? Lenny Ratchinsky reported an activation rate of 36% in his report, so the data seems consistent.
![]()
Try Userpilot and Take Your Activation Rates to the Next Level

Average activation rate by industry
To make the insights more meaningful, we segmented the companies by industry. To ensure you can compare your company’s performance to similar ones.
Here’s what we found:
- AI & ML – 54.8%
- CRM & Sales – 42.6%
- MarTech – 24%
- Healthcare – 23.8%
- HR – 8.3%
- FinTech & Insurance 5%
54.8% at one end, 5% at the other. That’s quite a spread.
How can we explain it?
AI & ML technologies have been capturing people’s imagination for the last few years. People are excited by the new opportunities they offer and are keen to experiment with new tools to gain a competitive edge. This could be the reason for high activation rates.
In contrast, finance and insurance are highly regulated industries. Ensuring compliance often requires more complex implementation and onboarding, resulting in lower activation.

Average activation rate by company size
How does company size affect activation rates?
Our data shows that it decreases as the company revenue grows. The smallest companies ($1-5M) have the second highest rate of 41.6%. This goes down to 36.9% for companies grossing $5-10M and takes a proper dive down to 17.6% for those in the $10-50M bracket.
No surprise here: smaller companies may be able to offer more personalized high-touch support and onboarding experiences, but this gets increasingly harder as they scale.
Interestingly enough, the highest activation rate (43.1%) was recorded by the largest companies with a gross revenue of $50M. Such companies might have been able to refine their onboarding and user engagement strategies and have the resources to implement them consistently.

Average activation rate by PLG and SLG
Product-led companies are expected to have higher activation rates because of the effort they put into customer onboarding and education. That’s because users have to experience the product value before they convert to paying customers.
And yet, PLG businesses had a lower average activation rate (34.6%) than sales-led ones (41.6%).
The reason?
In SLG, monetization happens early in the user journey. Users have to pay upfront to be able to use the product. And once they invest, they want to see ROI as soon as possible, so they activate quickly.
In contrast, PLG companies offering free trials or freemium plans tend to attract less committed users who sometimes have no intention of purchasing the product at all. This brings down the activation rate.

How to boost your activation rate?
Yakov Carno, a PLG Adviser and Founder at Valubyl, identifies 3 key steps to improving activation rates.
The first one is “understanding the reason they signed up.” That’s knowing their pain points, needs, and wants. So robust and ongoing product discovery is a must.
Next, comes “identifying what they need to do in order to experience that”. You can figure this out by analyzing the user paths of your most successful customers.
The final step is “designing a user journey that makes it as quick and easy as possible for them to do those things.” Let’s have a look at a few ways to achieve this.

Personalize onboarding flows according to the user’s JTBD
Personalization is the name of the game when it comes to effective user onboarding. Your users don’t need all the features – just those necessary to complete their tasks. By customizing the onboarding process for individual use cases, you reduce the time to value and eliminate distractions.
Here’s how:
Start the onboarding process with a welcome survey. Use it to profile new users by asking them about their roles, objectives, and JTBDs.
Segment them based on the data.

For each segment, trigger a bespoke onboarding flow that takes them to value along their happy paths. Which you have identified previously by tracking user behavior in-app.

Guide users to activation events with an onboarding checklist
Onboarding checklists are a powerful user activation tool. They are clear to follow and guide users through the key activation actions they need to complete in a structured manner.
What makes them so effective?
They tap into a strong psychological process called the Zegeirnik effect.
In a nutshell, when people have all their tasks laid out in front of them on a checklist, they find it difficult to move on to different activities. And the more tasks they tick off, the stronger the urge to complete them all.

Identify and remove friction points from the activation funnel
Friction at the activation stage can increase time to value and lower activation rates dramatically. Users who experience usability issues or poor UI, take longer to reach the activation stage. And if the UX is particularly bad, they give up altogether.
Fortunately, you can easily find friction points in the onboarding process by conducting funnel, path, and session replay analysis.
And once you know where the issues are, you can smoothen the ride by providing additional in-app guidance.

Conclusion
User activation rate is a metric that has an impact on the long-term customer, product and business success.
Users who activate quickly, are more likely to turn into loyal customers generating a steady revenue stream and acting as product advocates.
If you’d like to learn how to track and boost the activation rates of your SaaS product with Userpilot, book the demo!
![]()
Try Userpilot and Take Your Activation Rates to the Next Level
About the author