Harnessing the power of data-driven analysis can transform how you make decisions, fine-tune your strategies, and, ultimately, boost your bottom line.
But what exactly does it involve, and how can you use it to your advantage? This article will be your go-to guide, breaking down the concept of data-driven analysis and showing you practical ways to apply it to your specific business needs.
Try Userpilot Now
See Why 1,000+ Teams Choose Userpilot

What is data-driven analysis (short summary)
- Data-driven analysis is the process of using data to make strategic decisions or gain insights. It cuts across different business processes — you can implement the principles to create data-driven marketing campaigns, improve your product offerings, optimize customer support, and so on.
- A reliable data-driven approach…
- Helps you make the right decisions.
- Enhances customer understanding.
- Improves accountability and transparency within your organization.
- Examples of data analysis scenarios
- How to become a data-driven organization:
- Encourage all teams – from marketing and sales to customer success and product development – to view data as an invaluable asset that can inform their decision-making process.
- Establish a data-driven strategy where small and big data can flow freely and securely across different departments (you can use tools like Userpilot).
- Leverage no-code analytics tools for reports (that way, your non-technical teams won’t have to rely on professional analysts for predictive analysis and data-driven decision-making).
- Ready to implement a data-driven approach to your processes? Book a demo and see how Userpilot can help you track the different analysis types and deploy contextual in-app solutions.
What is data-driven analysis?
Data-driven analysis is the process of using data to make strategic decisions or gain insights. It involves collecting, analyzing, and interpreting data to reveal patterns, trends, and relationships between components.
By leveraging statistical tools and software, data-driven companies are able to make evidence-based decisions, enhancing accuracy and reducing biases.
Why should you take a data-driven approach?
The benefits of data-driven analysis are enormous. Here are a few:
- Informed decision-making: Data-driven analysis provides a factual basis for decision-making, reducing the risk of relying on gut feelings or inaccurate assumptions. By analyzing trends, patterns, and correlations in data, you can identify opportunities, anticipate challenges, and make strategic choices that are more likely to lead to success.
- Enhanced customer understanding: A data-driven strategy gives valuable insights into customer preferences, behaviors, and pain points. This enables you to personalize products, services, and marketing campaigns, tailoring them to meet the specific needs of your target audience.
- Accountability and transparency: A data-driven approach is inherently transparent because the evidence supporting decisions is laid out. This promotes accountability, as it’s easy to track the performance of different strategies and determine who was responsible for each. This transparency can build trust among stakeholders and foster a culture of continuous improvement within the organization.
Examples of data analysis methods
Data analysis methods vary depending on the specific insights you need. Here are a few common examples:
Qualitative data analysis
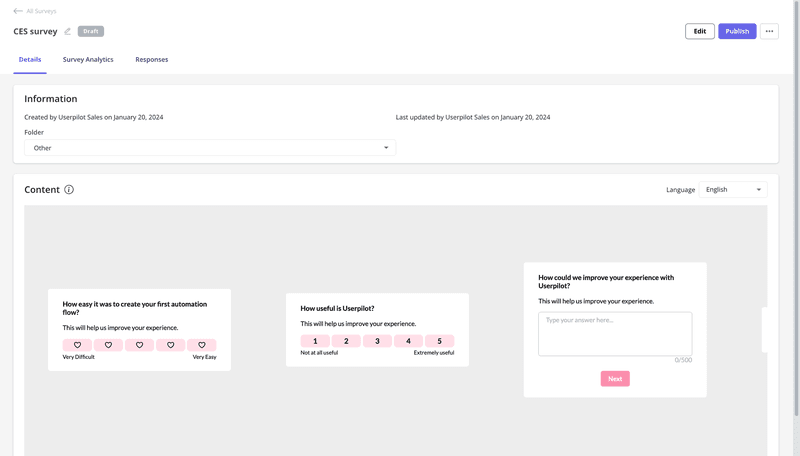
This method involves analyzing non-numerical data, such as text-based feedback surveys, user interviews, and customer reviews. It often focuses on identifying themes, patterns, and meanings within the data.
Qualitative analysis is best used when you need to uncover the “why” behind user behavior. For example, if you notice a decline in user engagement, you can trigger qualitative surveys and analyze the responses to understand user pain points and note improvement areas.
Quantitative data analysis
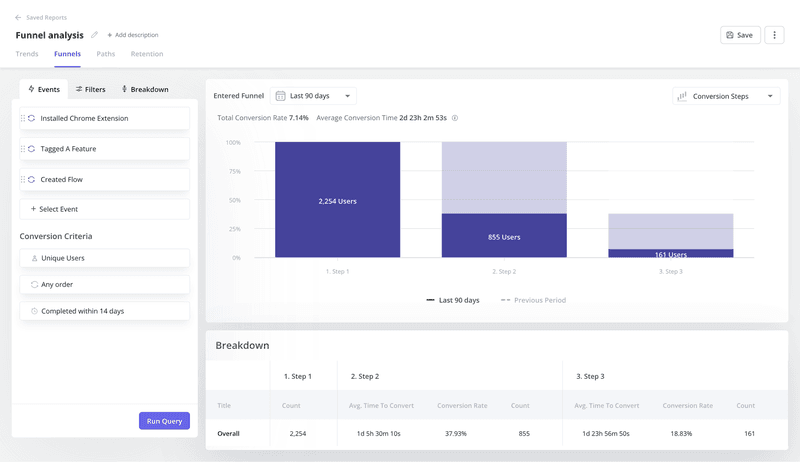
This method focuses on numerical data, allowing you to track and measure key performance indicators (KPIs) for your business. You can analyze user engagement metrics, funnel drops, conversion rates, NPS scores, and churn rates to assess your product’s success and identify areas for optimization.
Quantitative analysis can help you make data-driven decisions about pricing, marketing strategies, and product development. For example, you can use funnel analysis to understand where drop-offs occur most in your conversion process and deploy data-driven solutions.
Sentiment analysis
This type of analysis evaluates textual data to determine the sentiment or emotional tone behind it.
Sentiment analysis uses natural language processing and machine learning to classify opinions as positive, negative, or neutral, making it effective for social media monitoring, customer feedback analysis, and brand reputation management.
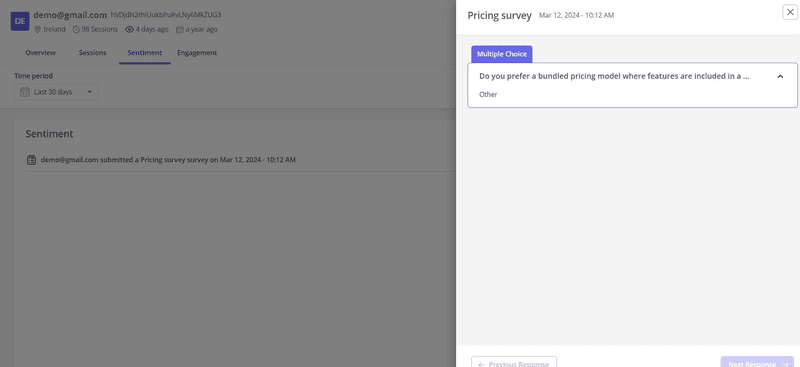
One valuable application of this analysis is tracking customer sentiment over time. By monitoring the changing emotional tone in user or company accounts, you can quickly identify when a power user is losing interest in your product or, conversely, when a user is becoming more engaged. This valuable insight can help you proactively address potential issues and capitalize on opportunities.
Userpilot’s Profile Analysis feature can help you effortlessly identify sentiment trends for individual and company accounts:
How to build a data-driven culture for your SaaS?
Creating a data-driven culture in your SaaS organization involves several key steps to ensure data is accessible, understandable, and used to inform decision-making. Follow these steps to get started:
Facilitate data collection across departments
Encourage all teams – from marketing and sales to customer success and product development – to view data as an invaluable asset that can inform decision-making. Regularly discuss relevant metrics and tie them to team goals to reinforce this data-driven mindset.
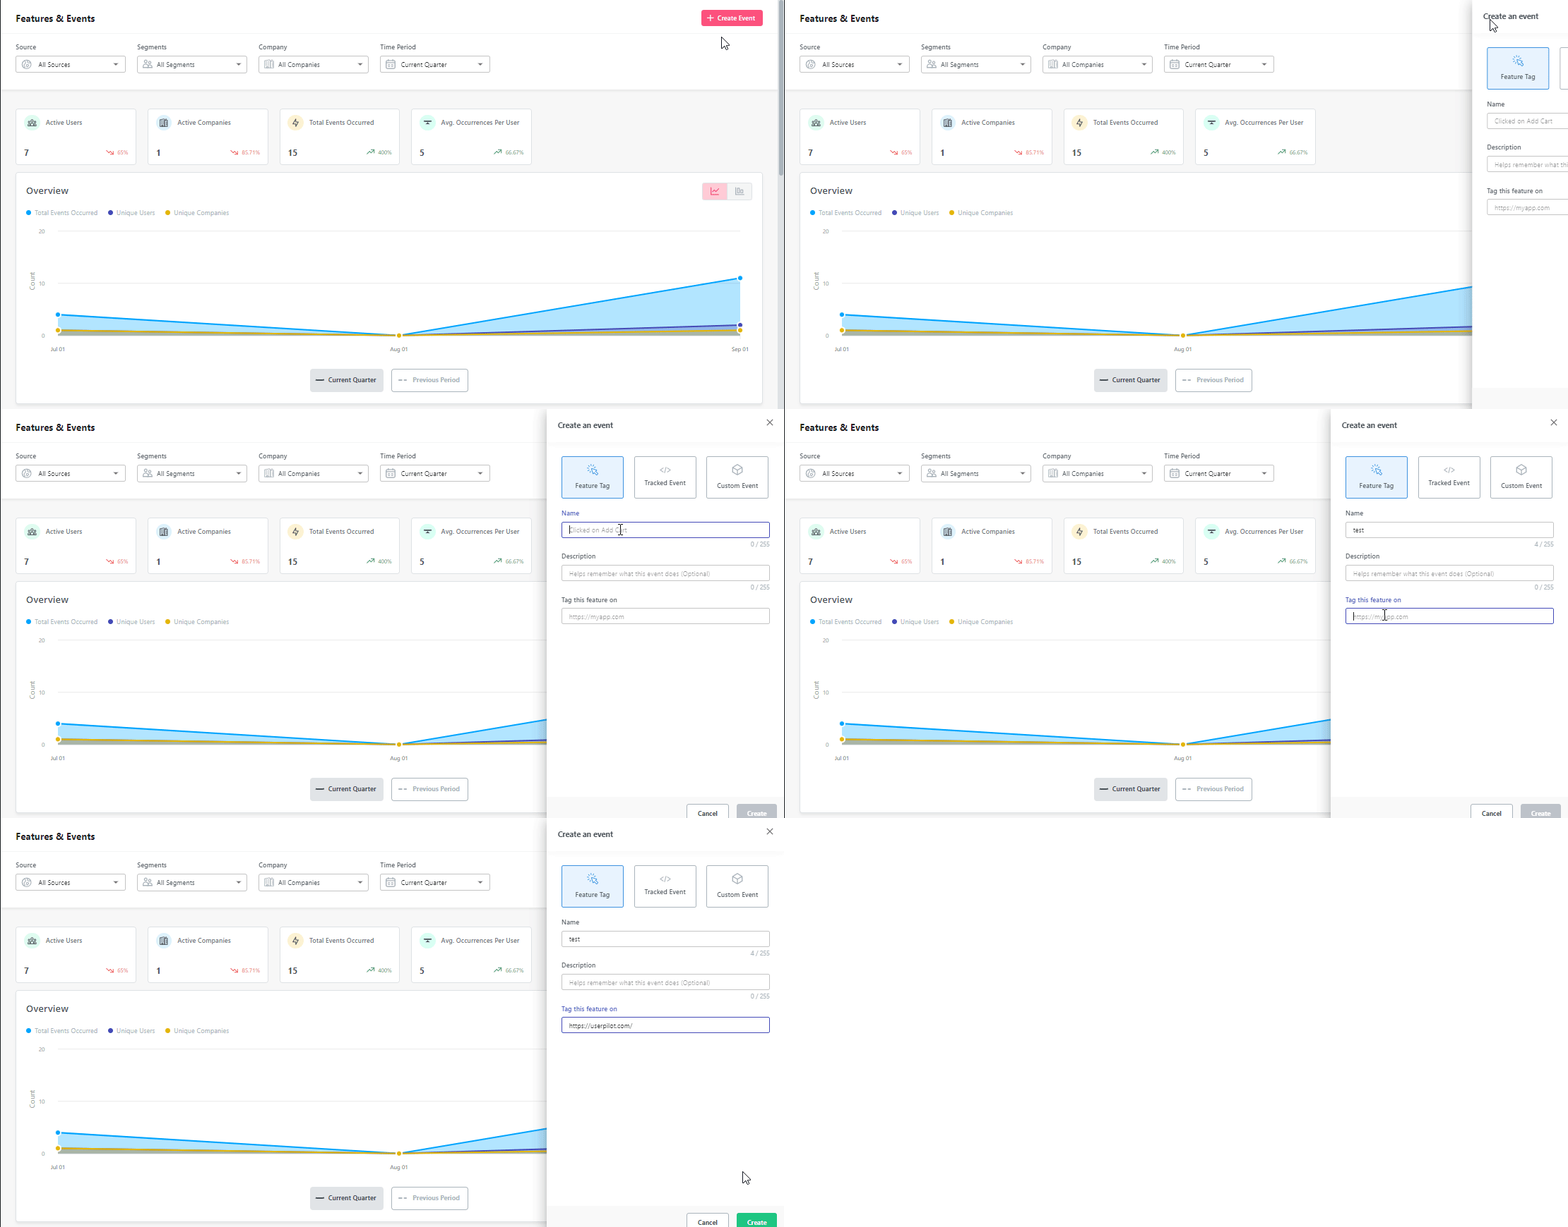
To streamline data collection, leverage no-code and low-code tools like Userpilot to automate event tracking. These tools simplify capturing user actions within your product—such as button clicks, feature usage, and sign-ups—without requiring extensive coding knowledge.
For instance, you can configure Userpilot to track how many users complete your onboarding flow or engage with specific features, providing insights into areas that might require refinement.
Enable data sharing
Data silos are a common obstacle to a truly data-driven culture. To overcome this, it’s imperative you establish a data management system where relevant data can flow freely and securely across different departments.
Centralized analytics dashboards, reports, and data visualization tools play a pivotal role in achieving this. These platforms offer a unified view of key metrics and insights, ensuring everyone has access to the information they need.
However, access alone is not enough. To prevent “data blindness,” where existing data sits unused and insights are missed, prioritize regular communication – share data analysis reports and discuss key findings in cross-departmental meetings. This collaborative, data-driven approach fosters a shared understanding of the company’s performance and facilitates informed decision-making at all levels.
Leverage no-code analytics tools for reports
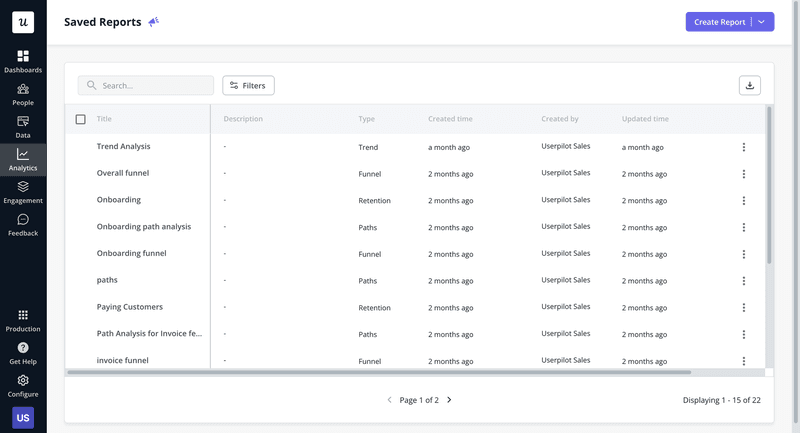
No-code analytics tools empower individuals with varying technical skills to generate custom analytics reports and dashboards through intuitive interfaces. This removes the dependency on data analysts and accelerates the process of turning raw data into actionable insights.
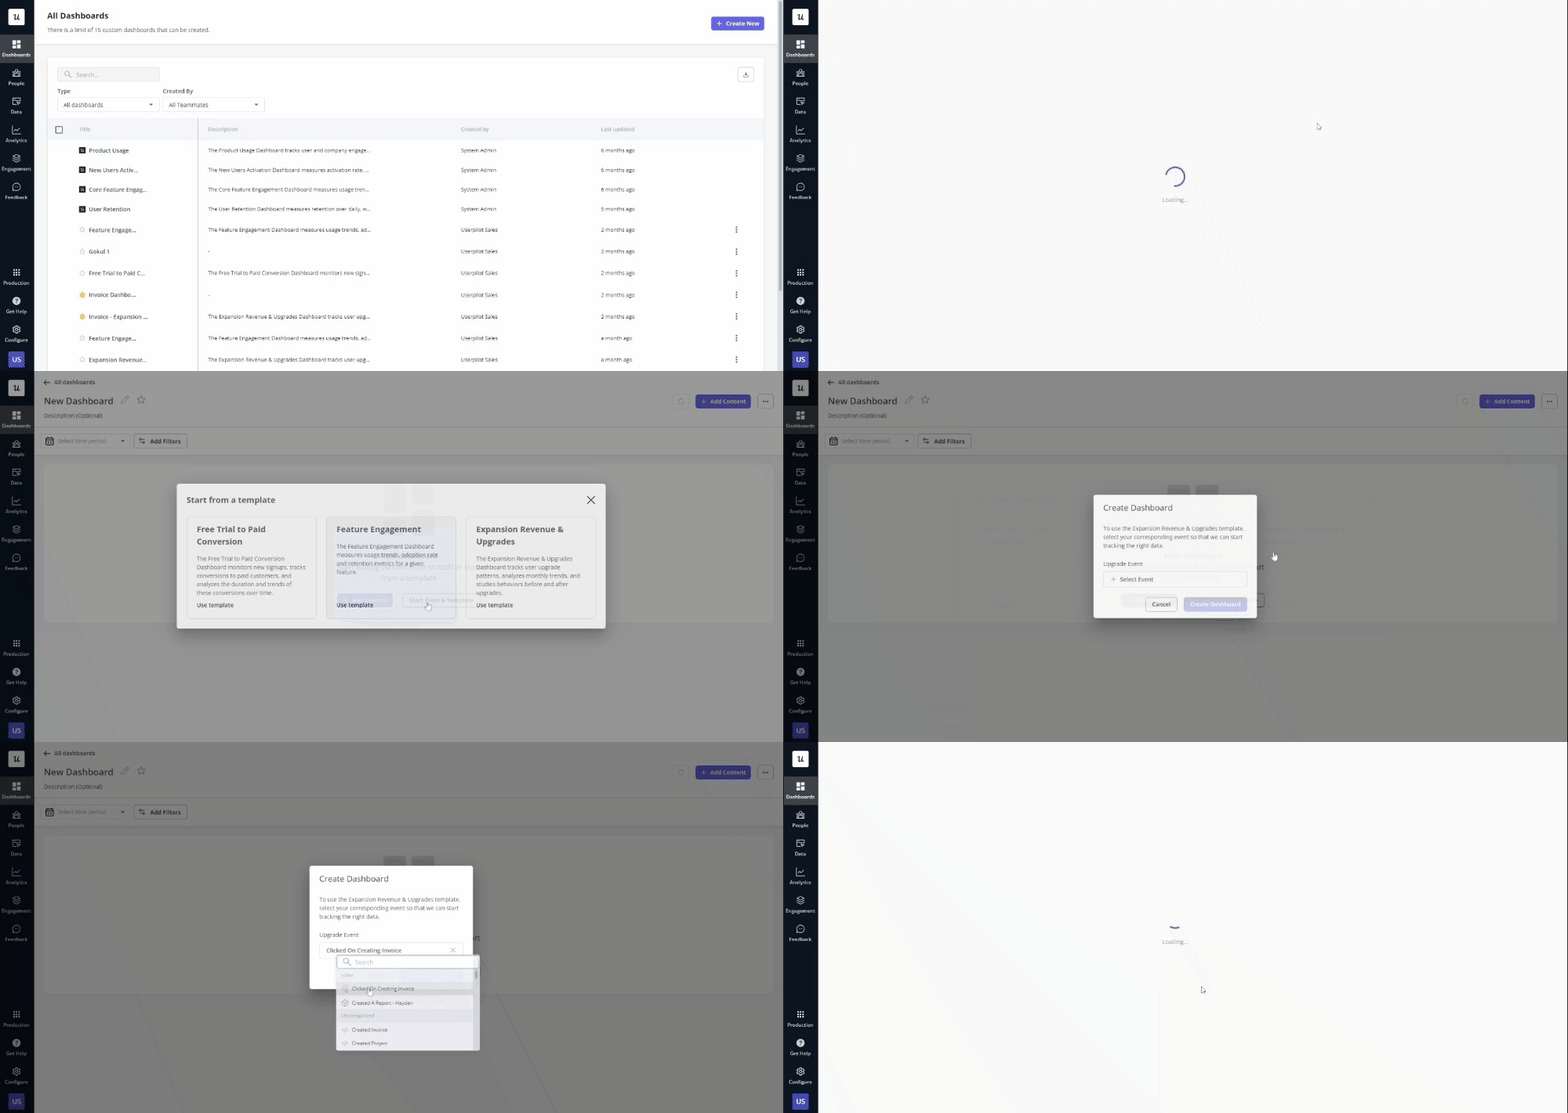
Userpilot makes it much easier. You can use templates to set up data analytics dashboards that track your most important metrics or build custom dashboards from scratch, only including the metrics you want to see.
For instance, your product team can set a dashboard to monitor adoption rates, while customer success tracks help center visits and onboarding completion – all without writing a single line of code. This ease of use and customization will encourage greater engagement with data across your organization, leading to a more data-driven approach to problem-solving and decision-making.
Conclusion
For comprehensive insights, it’s best to combine different data analysis methods. Qualitative analysis uncovers the motivations behind customer behavior, quantitative analysis illuminates what customers are doing, and sentiment analysis gauges how customers feel about your product or brand.
Ready to get started with data-driven analysis? Book a demo and see how Userpilot can help you track the different analysis types and deploy contextual in-app solutions.


