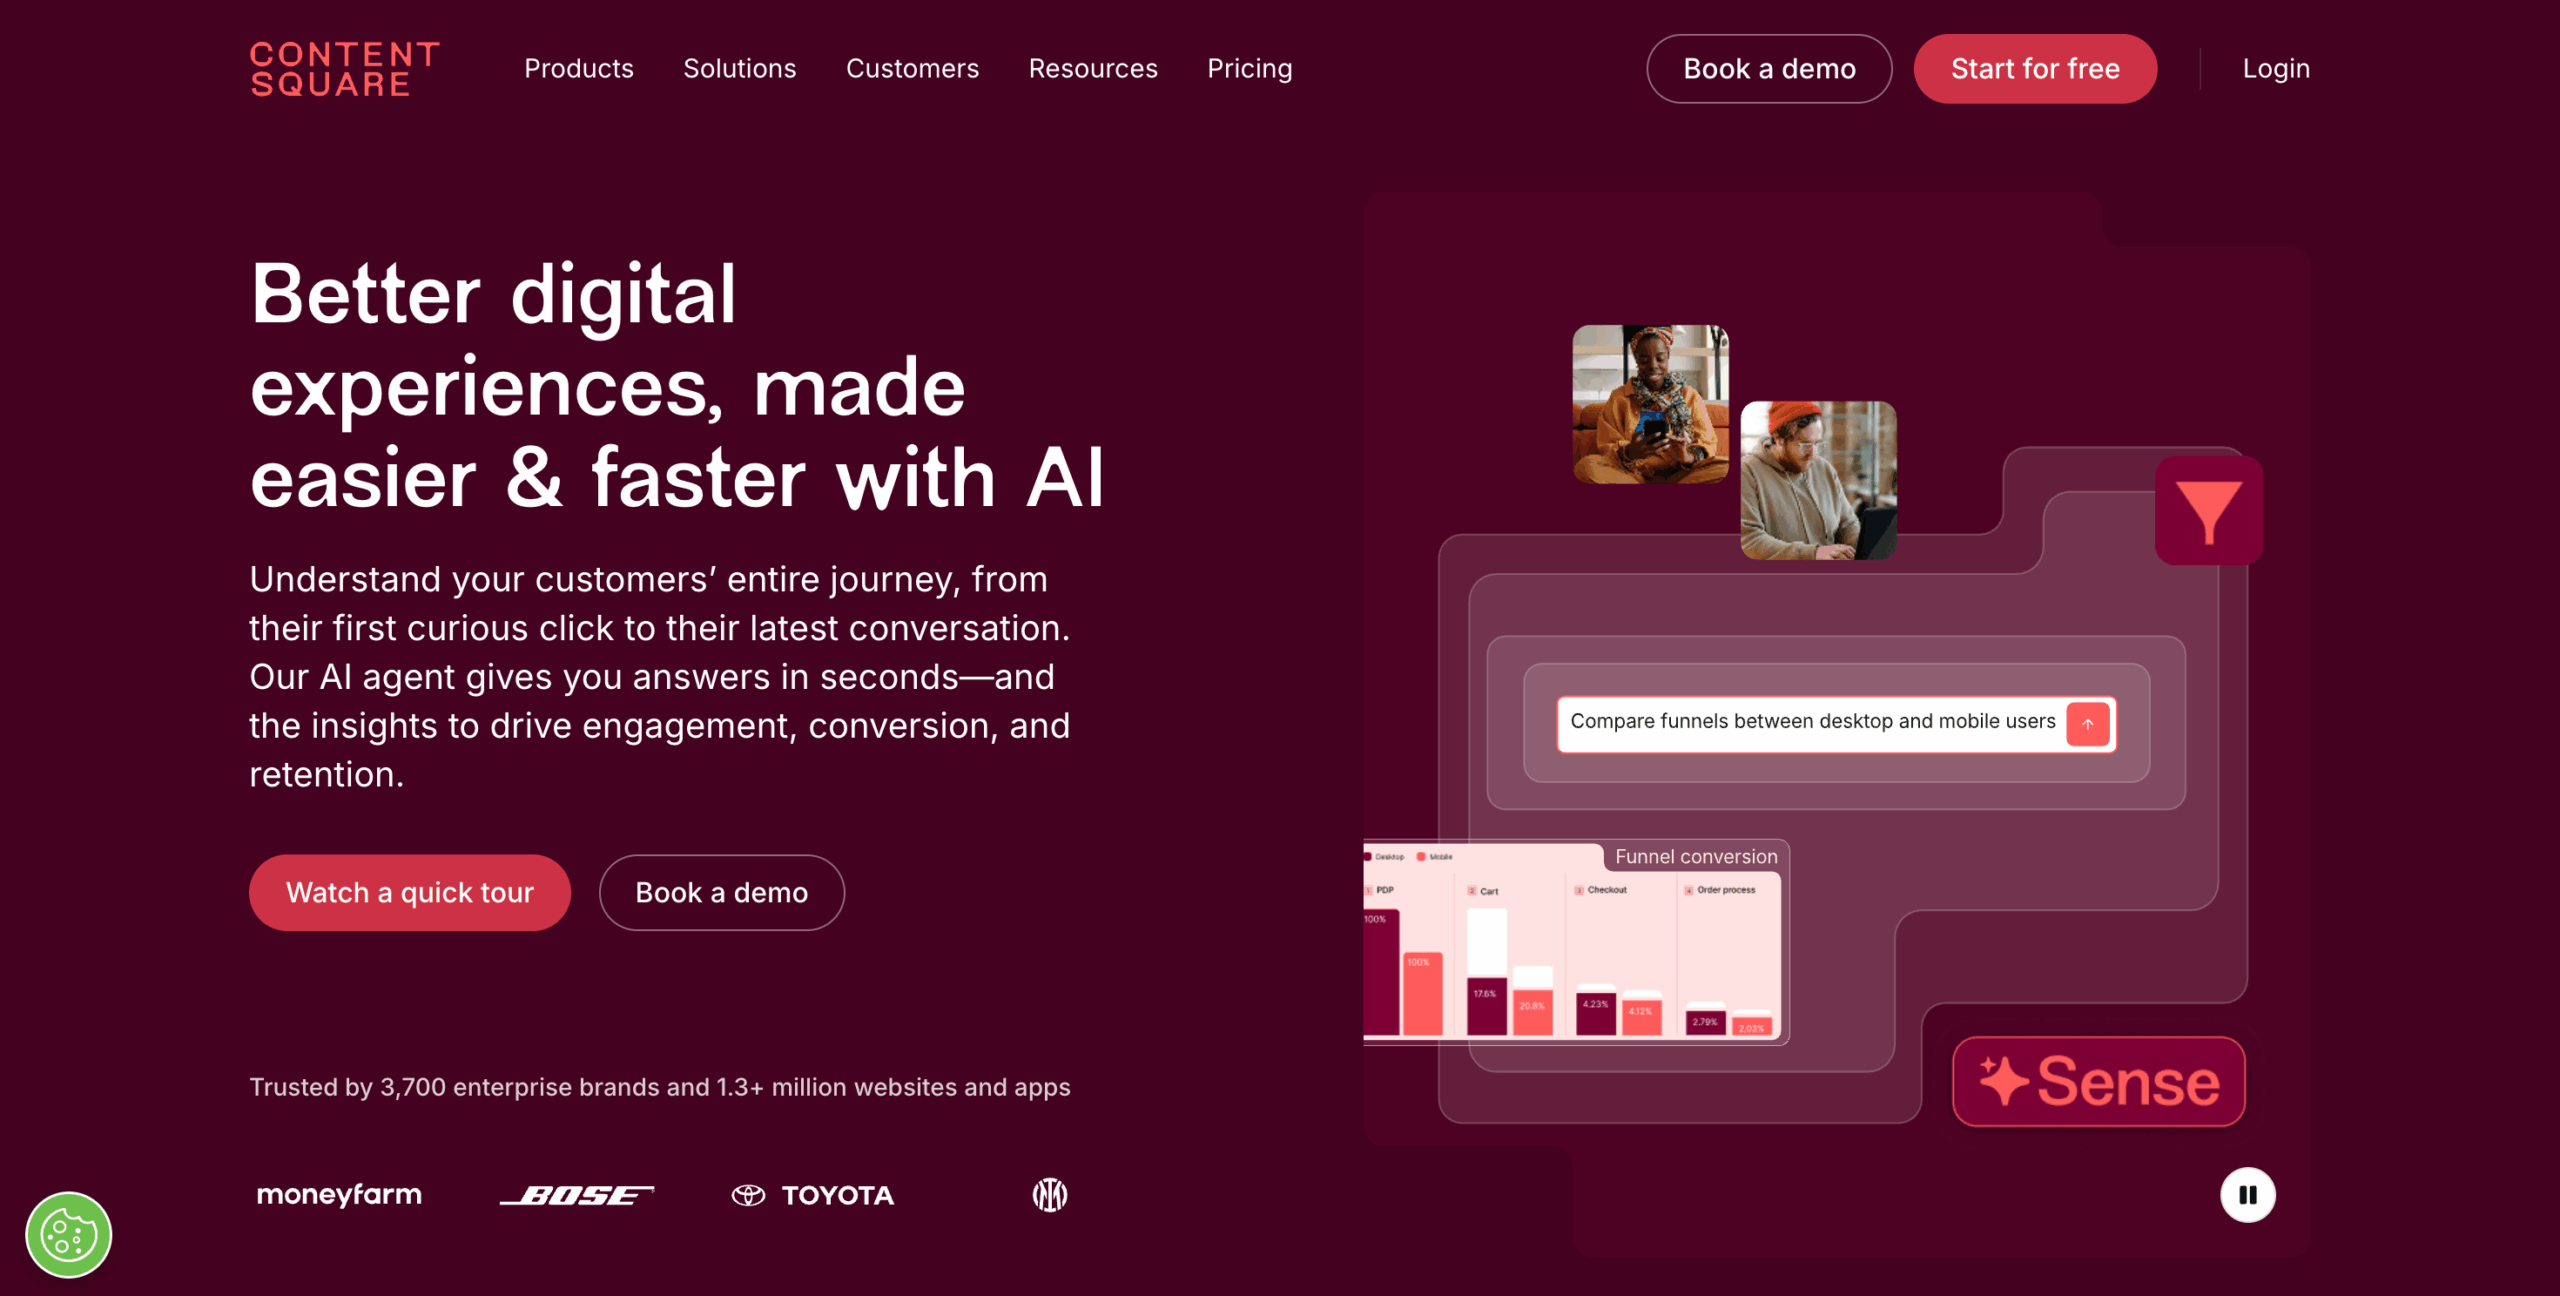
If you’re looking for Contentsquare competitors, it’s probably because you find it either too expensive, hard to use, or simply not actionable.
So I’ll break down the top alternatives that can also help you track behavior, visualize the user experience via session replay, and make informed decisions.
Finding the right Contentsquare competitors?
Contentsquare is powerful, but often expensive and complex. Answer 3 quick questions to find the best alternative for your specific needs.
Try Userpilot Now
See Why 1,000+ Teams Choose Userpilot
Why look for Contentsquare alternatives?
Contentsquare is great at combining quantitative and qualitative data for product analytics.
Yet, it’s not for everyone. Many PLG teams might want to switch away for three main reasons:
- Cost: Although Contentsquare’s pricing page shows two digits, the main product analytics suite is always custom-priced. This means the product is mainly targeted to large enterprises with massive budgets and dedicated analytics teams.
- Complexity: There’s a steep learning curve. You’ll need a dedicated customer success manager to learn the product or ask for engineering help to instrument events.
- Actionability gap: It shows you the problem, but it does not give you the tools to fix it inside the app immediately. You have to take the data, go to your dev team, and wait for a sprint cycle to push a fix.
So if you’re on a fast-moving product team that needs more flexibility, then Contentsquare might not be the best fit for you.
6 Alternatives to Contentsquare for digital experience analytics
When evaluating Contentsquare competitors, I looked for four specific traits:
- Complete data collection: The tool must combine quantitative data (funnels, trends, retention tables) with qualitative analysis (session replays, heatmaps). You need the numbers to see the trend and the visuals to understand the context.
- Data democratization: It must be usable by product managers, marketers, and customer success teams, not just data scientists. If it requires SQL to find basic answers or complex “zoning” setups, it slows down decision-making.
- Actionability: Do the insights lead to an action? Can you successfully close the feedback loop? Can you trigger a survey or a message based on the data you see?
- Useful integrations: Does it sync with your CRM (Salesforce/HubSpot) and CDP (Segment)? Can you easily transfer data to a warehouse or connect to Google Analytics?
Below, I’ll break down the top alternatives, how their features fare against Contentsquare, and when to choose each.
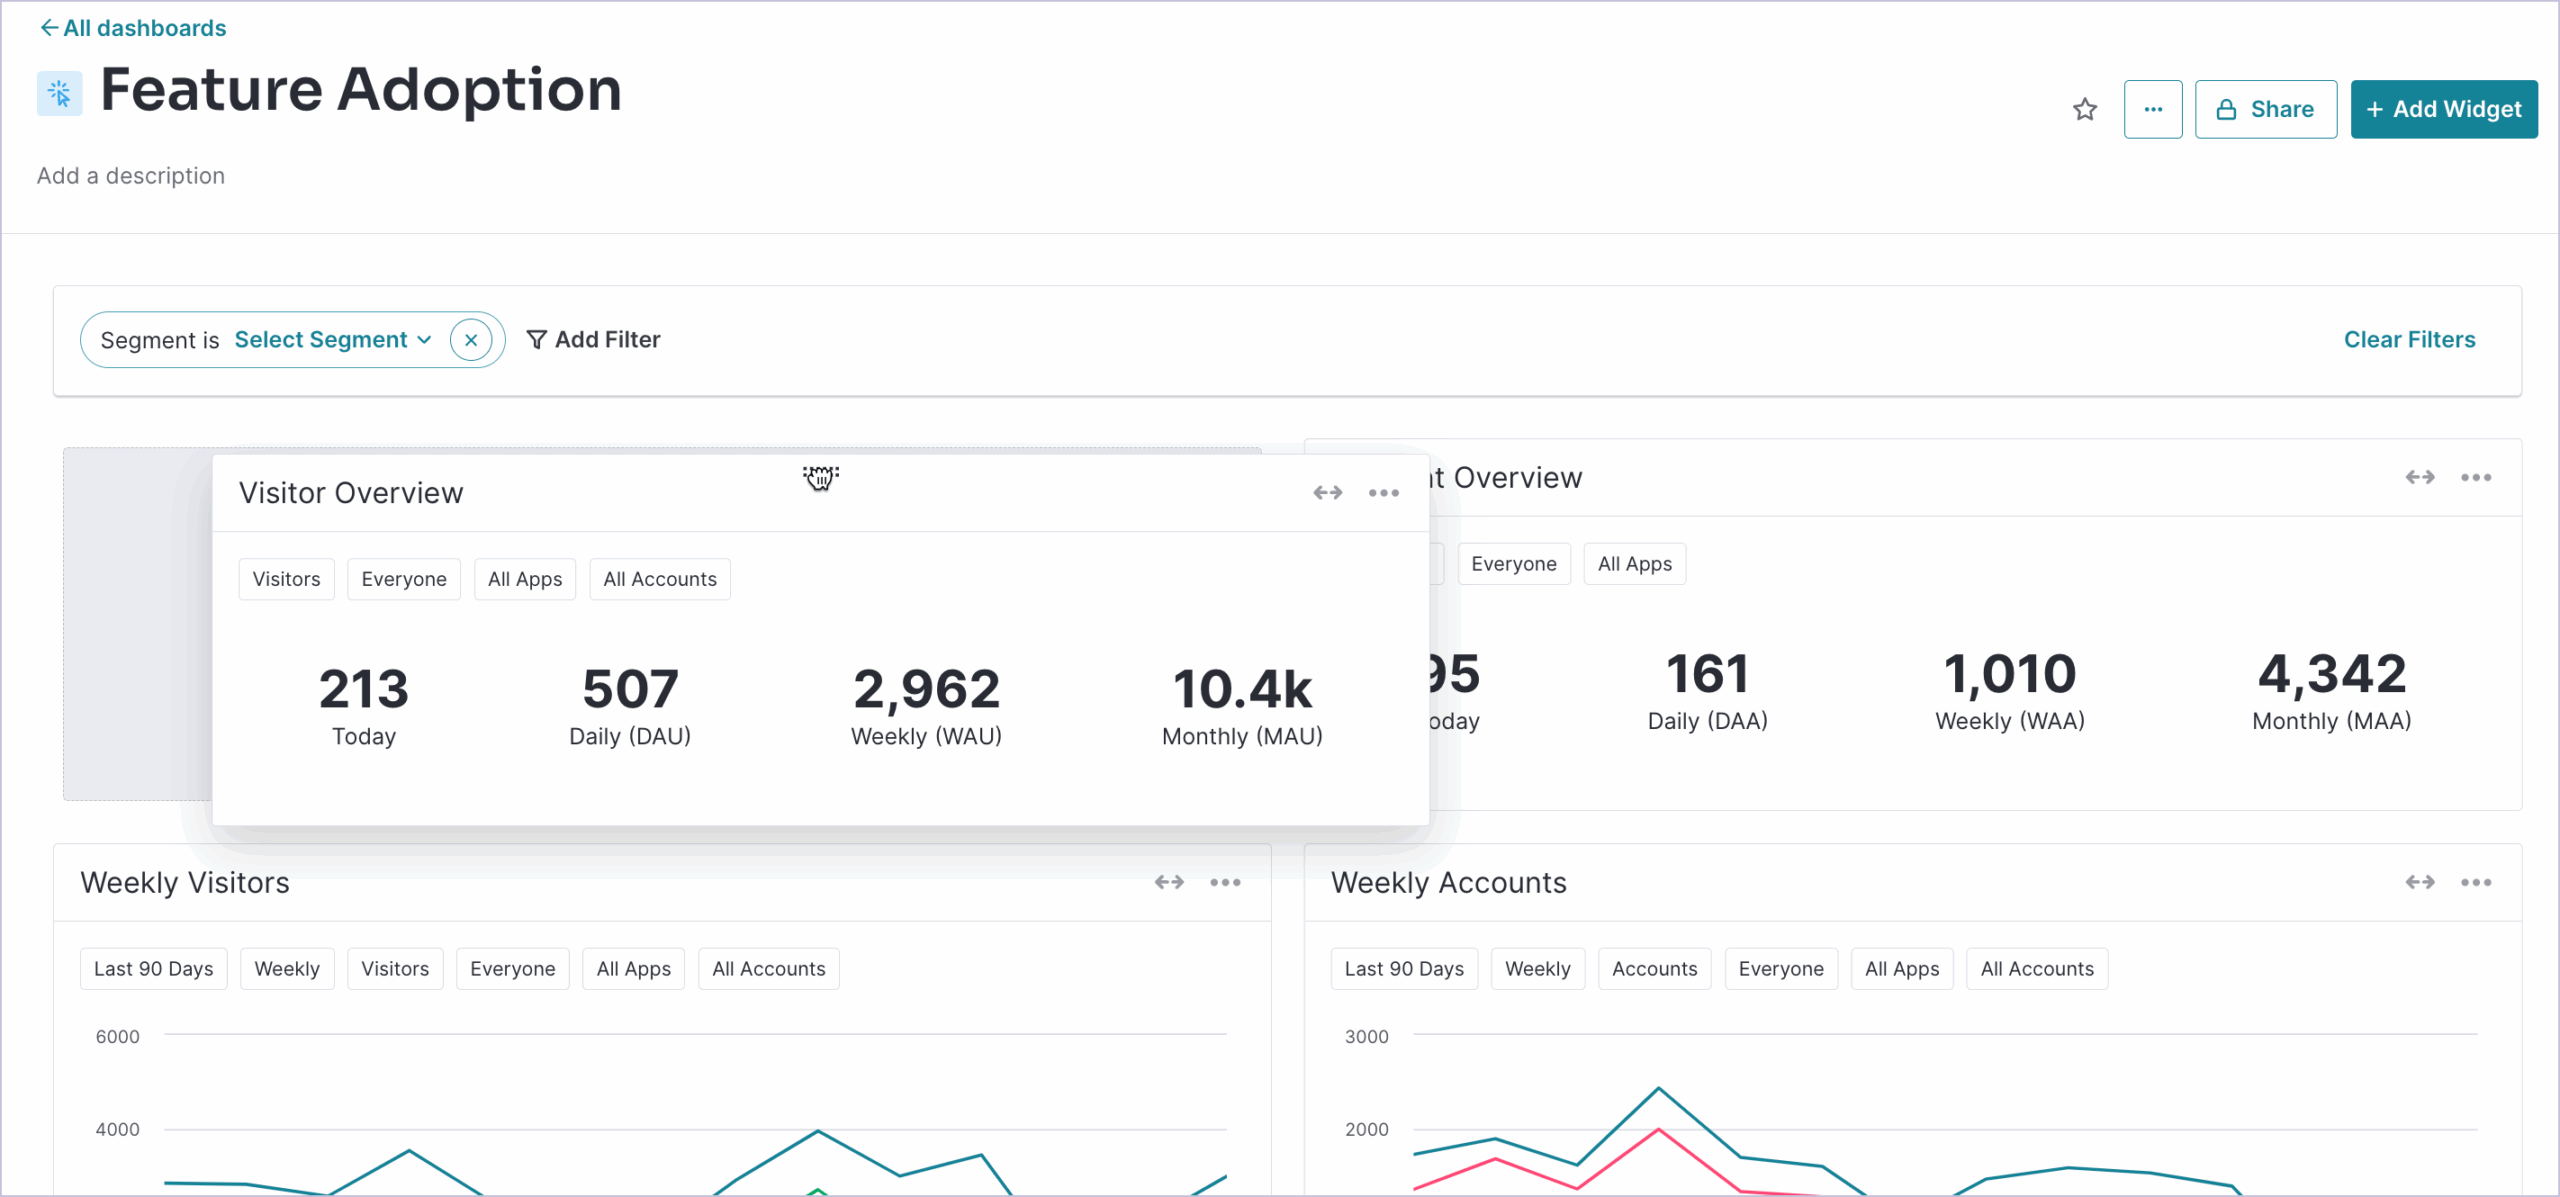
1. Contentsquare vs Userpilot
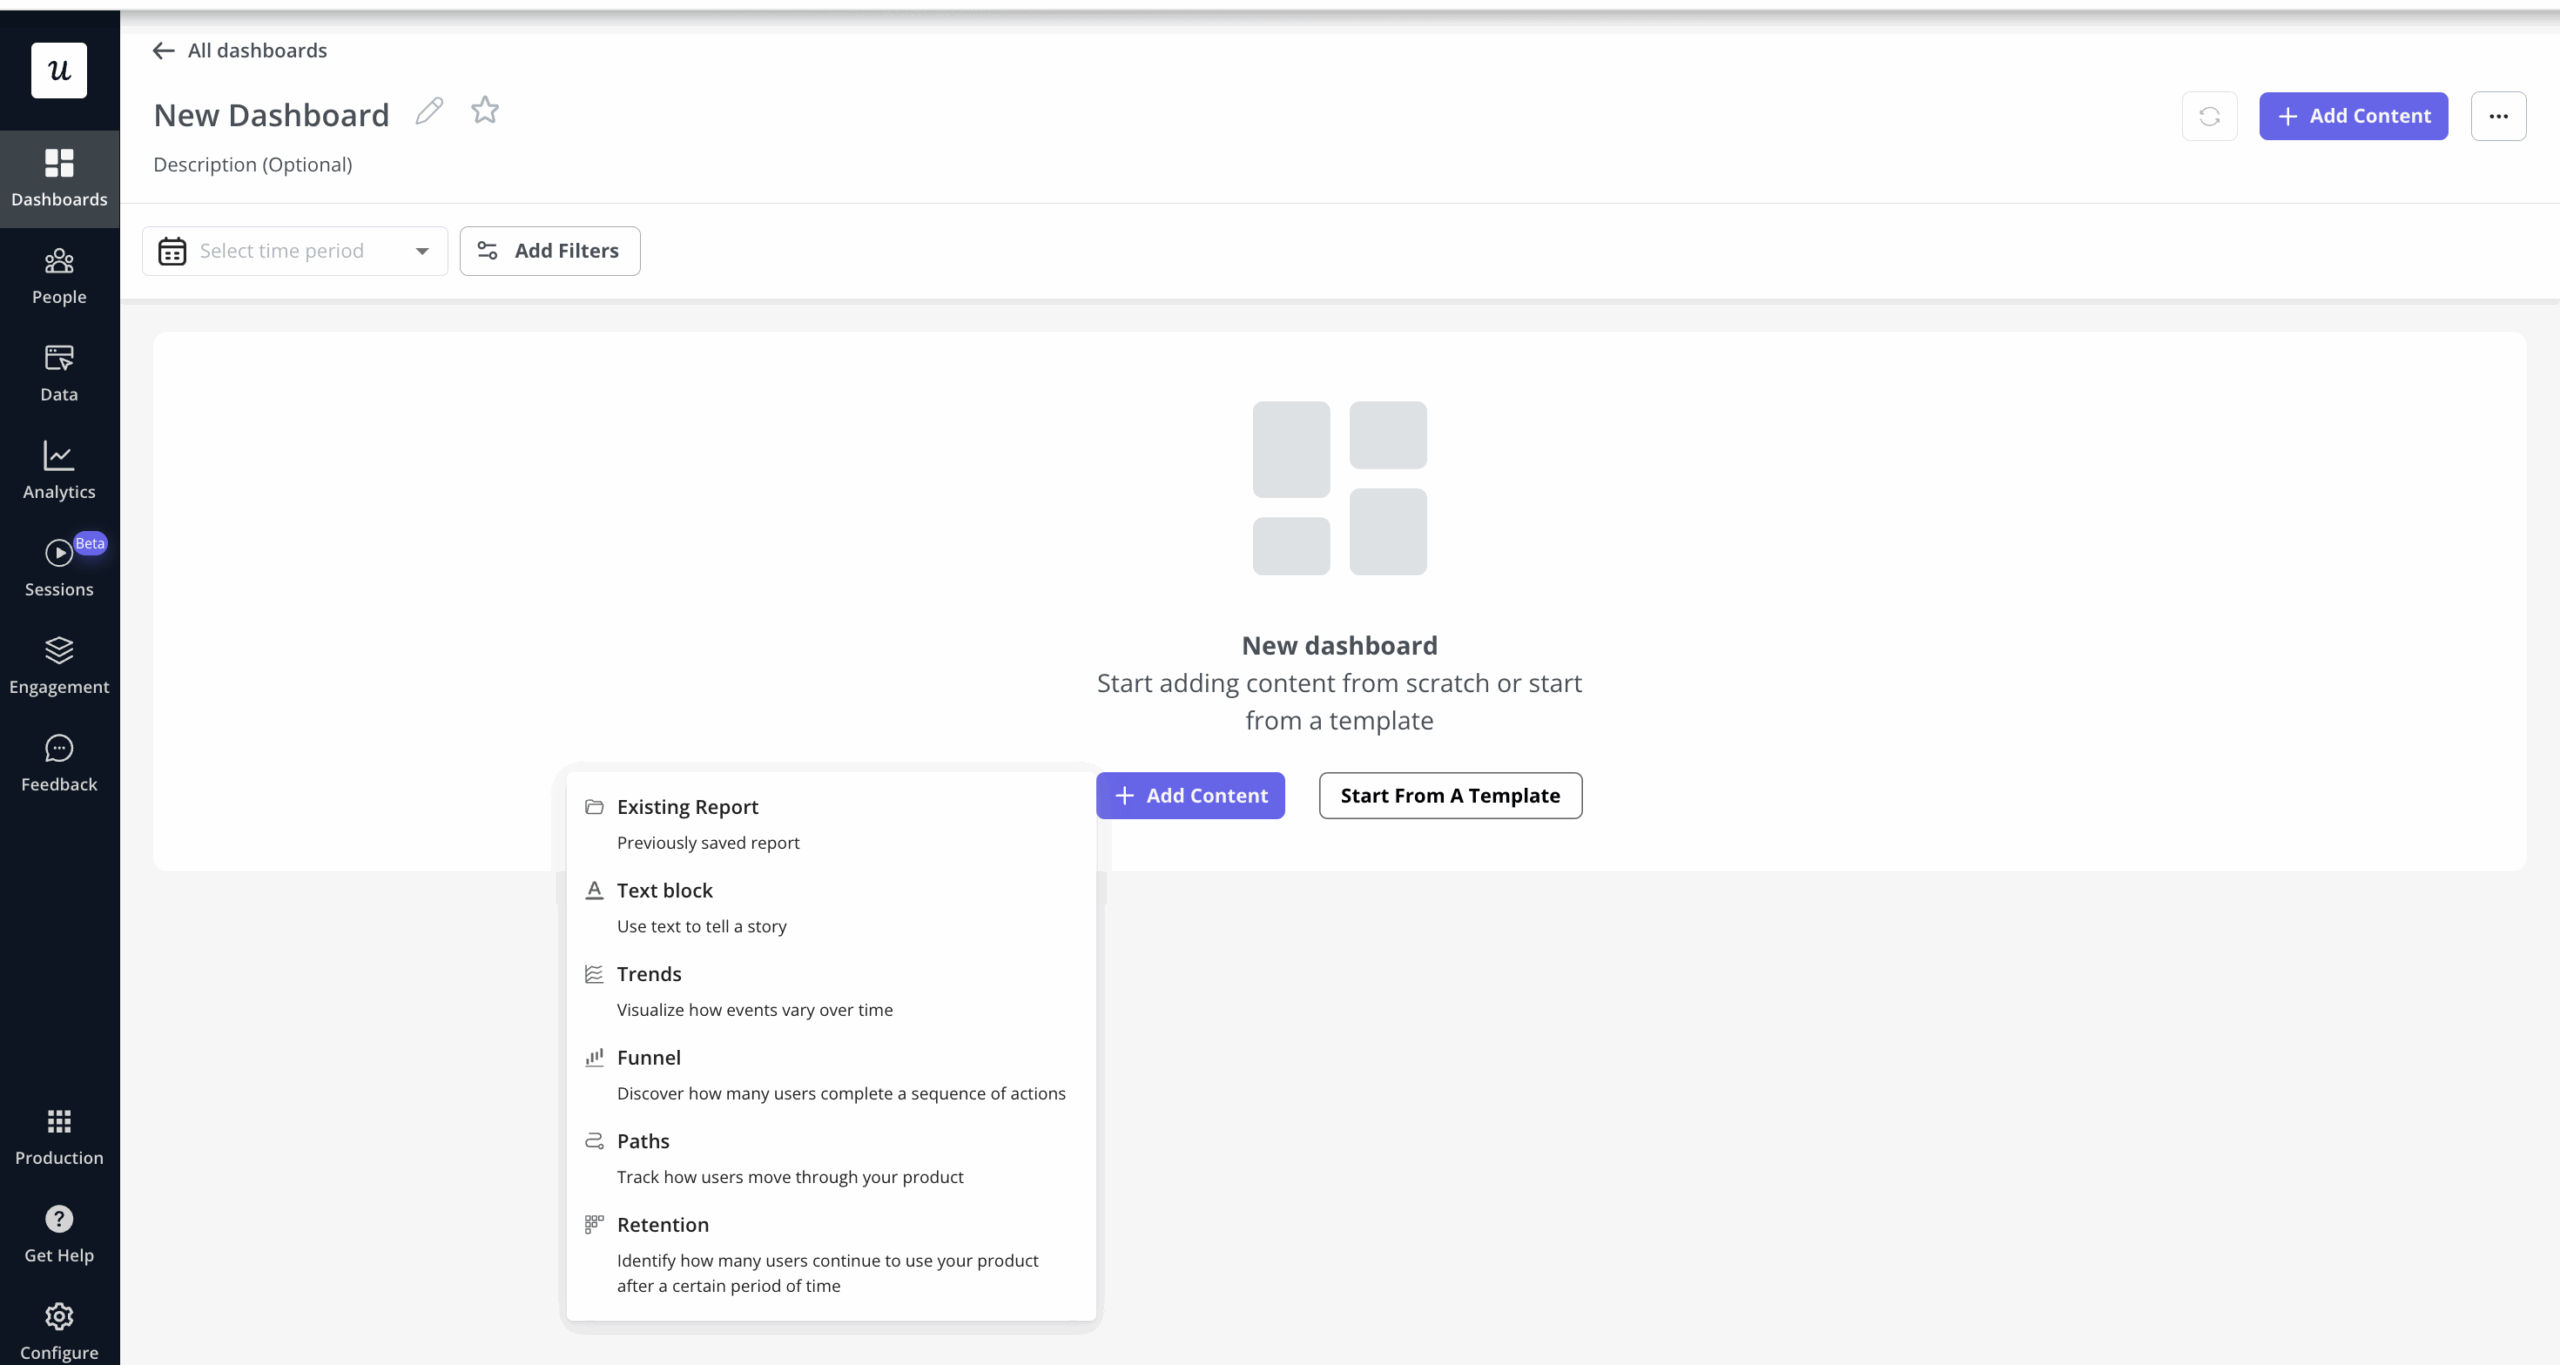
Userpilot is a product growth platform focused on driving user onboarding and feature adoption. Unlike other analytics tools, Userpilot also provides a 100% no-code solution for building in-app guides, interactive walkthroughs, tooltips, checklists, and surveys via a visual editor.
It’s best for product teams (even non-technical ones) that want an all-in-one platform to gather valuable insights and improve user engagement in-app.
Here’s how Userpilot compares with Contentsquare:
| Feature | Userpilot | Contentsquare |
|---|---|---|
| Primary use case | User onboarding and adoption. | Digital experience analytics for websites/apps. |
| Target users | SaaS product teams at mid-size companies and enterprises. | Enterprises and large digital teams (often in e-commerce or finance) requiring deep behavioral analytics. |
| Technical overhead | ✅ 100% no-code with quick implementation and a user-friendly interface. | ⚠️ No manual event tagging needed, but initial setup for complex SPAs or custom events may require technical work. |
| In-app engagement | ✅ Interactive walkthroughs, tooltips, modals, checklists, resource centers, and more.
✅ Omnichannel communication on web, mobile platforms, and email. ✅ In-app resource center for self-service support. ✅ Granular personalization via advanced segmentation. |
❌ No ability to create in-app guides or product tours (would require third-party tools). |
| Product analytics | ✅ Autocaptured events.
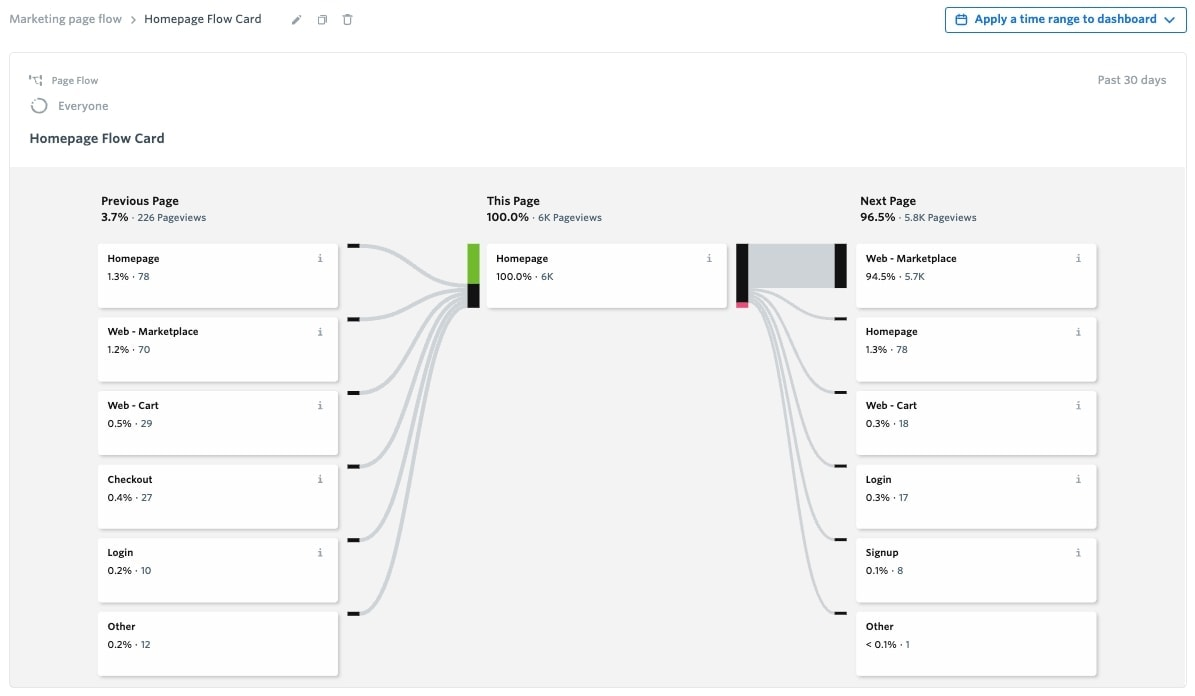
✅ Conversion funnel analysis, paths, trends, and retention reports to get insights into user behavior. ✅ Custom dashboards. ✅ Session replays. ✅ A/B testing for in-app experiences. |
✅ Captures all clicks, scrolls, and interactions retroactively without tagging.
✅ Deep dive reports to surface user drop-offs. Includes funnels, user journey maps, funnels, page comparators, and anomaly detections. ✅ Session replays and zone-based heatmaps with revenue attribution (e.g., revenue per click). ✅ Unique journey visualizations like the sunburst chart for discovering unexpected user paths. ❌No built-in A/B testing. It must integrate with testing tools. |
| Customer feedback | ✅ In-app surveys: Trigger NPS, CSAT, CES, or any custom question within your product (15+ templates provided)
✅ Feedback analytics: Responses are tied to user behavior and come with analytics for survey results. |
✅ Voice of Customer suite: You can run targeted on-site surveys, feedback widgets, and even conduct user tests, then correlate responses with behavioral data. |
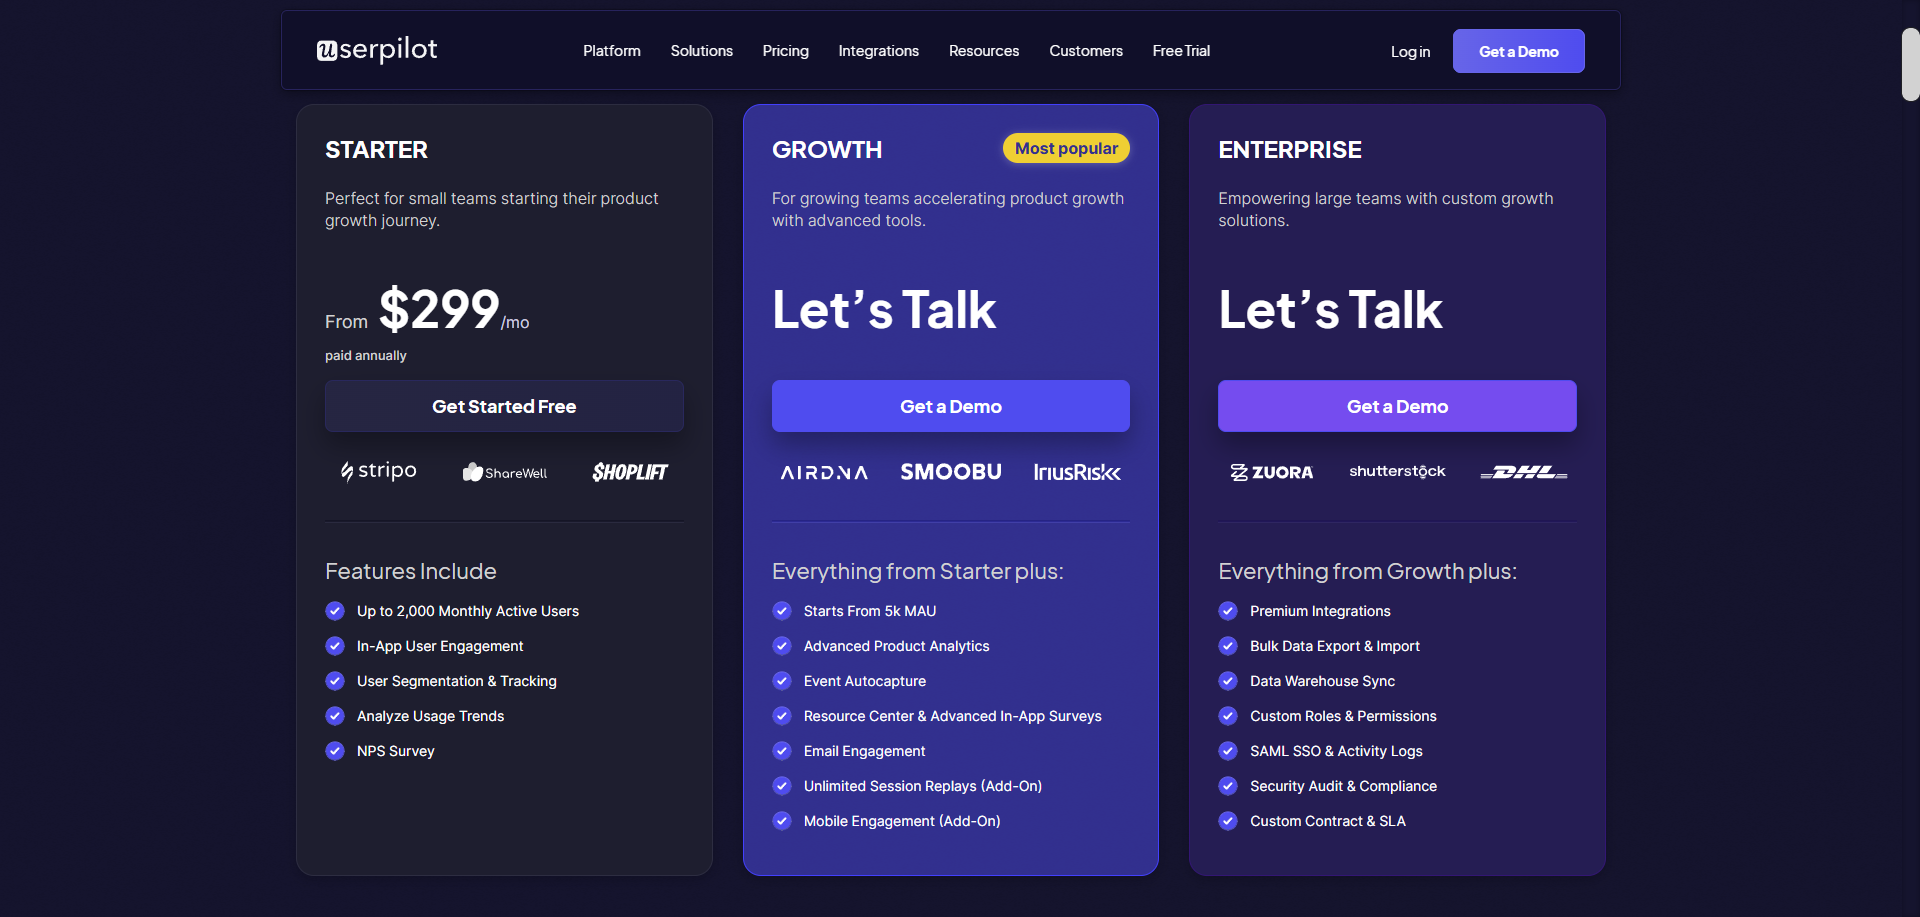
Userpilot’s pricing is more transparent and affordable than Contentsquare’s. Paid plans start at $299/month (billed annually) for up to 2,500 monthly active users. After that, the pricing is based on MAUs, which is more predictable than usage-based.
Choose Userpilot over Contentsquare if:
- You need an all-in-one platform: To analyze user behavior, collect user feedback, support users in-app, and help users adopt core features.
“I like that I can use Userpilot for 3 areas; guides (flows), analytics, and resource center. So I like that in that sense it is a complete solution. And I really like that I have now access to what my users are doing without needing to ask the engineering team.” – Leyre Iniguez, Customer Experience Lead.
- Your budget or team size is limited: Userpilot is far more cost-effective and easier to implement without professional services.
- You want to consolidate tools: Userpilot covers product analytics, in-app messaging, and user feedback in one platform. Many teams prefer this convenience over integrating Contentsquare (analytics-only) with separate onboarding and survey software.
![]()
Skip the Engineering Wait of Contentsquare Competitors with No-Code Solutions from Userpilot

2. Contentsquare vs Fullstory
Fullstory is a digital experience analytics platform that provides session replay, heatmaps, funnels, error tracking, and more. It helps product and engineering teams identify UX issues or performance problems with features like rage-click detection, console log recording, and real-time session search.
Comparison between Fullstory and Contentsquare:
| Feature | Fullstory | Contentsquare |
|---|---|---|
| Primary use case | Product experience analytics with a focus on session replays and UI/UX issue detection. | Digital experience analytics for websites/apps. |
| Target users | Larger product teams with UX analysts or engineers. | Enterprises and large digital teams (often in e-commerce or finance) requiring deep behavioral analytics. |
| Technical overhead | ✅ Easy setup and maintenance: One snippet gives full functionality, capturing the DOM and all events (even in SPAs) out of the box. | ⚠️ No manual event tagging needed, but initial setup for complex SPAs or custom events may require technical work. |
| In-app engagement | ❌ No in-app guides like on-screen tooltips or product tours. | ❌ No ability to create in-app guides or product tours (would require third-party tools). |
| Product analytics | ✅ Tracks all user events automatically and ties them to session replays.
✅ Offers funnels, conversions, retention, and user paths analyses. ✅ Technical session replays. Logs JavaScript errors, captures console logs, and even lets you search sessions by DOM events. ✅ Frustration signals (rage clicks, dead clicks, etc.) that help identify UX issues quickly. ❌ No built-in A/B testing. It must integrate with testing tools. |
✅ Captures all clicks, scrolls, and interactions retroactively without tagging.
✅ Deep dive reports to surface user drop-offs. Includes funnels, user journey maps, funnels, page comparators, and anomaly detections. ✅ Session replays and zone-based heatmaps with revenue attribution (e.g., revenue per click). ✅ Unique journey visualizations like the sunburst chart for discovering unexpected user paths. ❌ No built-in A/B testing. It must integrate with testing tools. |
| Customer feedback | ❌ Fullstory relies on integrations for surveys or NPS (e.g., Qualtrics, InMoment, etc.) It doesn’t collect user feedback natively. | ✅ Voice of Customer suite: You can run targeted on-site surveys, feedback widgets, and even conduct user tests, then correlate responses with behavioral data. |
Fullstory’s paid plans are custom and reportedly start around ~$9,600/year, with the median customer paying about $28,000/year according to Vendr data (They do offer a free plan with 30,000 sessions/month).
Choose Fullstory over Contentsquare if:
- You need a faster time-to-value and ease of use: Fullstory’s one-tag implementation and unified platform mean less engineering effort to keep event tracking working through site changes.
- Your team (especially developers or customer support teams) needs deep debugging capabilities alongside UX analytics: Fullstory records complete console logs, network requests, and Redux store changes, which is invaluable for troubleshooting user-reported issues and technical errors.
- You prefer more flexible pricing: Fullstory’s usage-based pricing can accommodate your needs (and you might negotiate volume discounts).
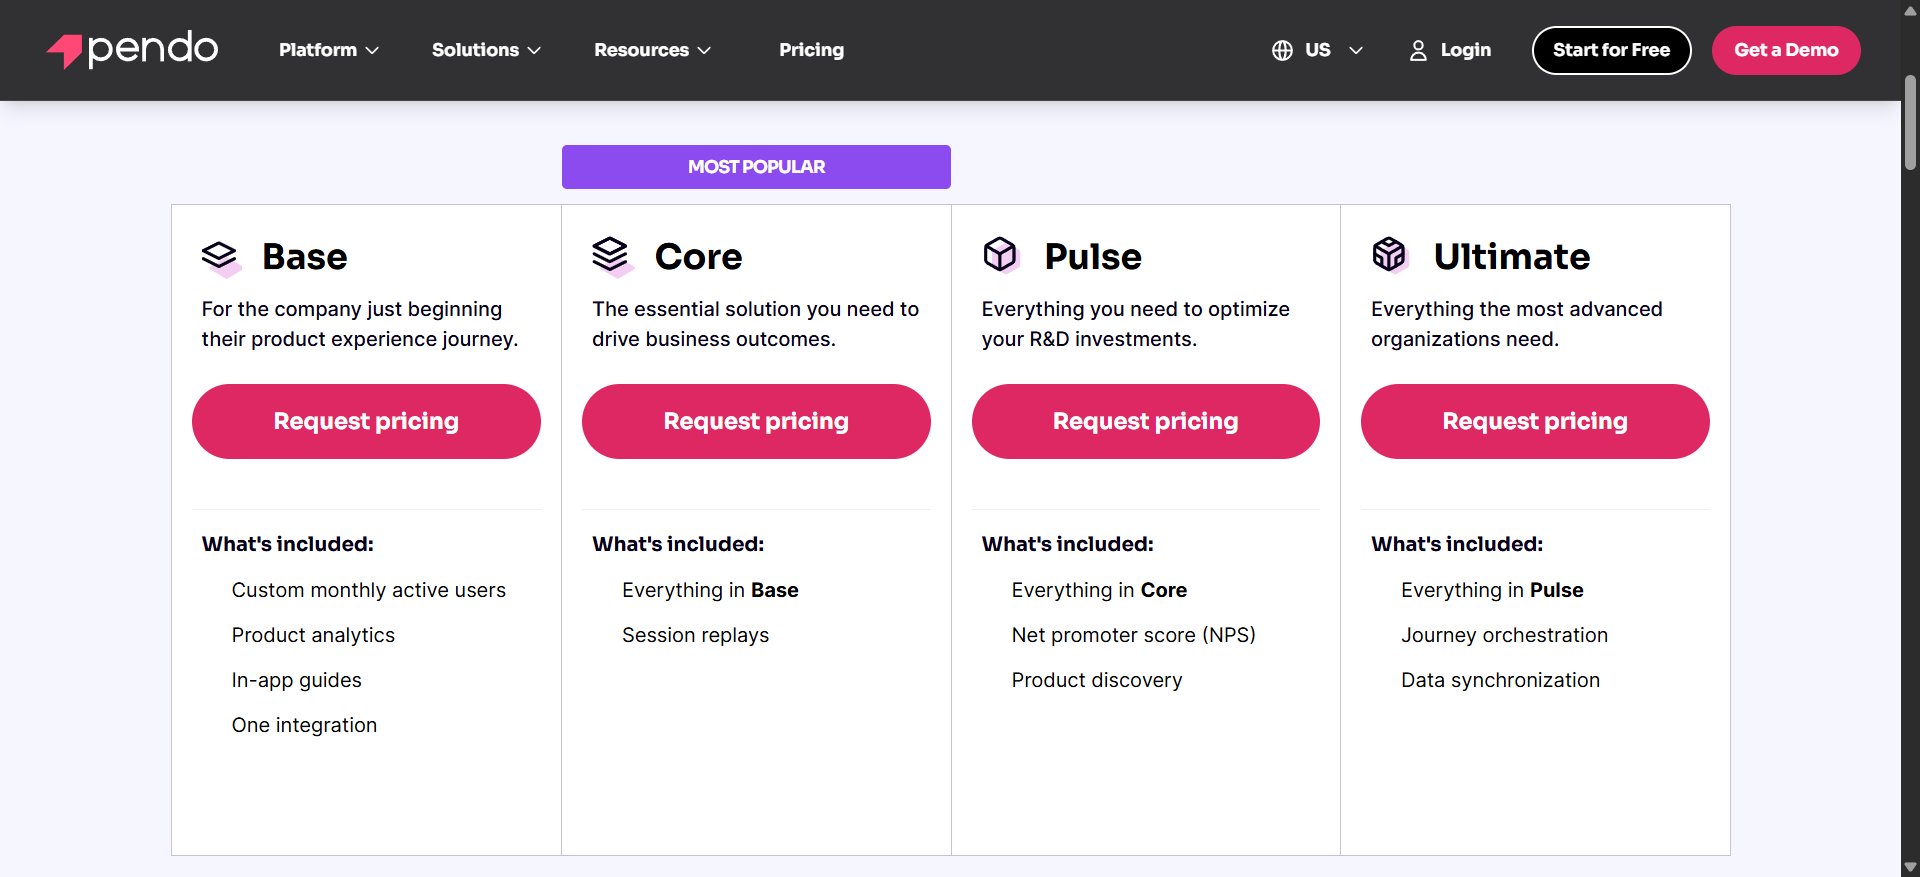
3. Contentsquare vs Pendo
Pendo is a product experience platform that uniquely blends product analytics with in-app guidance and user feedback. In contrast to Contentsquare, Pendo not only tracks usage (page views, clicks, feature adoption) but also enables businesses to create product tours, tooltips, banners, and polls to engage users directly.
Pendo is best for product teams who want to understand how users navigate their product and increase adoption via on-screen help.
How Pendo compares to Contentsquare:
| Feature | Pendo | Contentsquare |
|---|---|---|
| Primary use case | All-in-one product adoption and analytics platform. | Digital experience analytics for websites/apps. |
| Target users | Product managers at enterprise companies. | Enterprises and large digital teams (often in e-commerce or finance) requiring deep behavioral analytics. |
| Technical overhead | ⚠️ Pendo is generally easier than heavy enterprise tools, but you’ll need to define “features” or pages in the UI to track specific events. Also, Pendo has a steep learning curve. | ⚠️ No manual event tagging needed, but initial setup for complex SPAs or custom events may require technical work. |
| In-app engagement | ✅ You can create guided tours, tooltips, announcement banners, onboarding checklists, and an in-app resource center for self-help.
✅ Supports web and mobile app guides. |
❌ No ability to create in-app guides or product tours (would require third-party tools). |
| Product analytics | ✅ Standard product analytics features: funnels, click paths, retention cohorts, feature usage tracking, etc.
✅ Custom event tracking (through tagging or API) and has good dashboarding. ⚠️ Does not auto-capture every event. You must plan or tag the elements of interest. ✅ Session replays and heatmaps. ❌ No built-in A/B testing. It must integrate with testing tools. |
✅ Captures all clicks, scrolls, and interactions retroactively without tagging.
✅ Deep dive reports to surface user drop-offs. Includes funnels, user journey maps, funnels, page comparators, and anomaly detections. ✅ Session replays and zone-based heatmaps with revenue attribution (e.g., revenue per click). ✅ Unique journey visualizations like the sunburst chart for discovering unexpected user paths. ❌ No built-in A/B testing. It must integrate with testing tools. |
| Customer feedback | ✅ In-app polls and surveys (e.g., NPS prompts).
✅ Pendo Feedback for collecting feature requests/ideas from users. |
✅ Voice of Customer suite: You can run targeted on-site surveys, feedback widgets, and even conduct user tests, then correlate responses with behavioral data. |
Pendo’s pricing is opaque and expensive. They have a free tier (for up to ~500 monthly active users with limited features) and paid plans based on MAUs. According to Vendr data, the median Pendo customer pays around $48,000/year, and many smaller contracts start in the ~$12k–$18k/year range for basic packages.
Choose Pendo over Contentsquare if:
- You need a single platform for both analytics and user engagement.
- Your team also needs direct feedback for roadmapping to prioritize development.
- Your company is big enough to still afford the technical overhead and the cost of Pendo.
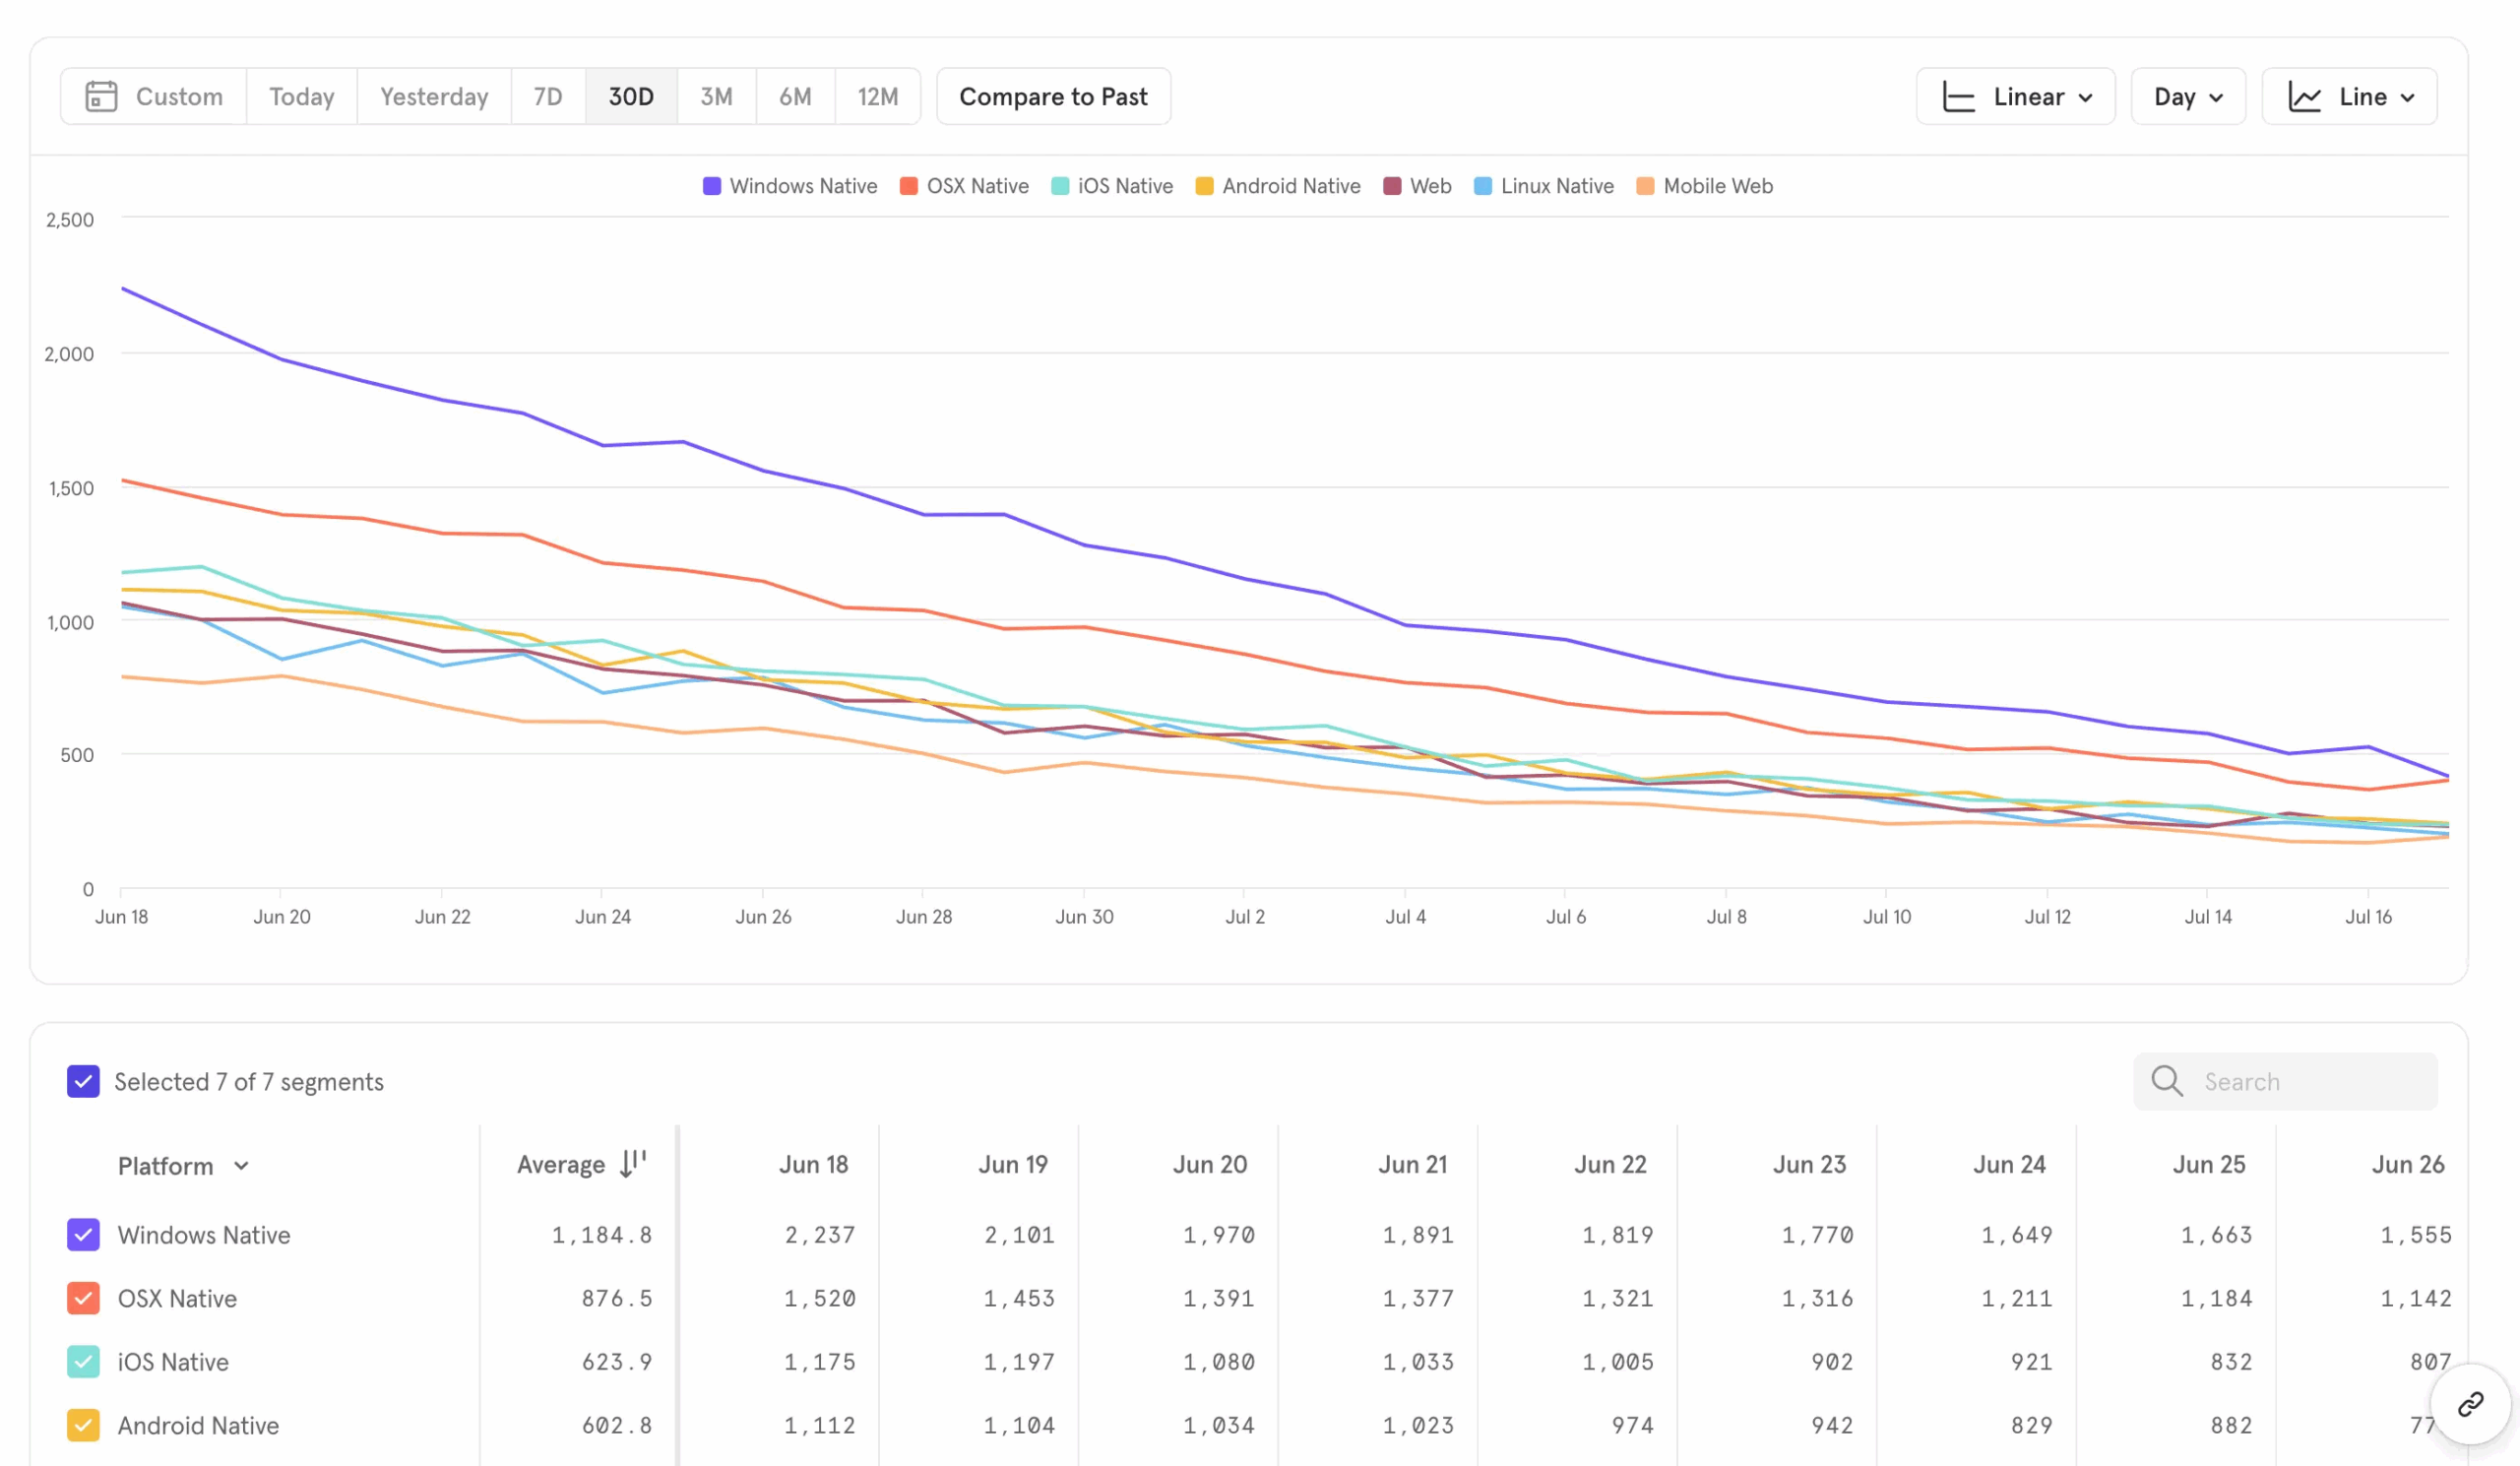
4. Contentsquare vs Mixpanel
Mixpanel is a leading quantitative product analytics tool. It focuses on tracking custom events and analyzing how users move through your product funnels.
It’s best for product teams who want to measure metrics like user engagement, conversion rates, feature adoption, and retention with a high degree of precision.
Mixpanel vs Contentsquare at a glance:
| Feature | Mixpanel | Contentsquare |
|---|---|---|
| Primary use case | Product usage analytics and conversion tracking. | Digital experience analytics for websites/apps. |
| Target users | Product managers and data analysts with a tracking plan. | Enterprises and large digital teams (often in e-commerce or finance) requiring deep behavioral analytics. |
| Technical overhead | ❌ Requires you to instrument events manually (via SDK or API). | ⚠️ No manual event tagging needed, but initial setup for complex SPAs or custom events may require technical work. |
| In-app engagement | ❌ Doesn’t provide in-app messaging or guides (it integrates with engagement tools, and their newer product “Elevate” is separate from analytics). | ❌ No ability to create in-app guides or product tours (would require third-party tools). |
| Product analytics | ✅ Autocapture.
✅ Insight reports, funnels, user flows, cohort analysis, retention reports, etc. ✅ You can filter by any user property or event property, do time comparisons, etc. ✅ Experimentation analysis (A/B test results) and allows custom SQL-like queries via JQL. ✅ Real-time data reporting. ✅ Session replay (web-only and not as full-featured as dedicated replay tools). |
✅ Captures all clicks, scrolls, and interactions retroactively without tagging.
✅ Deep dive reports to surface user drop-offs. Includes funnels, user journey maps, funnels, page comparators, and anomaly detections. ✅ Session replays and zone-based heatmaps with revenue attribution (e.g., revenue per click). ✅ Unique journey visualizations like the sunburst chart for discovering unexpected user paths. ❌ No built-in A/B testing. It must integrate with testing tools. |
| Customer feedback | ❌ No native feedback: Mixpanel doesn’t collect user feedback. You’d integrate a survey tool. | ✅ Voice of Customer suite: You can run targeted on-site surveys, feedback widgets, and even conduct user tests, then correlate responses with behavioral data. |
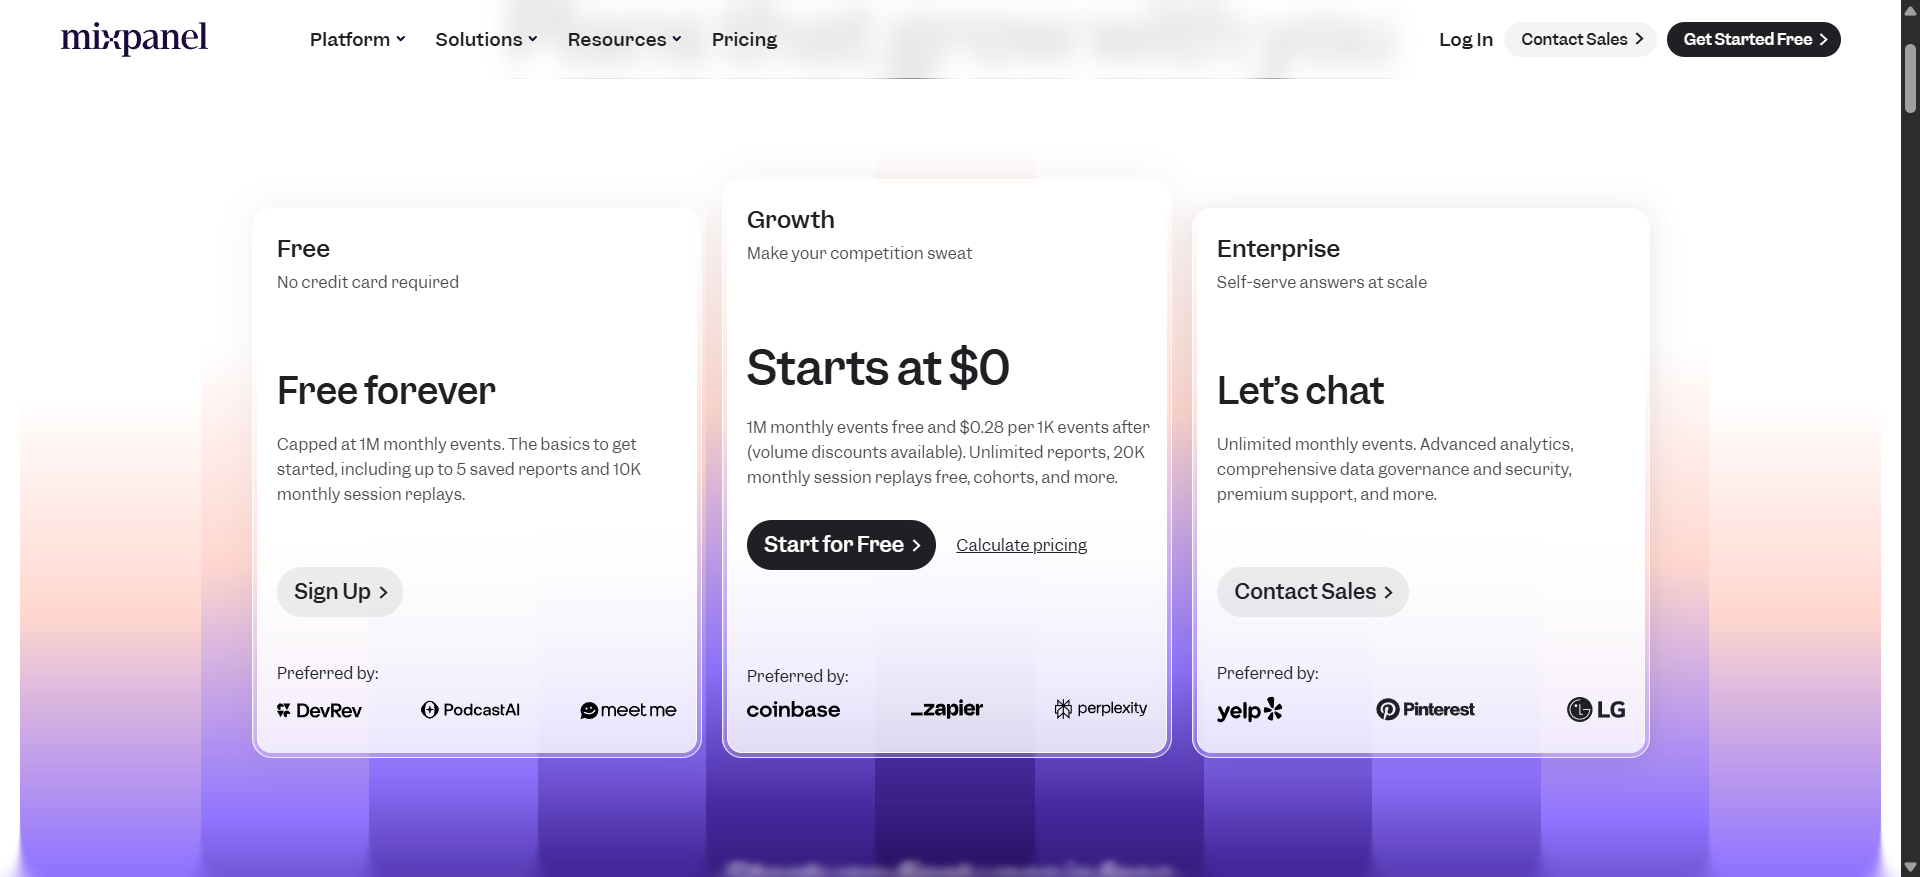
Mixpanel offers a free tier for up to 1M events per month with basic reporting. Beyond that, the Growth plan is usage-based: starting at $20/month for 1M extra events (if paid annually).
Choose Mixpanel over Contentsquare if:
- Your priority is granular, customizable product metrics and implementing a tracking plan.
- You don’t need the visual UX analytics and would rather use a more quantitative tool for tracking specific events.
- If you are a smaller company or even a larger one that doesn’t want to allocate a huge budget to experience analytics, Mixpanel is a cost-effective choice (just make sure to keep an eye on usage costs since it can scale aggressively).
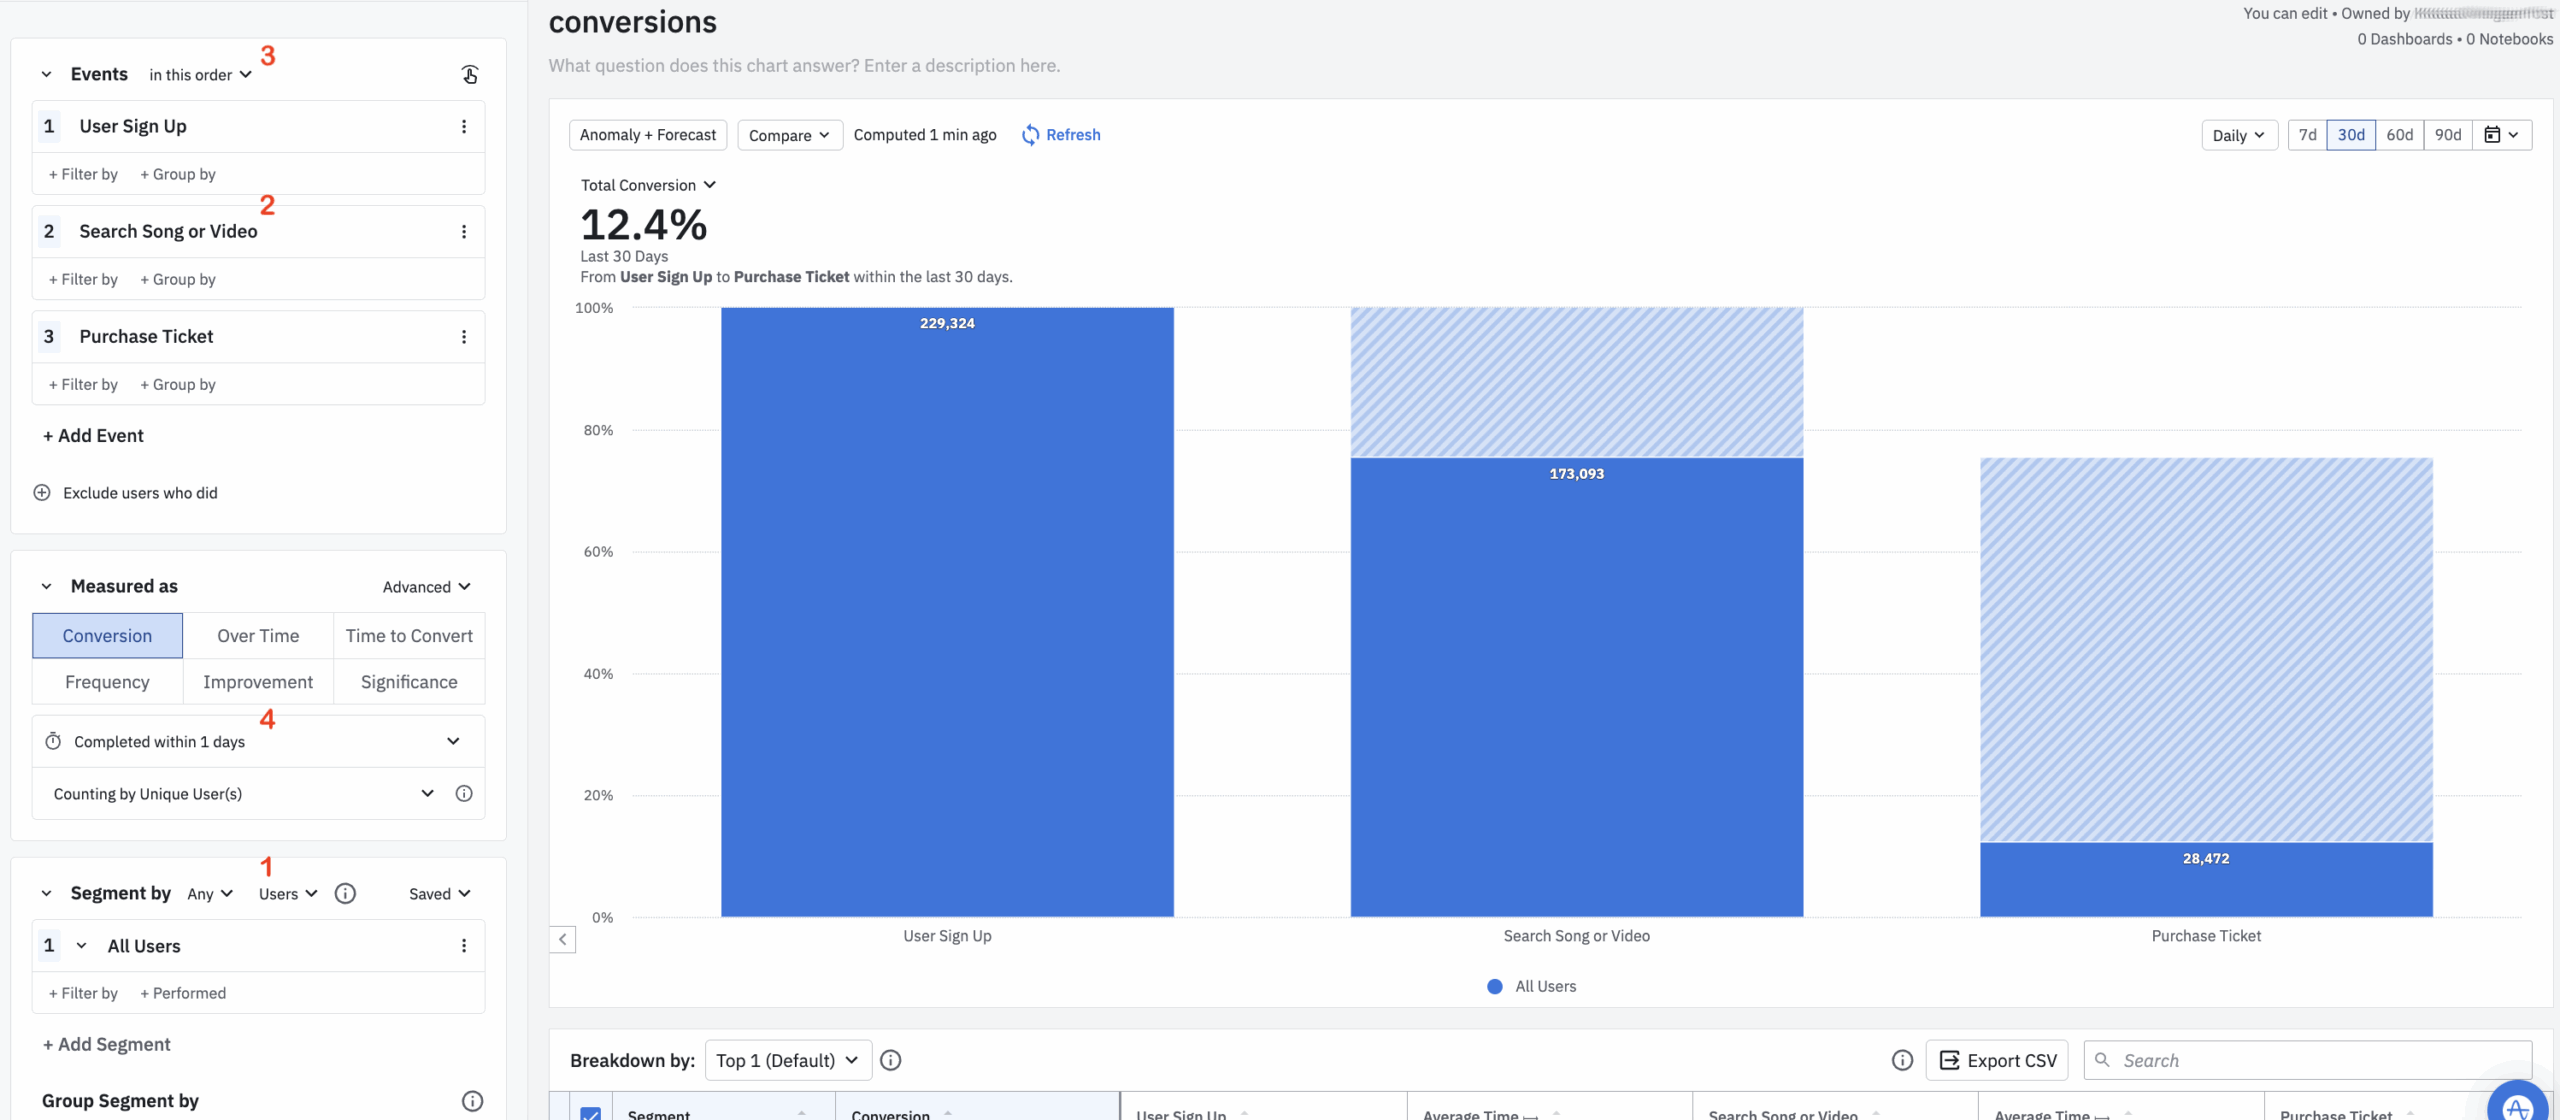
5. Contentsquare vs Amplitude
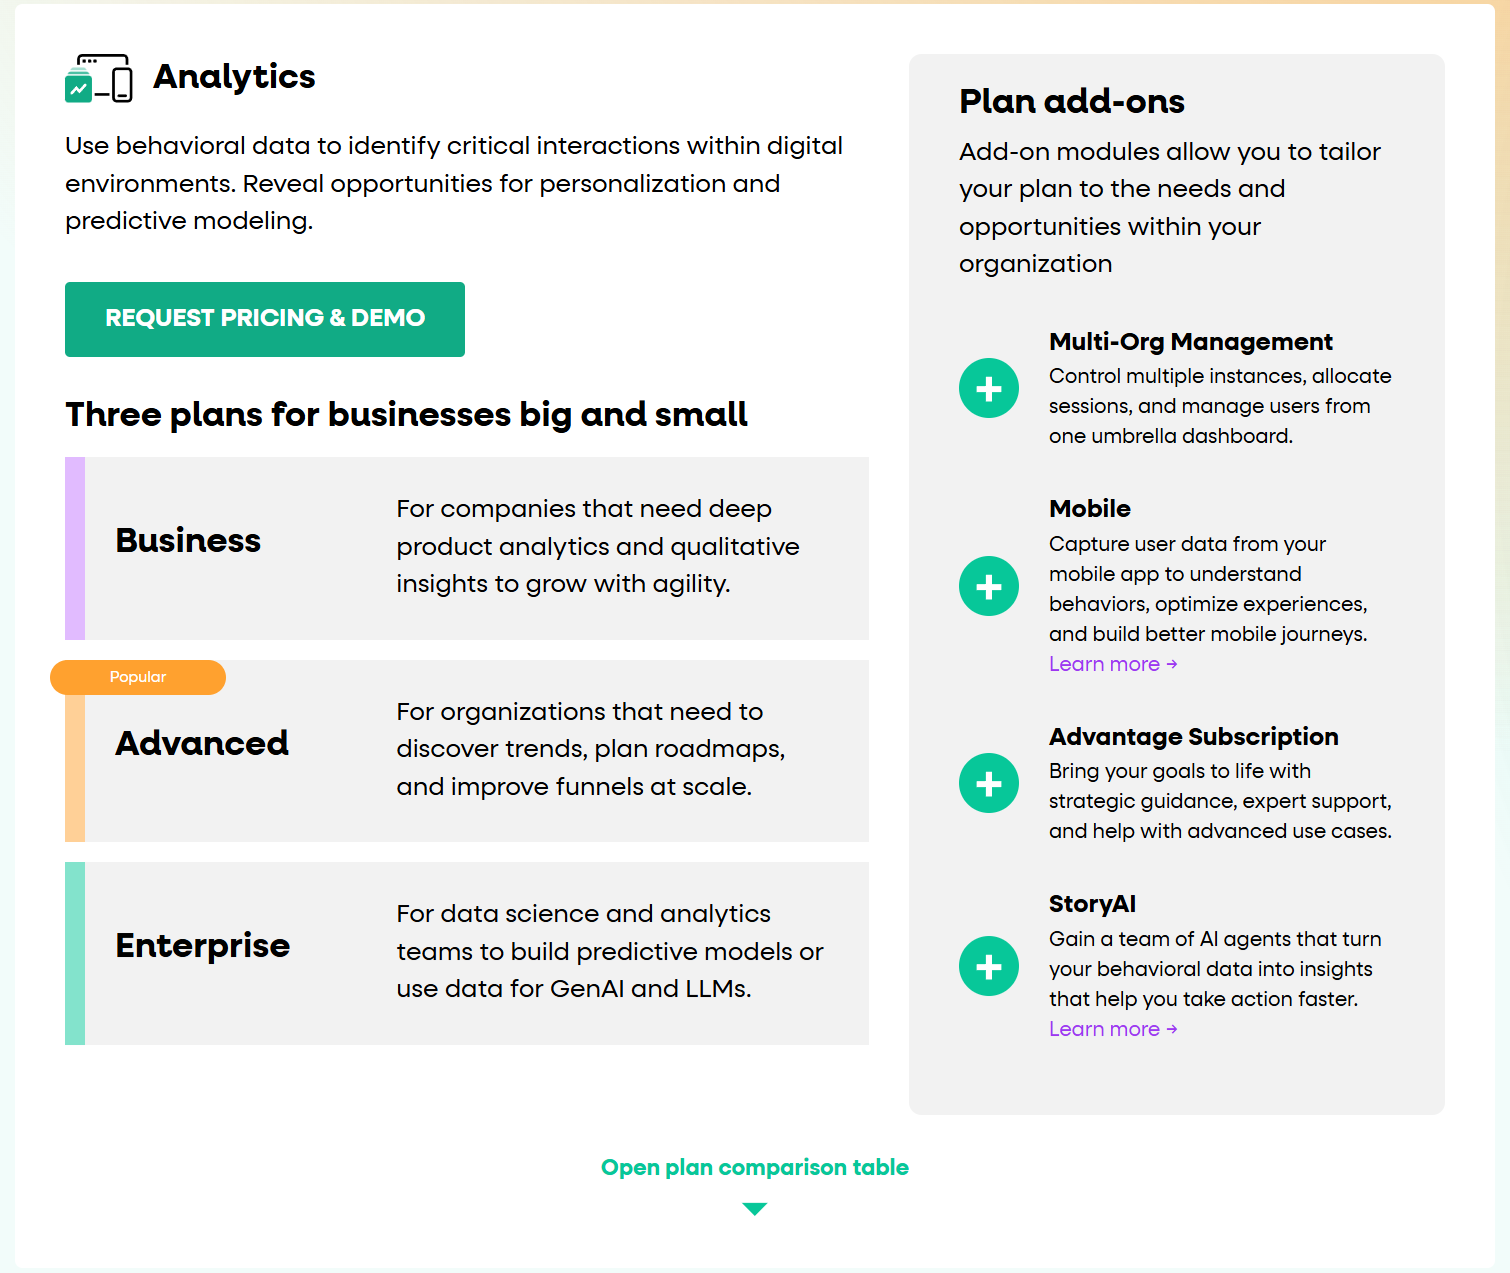
Amplitude is another top product analytics platform that has expanded beyond pure analytics to include features like A/B testing and even basic in-app personalization (via their Recommend product).
It’s best for data-driven organizations (including many enterprises) that want to centralize product data analysis and also conduct experiments with feature flagging in the same platform.
Comparing Amplitude and Contentsquare:
| Feature | Amplitude | Contentsquare |
|---|---|---|
| Primary use case | End-to-end product analytics and optimization. | Digital experience analytics for websites/apps. |
| Target users | Mid-sized to enterprise product teams (especially those with dedicated analysts or data engineers). | Enterprises and large digital teams (often in e-commerce or finance) requiring deep behavioral analytics. |
| Technical overhead | ❌ Amplitude typically involves instrumenting events. You’ll need to implement Amplitude’s SDK or API calls in your product for the actions you care about. Building complex queries or derived metrics in Amplitude requires training. | ⚠️ No manual event tagging needed, but initial setup for complex SPAs or custom events may require technical work. |
| In-app engagement | ⚠️ In-app targeting via the “Experiment” and personalization modules, but it’s not an engagement suite like Pendo. You can run feature flag tests (show variant A vs B) and personalize content to segments, but you cannot create walkthroughs or tooltips with Amplitude. | ❌ No ability to create in-app guides or product tours (would require third-party tools). |
| Product analytics | ✅ Autocapture
✅ Core analyses (funnels, retention, cohorts, user paths), plus advanced features like regression analysis, journey analysis, and AI-driven detailed insights (highlights interesting anomalies). ✅ Session replay and heatmaps for web. ✅ Experimentation platform to design A/B tests and feature flags directly. |
✅ Captures all clicks, scrolls, and interactions retroactively without tagging.
✅ Deep dive reports to surface user drop-offs. Includes funnels, user journey maps, funnels, page comparators, and anomaly detections. ✅ Session replays and zone-based heatmaps with revenue attribution (e.g., revenue per click). ✅ Unique journey visualizations like the sunburst chart for discovering unexpected user paths. ❌ No built-in A/B testing. It must integrate with testing tools. |
| Customer feedback | ❌ They recently launched “Amplitude Audiences,” which can ingest NPS or feedback scores to enrich user profiles, but you can’t create or deploy surveys from Amplitude. | ✅ Voice of Customer suite: You can run targeted on-site surveys, feedback widgets, and even conduct user tests, then correlate responses with behavioral data. |
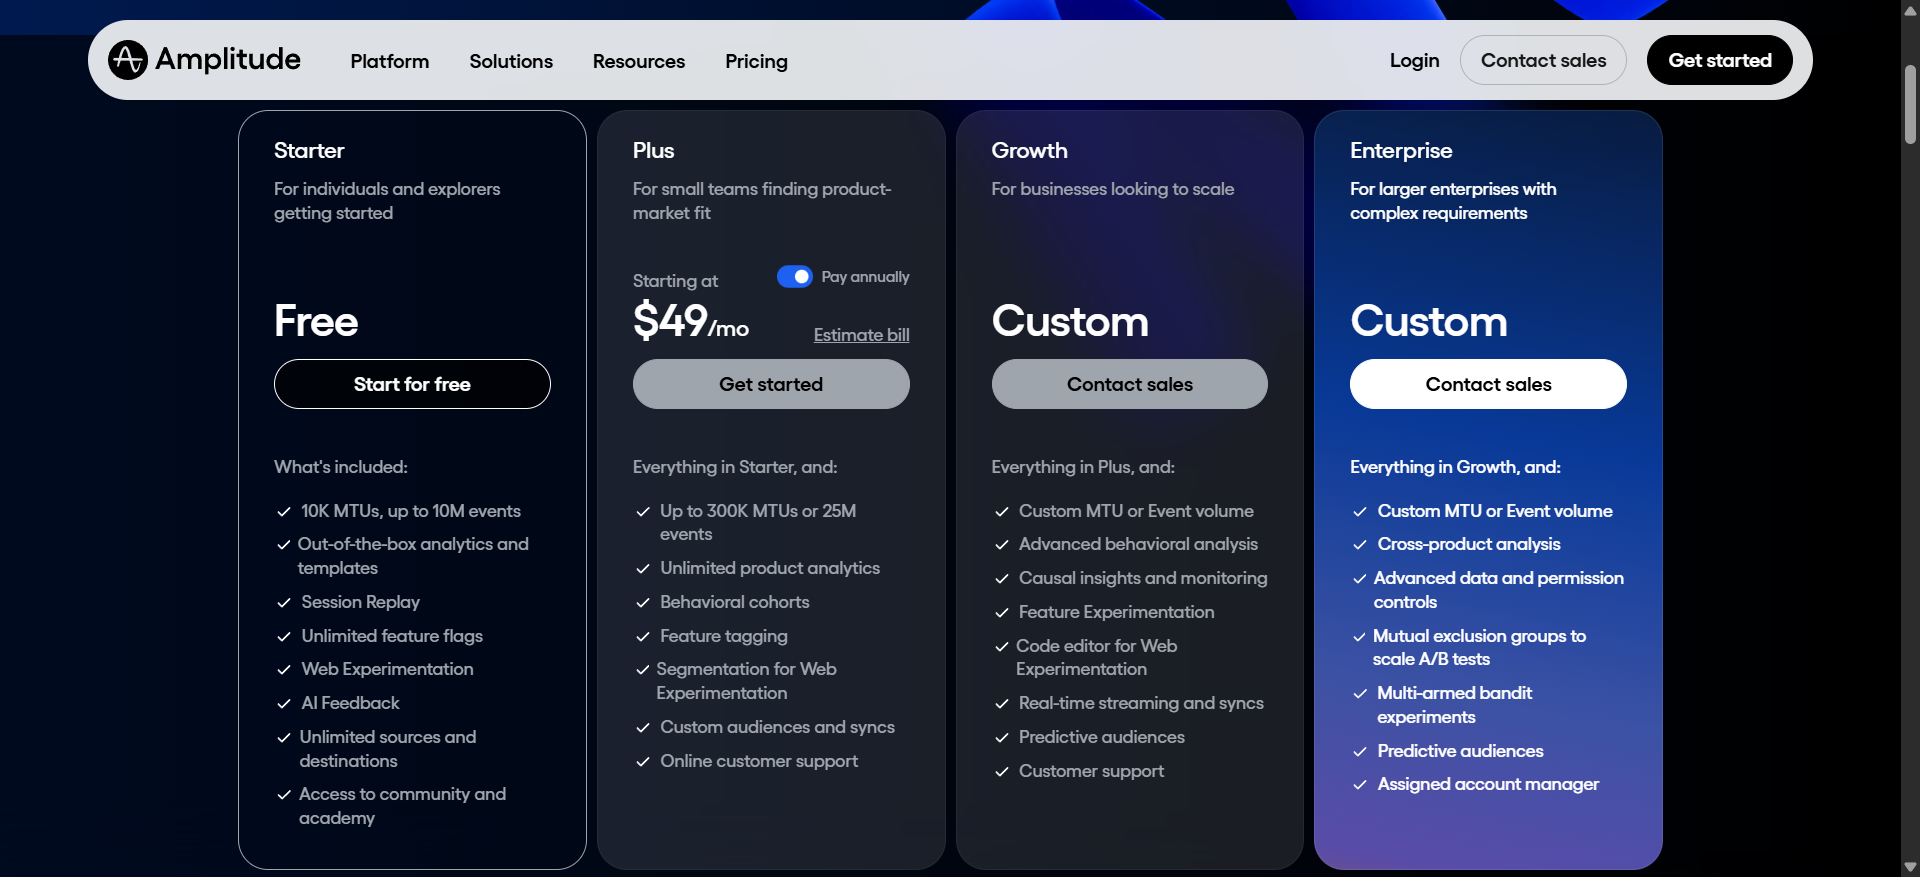
Amplitude has a Starter plan that’s free for up to 10,000 MTUs (Monthly Tracked Users). Beyond that, Amplitude’s “Plus” plan (their mid-tier) lists at $49/month for only 1,000 MTUs (scaling to around $3,000/year after 25k MTUs). For enterprise customers, Amplitude deals can range between $25k to $339k+ per year, with a median of around $64k/year.
Choose Amplitude over Contentsquare if:
- You want to integrate product analytics with feature experimentation.
- Data warehousing and BI integration are a priority in your analytics strategy. Amplitude has features for merging datasets, importing attribution data, and it’s often used alongside Snowflake/Redshift.
- Your focus is strictly on quantitative product questions and less on visual UX analysis. Amplitude’s analysis tools are generally richer for statistical insight (Amplitude has advanced cohort analysis, predictive modeling with personas, etc.).
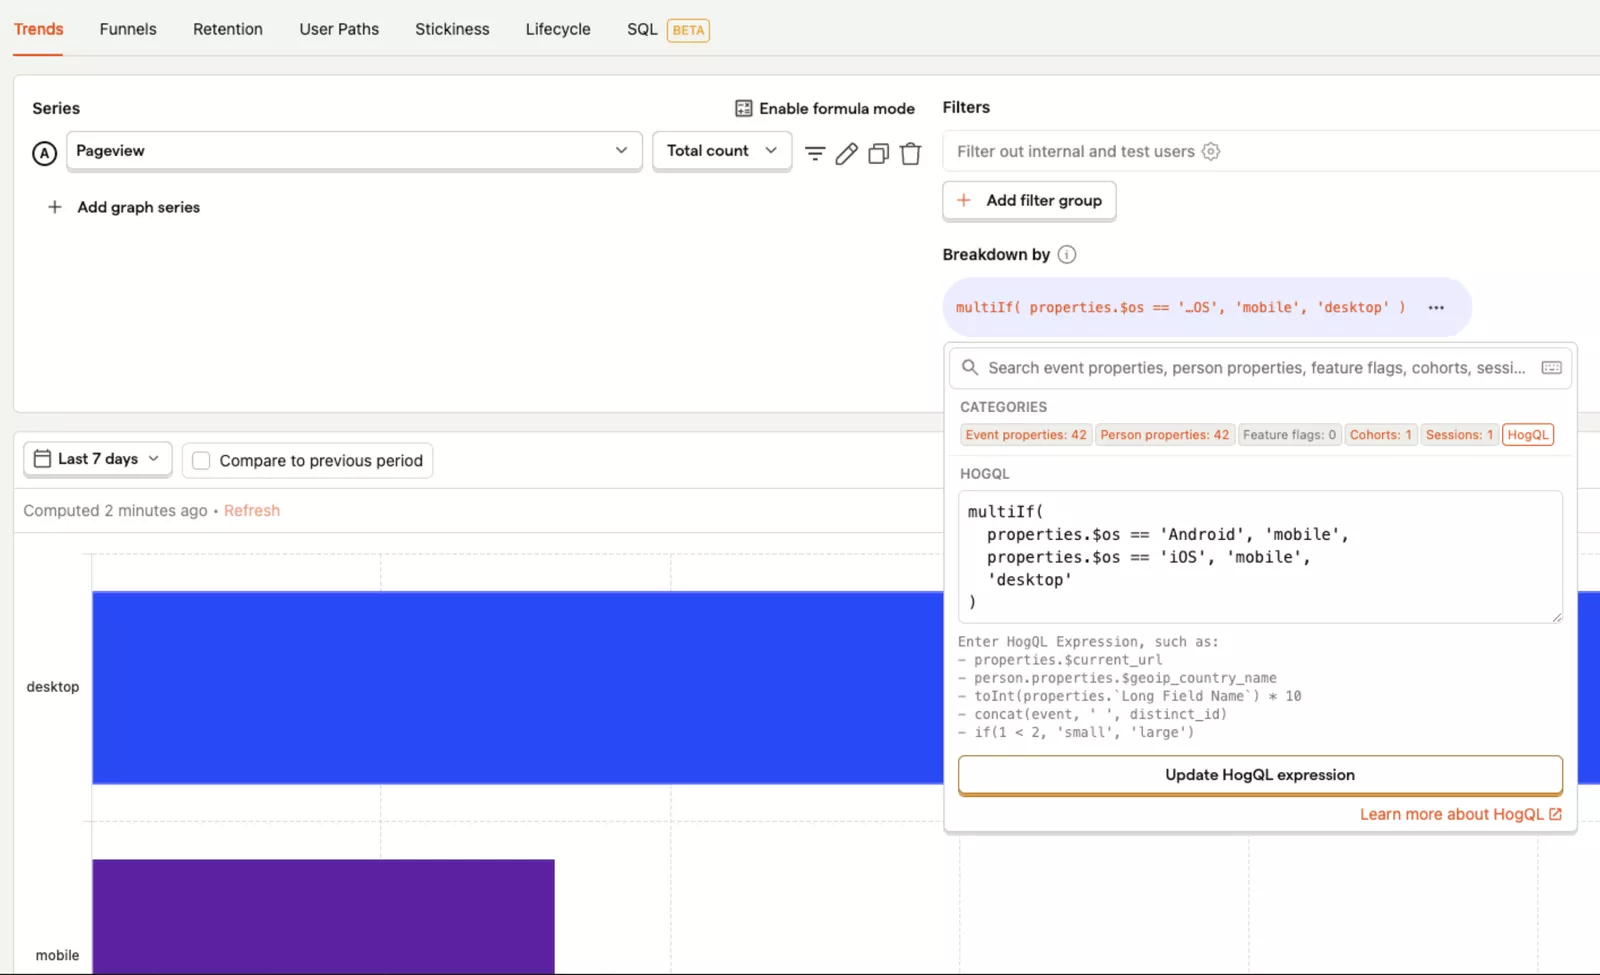
6. Contentsquare vs PostHog
PostHog is an open-source product analytics platform. It works as a flexible, developer-friendly alternative to traditional SaaS analytics. It offers event analytics, session recordings, feature flags/experimentation, and even basic in-app surveys.
It’s best for engineering or product teams that want full control of their analytics stack, complete visibility on multiple products, and to avoid high vendor costs.
PostHog vs Contentsquare:
| Feature | PostHog | Contentsquare |
|---|---|---|
| Primary use case | All-in-one open analytics suite. | Digital experience analytics for websites/apps. |
| Target users | Developers and product engineers at startups and mid-size companies (including many B2B SaaS). | Enterprises and large digital teams (often in e-commerce or finance) requiring deep behavioral analytics. |
| Technical overhead | ⚠️ Requires engineering to set up/maintain if self-hosted: PostHog can be deployed via Docker, Kubernetes, etc., and you’ll need to allocate DevOps resources for scaling, updates, and data storage if you go that route. | ⚠️ No manual event tagging needed, but initial setup for complex SPAs or custom events may require technical work. |
| In-app engagement | ❌ PostHog doesn’t have a built-in tool for creating in-app tours or tooltips. You’d need to integrate another tool for onboarding guides. | ❌ No ability to create in-app guides or product tours (would require third-party tools). |
| Product analytics | ✅ Event autocapture and custom events.
✅ Reports for funnels, path analysis, cohort retention, and feature usage. ✅ Event-based query language (similar to SQL) for advanced questions. ✅ Experimentation via A/B testing and feature flags. ✅ Session replays. |
✅ Captures all clicks, scrolls, and interactions retroactively without tagging.
✅ Deep dive reports to surface user drop-offs. Includes funnels, user journey maps, funnels, page comparators, and anomaly detections. ✅ Session replays and zone-based heatmaps with revenue attribution (e.g., revenue per click). ✅ Unique journey visualizations like the sunburst chart for discovering unexpected user paths. ❌ No built-in A/B testing. It must integrate with testing tools. |
| Customer feedback | ⚠️ PostHog has a “Surveys” feature where you can prompt users in-app and collect responses, but it’s relatively new and simple. Free tier allows 1,500 survey responses/month. | ✅ Voice of Customer suite: You can run targeted on-site surveys, feedback widgets, and even conduct user tests, then correlate responses with behavioral data. |
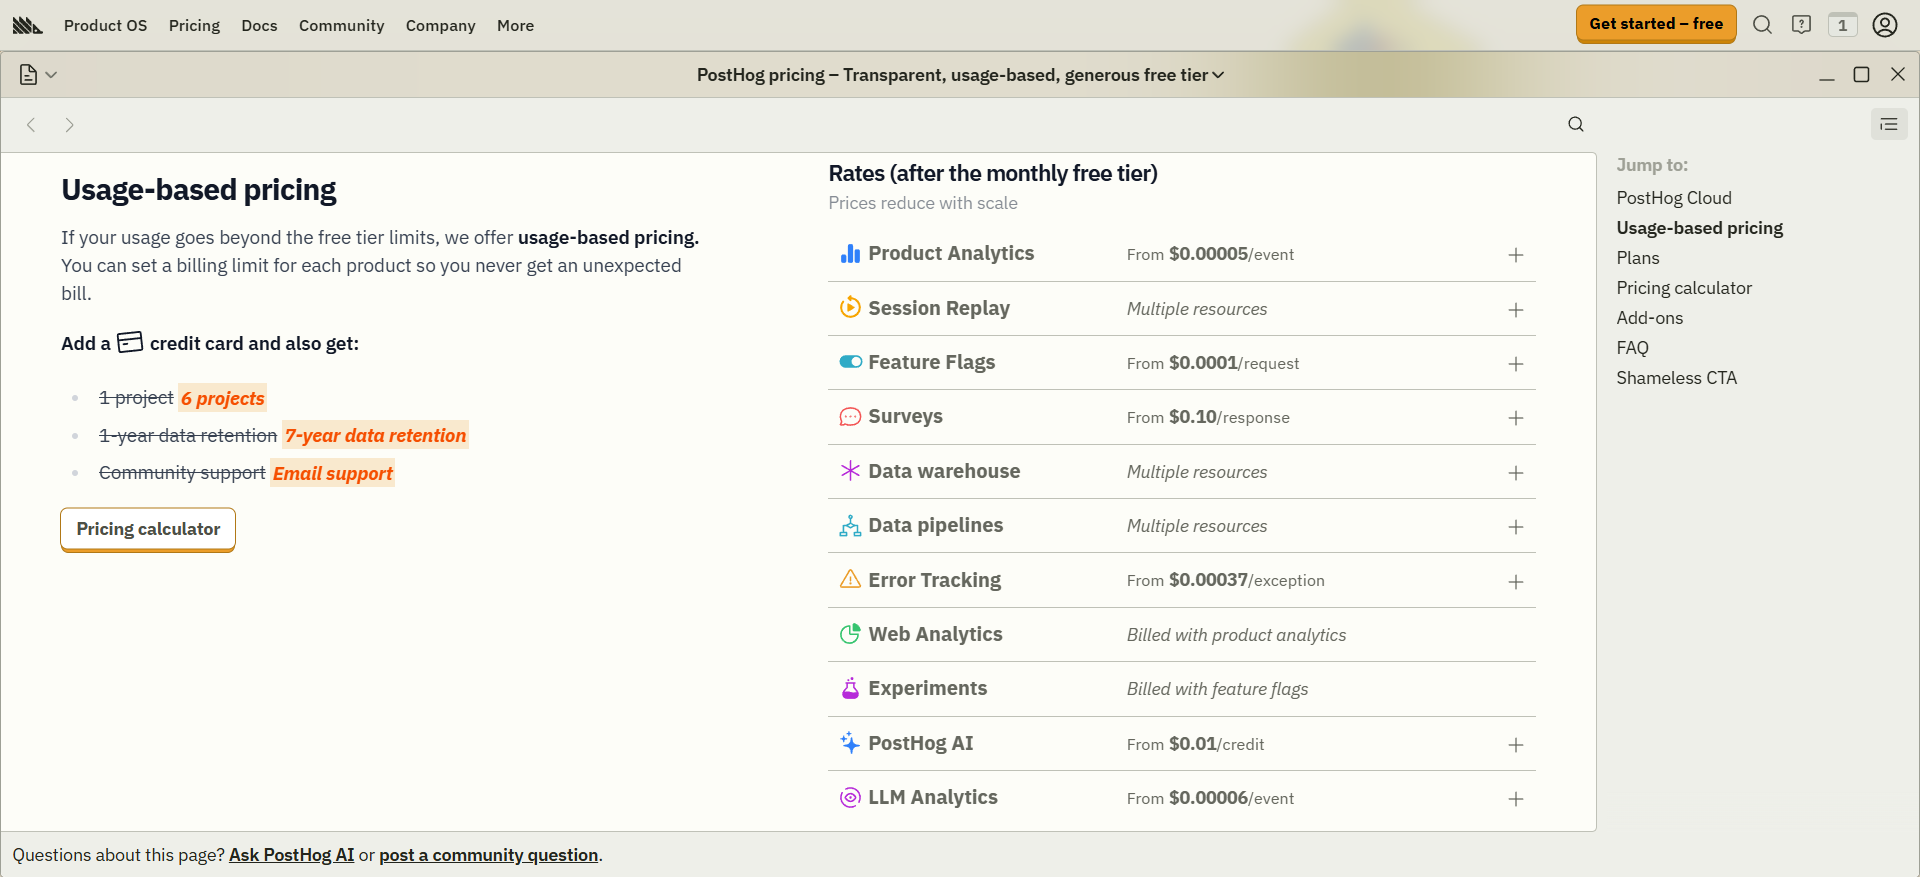
PostHog’s model is transparent. If self-hosting, the software is essentially free (open-source under the MIT License). You just pay for your infrastructure.
PostHog also offers a free cloud tier (up to 1 million events/month, 1k recordings/month). Beyond that, it follows a very cost-effective usage-based pricing (however, if you have extremely high volumes, costs can still rise too much).
Choose PostHog over Contentsquare if:
- Data ownership and privacy are top priorities. If you operate in an industry or region with strict data controls (finance, healthcare, EU with GDPR, etc.), being able to self-host all technical data is a requirement.
- You have a technical team that wants one flexible tool to cover many needs. For a startup with technical expertise, PostHog can replace 2-3 tools at once (analytics, session replay, and even feature flagging).
- Your budget allows for usage-based pricing.
Try Userpilot to optimize the customer experience!
Each of these Contentsquare competitors excels at different dimensions. The key is to match those strengths to your specific needs. Be it engaging users, fast analytics, deep research, data control, or app reliability.
In a growth-focused SaaS company, you must use valuable data to act fast. And with Userpilot’s all-in-one platform, your product team can address customer pain points without waiting on engineering.
If you fit this criteria, I highly recommend booking a Userpilot demo. It’s free, provides actionable insights faster, and doesn’t require any coding at all!
Userpilot strives to provide accurate information to help businesses determine the best solution for their particular needs. Due to the dynamic nature of the industry, the features offered by Userpilot and others often change over time. The statements made in this article are accurate to the best of Userpilot’s knowledge as of its publication/most recent update on December 28, 2025.
![]()
Get Better Value than Typical Contentsquare Competitors with Userpilot’s All-In-One Platform
About the author