AI for Data Analysis: Your Product’s New Co-Pilot


I’ve seen how AI for data analysis resets the pace of product analytics.
When releases stack up and dashboards multiply, you need clear answers from real usage, not another weekly readout. McKinsey’s The State of AI survey shows that 78% of organizations now use AI in at least one function (up from 55% in 2023), and 71% deploy generative AI regularly.
Use it to identify friction early, prioritize with evidence, and align teams on a single source of truth for business decisions. Below, I’ll show how to turn that momentum into a workflow you can run today.
What is AI in data analytics?
AI data analysis applies artificial intelligence and machine learning to turn raw data from multiple data sources into clear answers. Rather than wrestling with manual data cleaning and fragmented spreadsheets, you ask in natural language, and the system parses events, stitches sessions, and highlights what changed, where, and why.
For example, I type, “Show the common paths before activation over the last 30 days,” and get a concise view of top sequences, drop-offs, and outliers. From there, I compare segments, run light analysis, and decide what to test.
The same approach powers predictive analytics on complex datasets, so I can forecast adoption or spot churn risk early, using the same data analysis tools and AI tools my team already knows.
What is the main advantage of AI in data analysis?
The core advantage of AI data analysis is its ability to leverage data. It automates low-value work, surfaces insights faster, and enhances the quality of analysis across your analytics stack, enabling teams to move from “What happened?” to “What should we do next?” more quickly.
What’s your biggest challenge with data analysis right now?
How mature is your team’s use of product analytics tools?
What is your primary goal in improving your data analysis process?
Unlock Actionable Insights with AI Data Analysis
See how Userpilot can help you streamline your workflow and make data-driven decisions faster. Click below to get a personalized demo.
Increase efficiency and cut costs
Federal Reserve research shows GenAI users save about 5.4% of work hours, roughly 2.2 hours per 40-hour week, which compounds across sprints and teams.
I distinctly recall when obtaining even basic analysis meant frustrating delays, waiting for a data scientist. Now, AI tools cut manual work from hours to minutes, which lowers operational costs and lets us spend time on higher-value problems instead of repetitive tasks and time-consuming work.
AI automates cleaning, flags issues, and drafts summaries from natural-language queries with AI algorithms, so results arrive sooner and decisions rest on clearer evidence.
Generate valuable insights faster
AI processes large datasets quickly, delivering instant insights you can act on. You catch a new friction point as it appears, not after a sprint. That speed matters in data analytics because delays slow UX fixes and blur cause and effect.
I use AI data analysis to read behavior in plain English, surface outliers with light anomaly detection, and compare cohorts without hand-built queries. The workflow is simple: ask a focused question, review the top paths or drop-off step, and adjust copy or UI while the signal is still fresh so teams make informed decisions faster.
As part of our ongoing roadmap, Userpilot is expanding AI-assisted pattern surfacing, so product teams can move from change detection to decision-making faster, within the same platform they already use.
Learn more about our upcoming AI capabilities and join our beta program:
Democratize data access for all teams
These tools let anyone on the team query data and act on it, no code required. The result: more people contribute evidence, and experiments ship faster.
For example, a PM asks for the most common paths to activation, a designer checks which variant reduces drop-offs, and a marketer reviews which segments respond to a message, all inside the same data workspace.
Is AI affecting the data analyst role negatively?
No, AI tools are changing the data analysis workflow, but the AI data analyst who frames problems, validates outputs, and communicates impact is more valuable than ever.
Why the role is evolving (not disappearing):
- Analysts spend less time on data cleaning and more on designing metrics, QA, and experiment logic.
- Natural language interfaces broaden access; analysts curate questions, guard quality, and set guardrails.
- Models assist with predictive analytics, while humans test assumptions, check leakage, and assess risk.
How to use AI in data analysis?
Let me walk you through how we integrate AI into our data analysis process, making it a powerful tool from start to finish.
Streamline data collection and cleaning
Before any meaningful analysis can occur, we require clean data. AI is an immense asset here. It connects disparate data sources, standardizes raw data, and accelerates data preparation so teams can move faster with fewer handoffs.
Some might object that AI cannot perfectly clean messy inputs. That is fair. While it is not a silver bullet for flawed pipelines, AI data analysis does automate tasks that are tedious and error-prone: flagging outliers, handling missing values, and normalizing fields.
With natural language prompts, I can request checks like “find duplicate users created this week” and get a concise report I can verify. Also, machine learning algorithms score anomalies, reconcile schemas, and help unify unstructured text data from tickets or notes.
Uncover actionable insights and patterns
This is where the work pays off. Once the inputs are clean, AI data analysis helps data analytics identify patterns, correlations, and outliers with light anomaly detection, so you see what changed, where, and why. For product teams, that means granular behavior reads without pausing delivery.
Contrary to the idea that you need complex prompts, modern systems let you ask in natural language and analyze data on the spot.
For example, I’ll ask: “Show common paths before activation for new admins last month.” In seconds, I get focused charts, top sequences, and the drop-off step, then compare cohorts to validate the signal.
From there, I run targeted reads: funnels to size impact, paths to reveal unexpected routes, and segments to see which users respond. With predictive analytics on historical data, you can also estimate churn risk or forecast adoption without hand-built models or extra meetings.
As our platform evolves, Userpilot is expanding AI-assisted surfacing of paths, anomalies, and concise summaries inside product analytics.
Visualize data for better data understanding
AI-powered data visualization turns complex data structures into clear visuals you can use. After cleaning, I analyze and visualize data in one flow: copy a filtered table from Google Sheets into a generative AI tool’s workspace like ChatGPT, add a simple prompt (“make a line chart of weekly activations”), and get charts I can refine.
This speeds data exploration without switching programming languages or writing code.
Behind the scenes, artificial intelligence and light natural language processing interpret column names, pick chart types, and surface outliers, so the team sees stunning charts that actually explain behavior.
Anticipate future trends with predictive analytics
Beyond describing what happened, predictive analytics estimates what will happen next. Trained on historical data, machine learning models use machine learning algorithms to detect patterns that signal churn risk, upsell potential, or likely feature adoption. The payoff: faster calls with clearer evidence that improve business decisions.
I keep the setup simple: define the outcome, choose inputs, and let the model generate insights on leading indicators.
For instance, tools like Amplitude can score cohorts from big data streams, while lightweight workflows in Python or notebooks handle rapid tests without switching stacks.
When uncertainty is high, I compare model outputs with recent experiments to validate direction.
What are the best AI for data analysis?
You will find two main families of data analysis tools that solve this need.
1. Product analytics with AI (e.g., Userpilot, Amplitude, Mixpanel)
These platforms ingest events, model journeys, and add AI-powered analytics that enable users to analyze behavior in plain English.
In Userpilot, you work on your own data and get AI-assisted summaries, path hints, and focused data visualization that surface hidden insights from large volumes of events. It keeps governance intact and decisions consistent, inside the same workflow.
You can catch up with our latest AI release announcement here:

2. Pure AI assistants (e.g., ChatGPT, Gemini)
Paste a table from Google Sheets or connect a source. The system applies AI/ML (including selective deep learning and NLP) to generate insights, run quick checks, and perform sentiment analysis.
They’re strong for ad-hoc analysis, prototypes, and data visualization into stunning charts, faster than many traditional methods, but they may lack enterprise governance.
AI’s limitations and best practices for success
AI accelerates analysis, but results depend on setup, inputs, and review. To keep outcomes reliable, ground your workflow in three habits: data quality, privacy and security, and human oversight.
Let’s start with data quality.
Prioritize data quality above all
Start where errors begin.
Define event names and properties, list authoritative data sources, and document owners. Run routine data cleaning checks before each read: nulls, outliers, duplicate users, and unexpected value ranges.
Add freshness guards to ensure queries fail if feeds arrive late. Keep a living tracking plan that records schema changes and required types, then include small data preparation tests in CI to block breaking edits.
Use AI-powered assistants to flag drift and suggest fixes, but confirm with quick spot checks: compare distributions to the previous release and review five to ten sample records per key event.
Ensure robust data privacy and security
Data privacy and security are paramount, especially when handling sensitive user data. Any tool we integrate, and certainly Userpilot, must meet stringent standards: encryption in transit and at rest, access controls, and documented retention and deletion.
That includes clear policies on data usage, CSP guidance, and whether prompts or outputs feed artificial intelligence training.
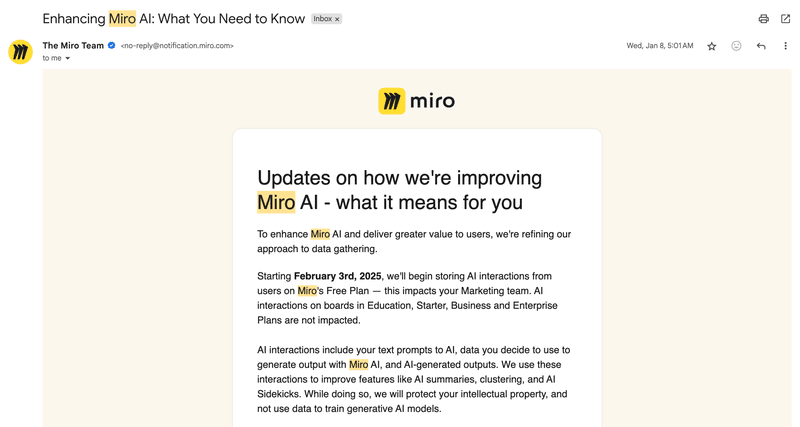
When we say data stays private, we specify how: redaction for text data, scoped roles, and audit logs. It is also standard SaaS practice to publish AI addenda, update terms frequently, and notify customers proactively; transparency builds trust.
This is a common practice for any tool that has AI as part of its feature, like Miro.
AI should augment, not replace, human insight
Artificial intelligence accelerates work, but outcomes still depend on human context. Despite broad adoption, over 80% of organizations report no measurable EBIT impact from GenAI, which shows that AI tools alone rarely change results.
Treat models as advisors: they surface options, enabling people to test assumptions, weigh trade-offs, and make data-driven decisions.
A pragmatic flow that keeps quality high:
- Let AI draft the readout, then validate against experiment results and support notes.
- Check edge cases and sampling, compare recent cohorts, and confirm the lift with simple counterfactuals.
- Record where AI summarized or suggested actions, and require human approval before rollout.
Empowering your data analysis with Userpilot AI!
At Userpilot, we build for speed and clarity in data analysis. Our platform brings product analytics and in-app experiences together, so teams work with their own data in one place.
Soon, with our AI-powered analytics, you get guided reads, focused data visualization, and practical suggestions that help users move from metric to change.
P.S. Want to experience AI-powered analytics firsthand? Join our beta program and be among the first to transform how you analyze and act on product data!
FAQ
Can I use ChatGPT for data analysis?
Yes, ChatGPT can analyze your data and answer in plain English. It is best for quick checks, prototypes, and data visualization.
How I do it in practice:
- Prepare the sample in Google Sheets (or CSV), remove PII so data stays private, and copy a filtered table.
- Paste into ChatGPT, add a simple prompt like “analyze weekly activations and outliers; create a bar chart.”
- Use follow-ups to refine: cohort splits, text clustering, or quick sentiment analysis on support snippets using light natural language processing.
- Ask for stunning charts and a short readout; save the prompt as a reusable template.
How to use AI in Excel for data analysis?
Yes, Excel supports data analysis with AI through built-in features and add-ons.
Here’s a clean, consistent flow:
- Prep own data: Format as a Table, run data cleaning in Power Query, and label columns clearly.
- Ask in plain English: Use Analyze Data or Copilot to generate insights, suggested PivotTables, and data visualization you can turn into charts.
- Refine into clear visuals: Insert PivotCharts, add slicers, and let Excel recommend stunning charts for trends and outliers.
- Model with Python in Excel: Run lightweight machine learning algorithms and simple machine learning models for forecasts, then chart the outputs.
- Automate the process: Save a template and add scripts for AI-driven automation; if required, ensure data stays private by keeping files local or in governed storage.
About the author