Drop-Off Rate: What Is It and How to Reduce It?


The drop-off rate is one of the key product metrics to track to improve the customer experience.
This article explains:
- What drop-off rate is.
- Why it’s important to measure it.
- How to calculate it.
- How to reduce it.
Let’s dive right in!
What is the drop-off rate?
The drop-off rate is the percentage of users who abandon a process or action before achieving a specific goal.
In the SaaS context, it could refer to the users who fail to book the demo on your website, convert to paying customers, or complete the onboarding process, just to name a few examples.
What is the difference between the drop-off rate and exit rate?
As mentioned, the drop-off rate refers to the users who don’t complete a specific process or flow within the application.
The exit rate, on the other hand, describes the percentage of users who finish using a product or navigating a website on that particular page or screen (after visiting more than one page or screen).
So if 1,000 users view an app screen and 300 of them stop using the product there, the exit rate for this screen would be 30%.
The importance of measuring drop-off rates
Measuring drop-off rates in SaaS products is important for several reasons, as it directly impacts user engagement, conversion rates, and ultimately, the revenue and success of the business.
Here are key reasons why tracking drop-off rates is crucial:
- Identify usability issues – a high drop-off rate in a specific part of a process, like a sign-up flow, can indicate usability problems, like complex navigation or low load speed.
- Evaluate onboarding processes – a lower drop-off rate during onboarding suggests that you efficiently help users experience the product value.
- Improve conversion rates – by analyzing where potential customers drop off during the conversion funnel, businesses can increase conversions.
- Enhance user experience – understanding drop-off points allows for the optimization of the overall user experience to increase user satisfaction.
How to calculate the drop-off rate?
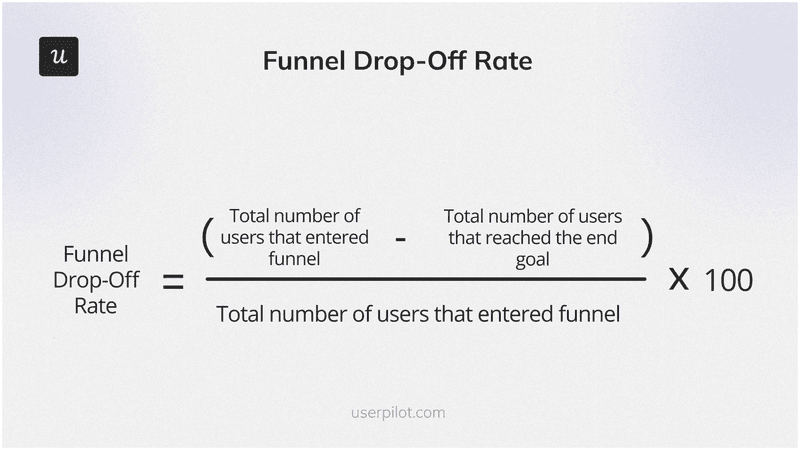
To calculate the drop-off rate, divide the number of users who didn’t complete a process by the number of users who started it, and multiply it by 100.
So if 200 users start your onboarding flow but only 78 finish it, the drop-off rate is 61% [(122/200) x 100%].
To be able to calculate it, you must have an analytics tool that allows you to track in-app events or page views accurately.
If so, why not get one that does all the calculations for you?
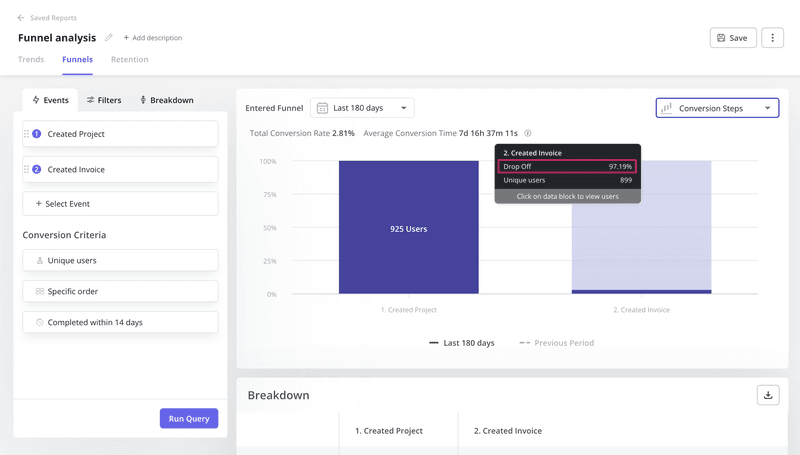
For example, in Userpilot you get the figure when you hover over a stage in the funnel chart.
To measure drop-off rates for your website, Google Analytics offers a similar capability, and for mobile apps – try Mixpanel or Amplitude.
What is a good drop-off rate?
To figure out what a good drop-off rate is it’s best to look at the the conversion rate benchmarks. After all, the two are opposites.
Here are a few:
- For websites, the average conversion rate for B2B SaaS businesses ranges from 0.9 and 2.3%.
- For an average SaaS business, a good free trial conversion rate is between 17%.
- An average freemium conversion rate is 1-10%.
- The average activation rate is in the region of 36%.
Mind you, though, that all of the rates depend on your product, industry, and niche. So instead of sweating over abstract figures, measure your current conversion/drop-off rates and focus on optimizing them.
How to reduce drop-off rates in your company?
With the theory out of the way, let’s look at a few ways to reduce the drop-off rates for your product.
Reduce the steps in the user journey
One of the reasons why users drop off is that the user journey consists of too many steps. For example, a complex checkout process may lead to fewer people completing the purchase.
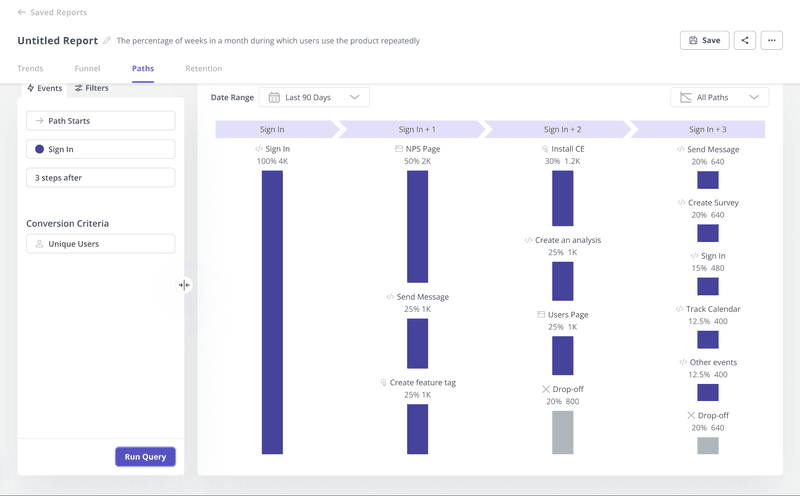
To determine if that’s the case, segment the users who drop off and conduct the path analysis. This will show you exactly what they do between conversion points.
At the same time, carry out another analysis for power users with similar use cases. That’s how you identify the happy path for this user persona.
All that is left is sending all users down the happy path with a well-designed onboarding flow that helps them replicate it.
Analyze product usage data thoroughly to identify drop-offs
Funnel and path analysis can show you where users drop off but not necessarily why. To find the root cause of drop-offs, you often need a more granular analysis of product usage.
Two useful tools for that are:
- Heatmaps – color-coded visualization of where on the page users click, hover, or type; they’re easy to interpret because the colder the color, the lower the engagement.
- Session replays – as the name suggests, recordings of every user action when using the product.
Provide support to lower drop-off rates
One of the reasons why users drop off is that they come across an issue, don’t know how to overcome it, and there’s no adequate support to assist them.
How can you support your users?
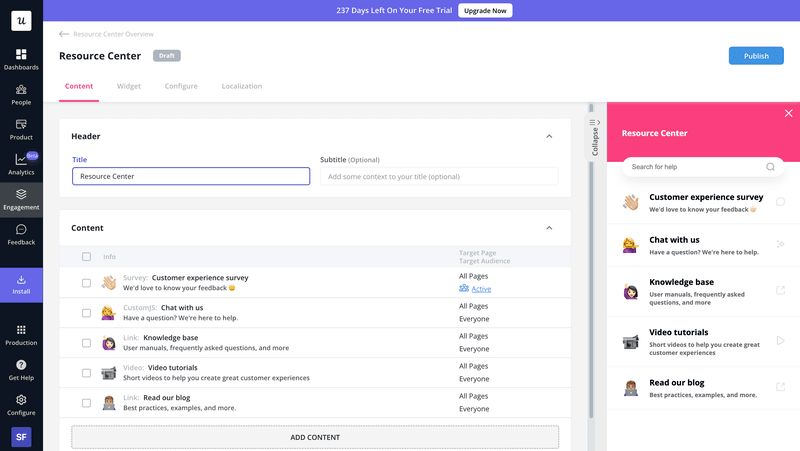
Apart from traditional high-touch methods like emails and phone calls to support agents, Userpilot allows you to provide in-app guidance with a resource center.
Such a center contains product documentation, how-to guides, and tutorials that users can use to deal with their pain points independently.
Another way to support users is with contextual in-app messages that guide users through a process.
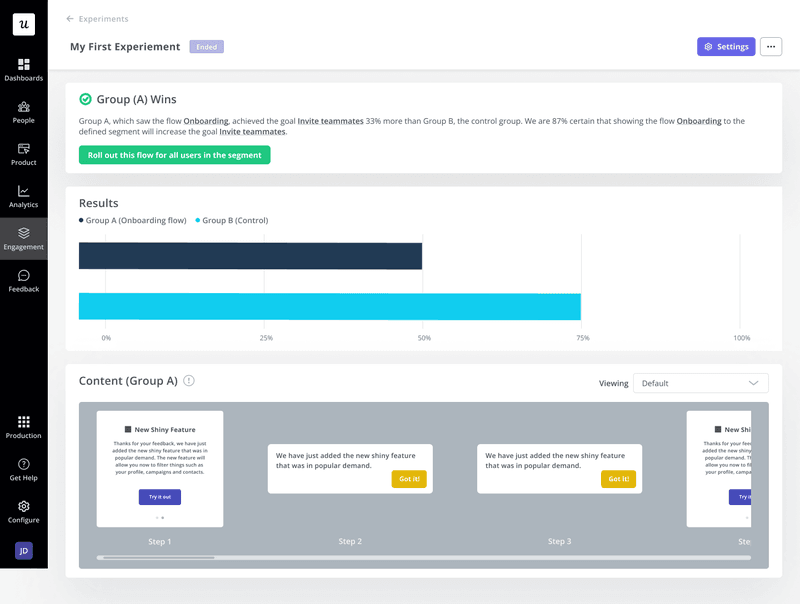
Conduct A/B testing to optimize the customer experience
Designing effective onboarding flows and in-app messages that lead to lower drop-off rates requires experimentation and iterative development.
A/B tests allow you to compare the performance of 2 different in-app experiences before rolling them out for all users.
To conduct them, you select a representative sample of users and divide it into 2 random groups. Next, you enable 1 in-app experience for each and measure which performs best.
Conclusion
A high drop-off may indicate that the user journey is too complex and users are experiencing excessive friction, which has a negative long-term impact on the product and business success.
To find out more about Userpilot and how it can help you reduce the drop-off rate, book the demo!
About the author