How To Conduct a Customer Attrition Analysis & Use It To Improve Retention?
Trying to reduce churn but don’t know where to start with customer attrition analysis?
Customer attrition takes place when customers leave your product or service. While it’s not possible for customer churn to be zero, you can always keep it at an acceptable level by adopting the right tactics.
Attrition analysis allows you to leverage the right tools and strategies to improve user engagement and satisfaction.
So let’s find out how to achieve this and boost customer retention.
Try Userpilot Now
See Why 1,000+ Teams Choose Userpilot

Summary of a customer attrition analysis
- Customer attrition occurs when customers stop doing business with you.
- Churn analysis is the process used to convert data into actionable insights that can be applied to churn reduction strategies.
- You should track and analyze churn data every month to respond quickly to changing rates.
- The 6 key customer churn metrics are customer retention rate, customer churn rate, Net Promoter Score, customer health score, customer satisfaction score, and customer engagement rate.
- To perform attrition analysis, track in-app user engagement, gather user feedback, segment customers based on engagement and satisfaction, send churn surveys, and get an analysis overview on the dashboard.
- To reduce churn, proactively reach out to high-risk customers, offer in-app self-service support, and run A/B tests for product optimization.
- Userpilot and Heap are the top two tools for customer attrition analysis.
Is your customer attrition analysis actionable?
Knowing your churn rate is just the start. You need to know who is leaving and why. Take this 4-step assessment to evaluate your customer attrition analysis strategy.
What is customer attrition?
Customer attrition is the loss of customers from your business. In SaaS, it’s more popularly known as customer churn and occurs when your product or service fails to offer continuous value to customers.
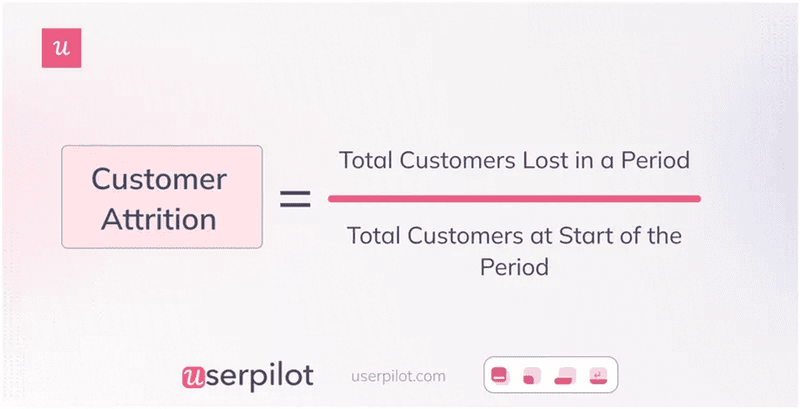
Mathematically speaking, customer attrition is the percentage of customers lost over a specific period. To calculate the customer churn rate, divide the number of customers who left in a given period by the number of customers present at the beginning of that period.
What is customer attrition analysis?
Customer churn analysis is the process used to leverage data to answer the four primary questions about churn:
- Which customers are leaving your product?
- Why are they churning?
- Which customers are likely to leave soon?
- What can you do to reduce churn?
For SaaS businesses, the churn rate shouldn’t exceed 5%-7%. However, flaws in your product or negligence toward changing customer needs can greatly disappoint customers and push churn up to even 20%.
Analyzing the data from churn analysis should give you actionable insights into the drivers of churn and how to minimize this. You can identify and remove friction points, enhance the customer experience, and optimize your product to address rising churn rates.
Customer churn analysis vs customer attrition analysis
So far, the article has used the words ‘churn’ and ‘attrition’ interchangeably because there’s no difference between customer churn analysis and customer attrition analysis. They are the same process with different names.
How often should you analyze churn?
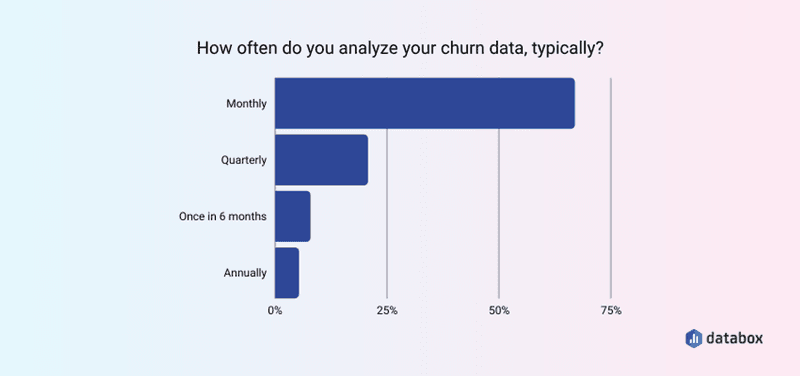
You should monitor and analyze churn data every month. This will make sure you don’t lose sight of any rise or fall in churn rates.
Therefore, you can avoid losing more customers by stepping in with solutions at the right time. You can also check the impact of any improvements to your product or customer service on the churn rates.
You can see from the graph below that about two-thirds of the businesses from the Databox survey said they perform customer attrition analysis monthly.
What metrics should you track for customer attrition analysis?
SaaS companies need to track a number of key metrics to ensure high product performance and customer satisfaction. Let’s briefly go over the six customer churn metrics that you should track regularly.
- Churn rate: This measures the percentage of customers who stop using your product within a given period. Monitoring the churn rate monthly helps you identify when to intervene with churn prevention strategies.
- Retention rate: This is the opposite of churn rate and measures the percentage of customers who renew their subscriptions. To calculate it, subtract the churn rate from 100%. Maintaining high retention rates is essential for subscription-based businesses.
- Customer health score: This metric predicts the likelihood of a customer churning or staying loyal. It helps you identify customers who are at risk of churning and address their issues proactively.
- Customer satisfaction score: This measures how satisfied customers are with specific experiences, such as using new features or resolving support tickets. Low satisfaction scores indicate that you need to investigate and fix issues to prevent churn.
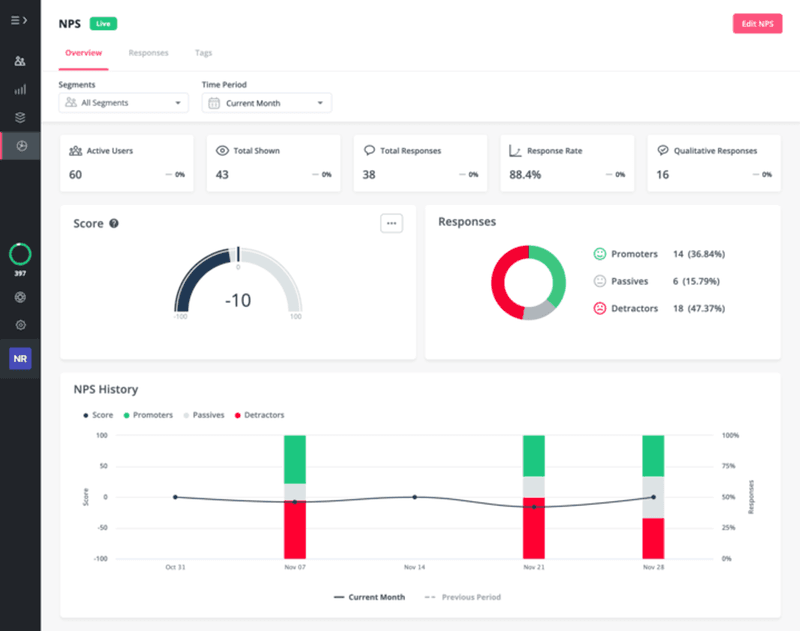
- Net Promoter Score: This measures customer satisfaction and loyalty by asking them to rate their likelihood of recommending your product. Detractors, customers who score 6 or below, are at high risk of churning. You can follow up with these customers to collect feedback and take action.
- Customer engagement rate: This measures how engaged your customers are with your product. High engagement rates indicate that customers frequently use core features, renew their subscriptions, and upgrade.
Customer attrition analytics process: How to do it right?
Because customer churn is induced by a multitude of factors, your attrition analytics process should be robust enough to reveal all unhappy customers and their sources of dissatisfaction.
Here’s what you can do to get the process right.
Track in-app user engagement and identify behavioral patterns
Predictive churn analytics is critical to identifying customers at risk of churn. And one of the most effective ways of gathering relevant and accurate data is by using feature tagging.
Feature tagging helps you understand the effect of your in-app onboarding flows on your product growth goals.
You can track in-app customer engagement with different features and find trends in user behavior. It not only helps you know how customers use and interact with each of these features but also uncovers features that users are struggling with the most.
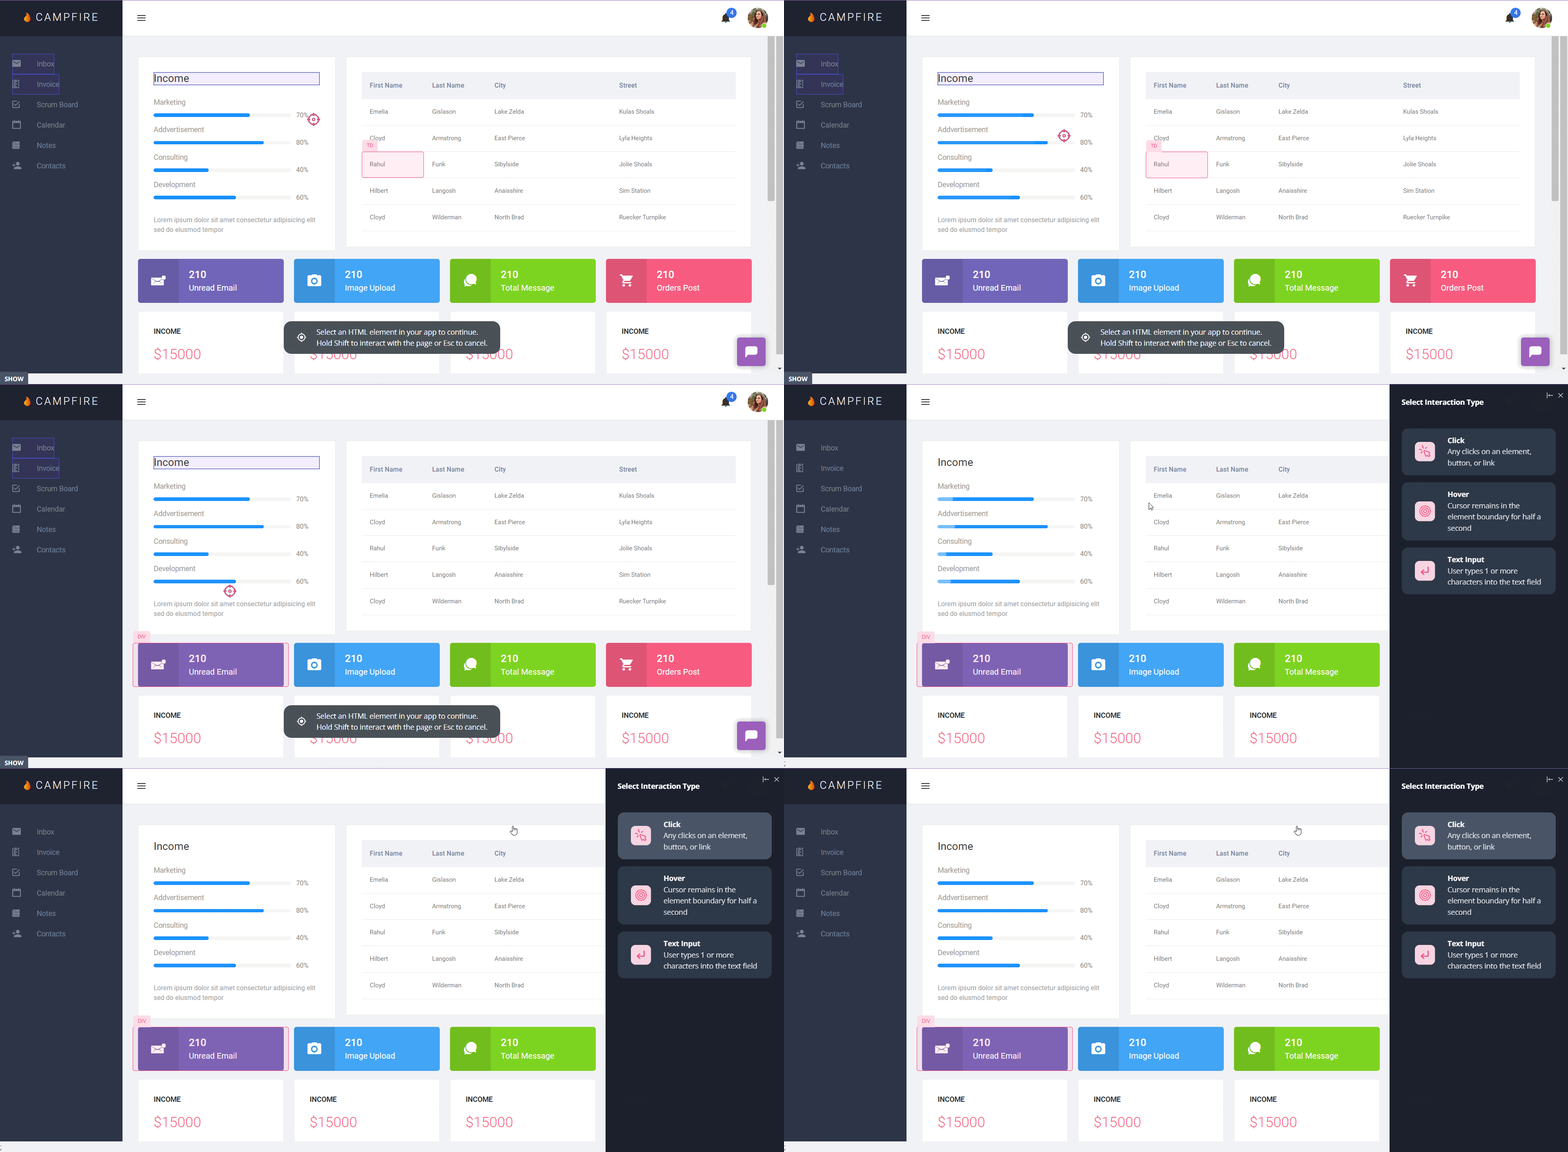
Along with feature usage, you should track specific elements like clicks, text inputs, and hovers regularly. Tracking user engagement at different touchpoints across the customer journey will give you a comprehensive view of user behavioral patterns. Therefore, the insights make it easier for you to form the next strategy.
Use microsurveys to track customer satisfaction and collect qualitative data
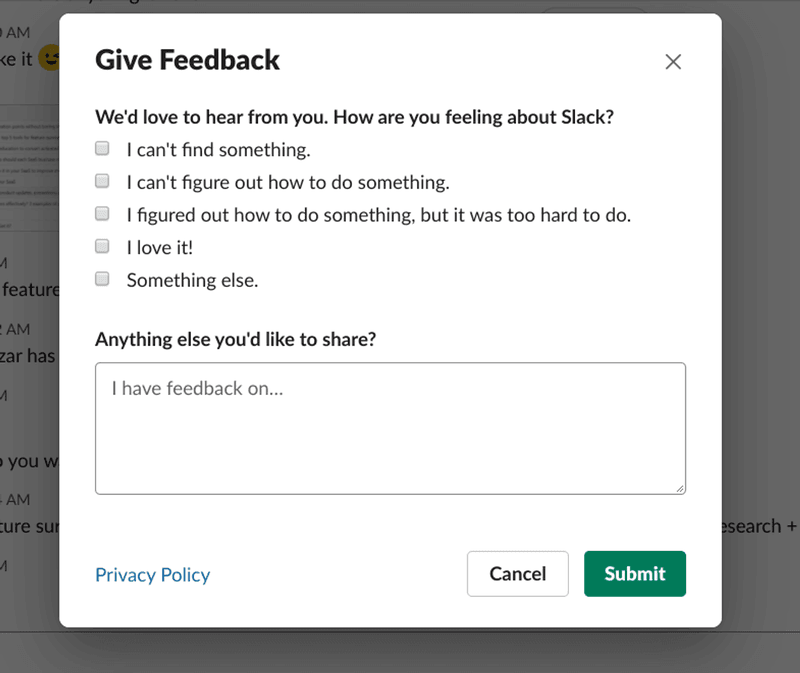
Microsurveys are easy and fast for collecting customer feedback at various stages of the user journey. You can trigger these surveys to appear inside your app after a customer completes a specific action. This increases the number of responses you can get.
There are multiple microsurveys used for various purposes, such as NPS, CSAT, customer effort score, and feature surveys. If the survey asks users to rate their experience on a number scale like CSAT surveys do, include a qualitative follow-up question to learn the exact reason behind each score.
Based on the data you want to collect, you may have to send microsurveys to only a particular group of people. Therefore, we would recommend you segment customers based on common characteristics.
Let’s discuss this in more detail.
Segment customers based on engagement and satisfaction
Customer segmentation is the process of dividing customers into groups depending on multiple shared criteria like engagement level, satisfaction score, and NPS score.
Let’s say you want to know whether trial users find value in your product. You can trigger a microsurvey, such as the one shown above after they’ve completed a key activity. This will help you address any issues before a trial user leaves without subscribing to your product.
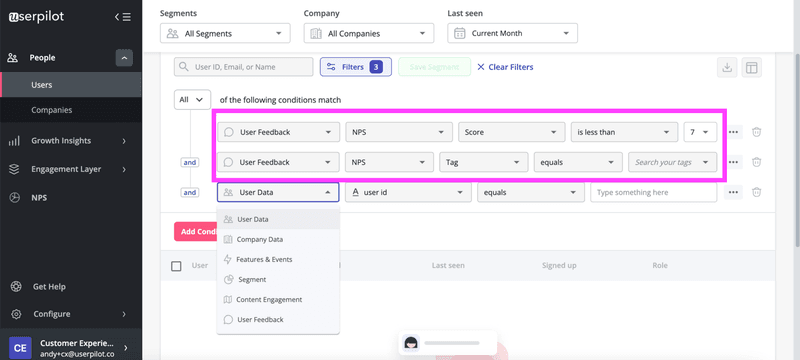
Userpilot’s advanced segmentation capabilities allow you to create several user segments according to a number of criteria.
The example below shows how you can create a segment of detractors based on their NPS scores. The NPS response tagging feature lets you analyze qualitative responses and create tags such as ‘missing features’. You can add these tags as another criterion for segmentation.
Send exit surveys to understand why customers churn
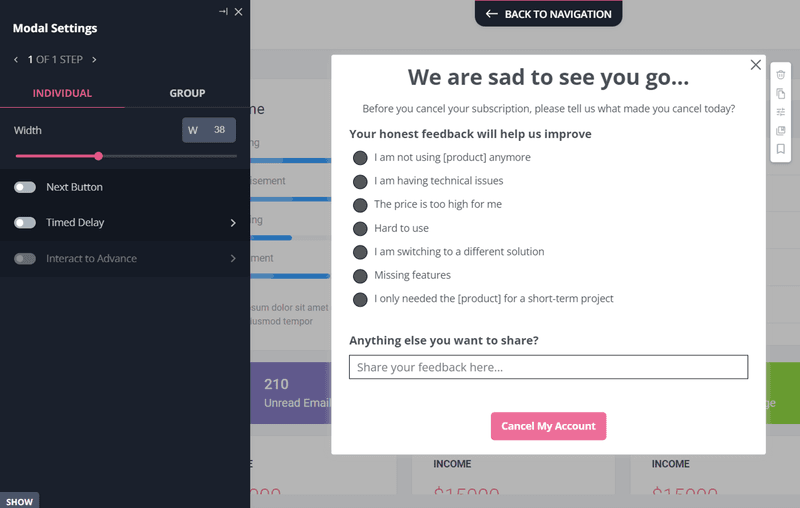
Exit surveys, or churn surveys, are sent after a customer downgrades or cancels their subscription to your product to understand why they chose to leave/downgrade.
There are 3 types of questions on churn surveys:
- Open-ended questions
- Multiple-choice questions
- Mixed questions
Among these three, mixed questions may be the best option. You can add an optional qualitative question for customers who want to elaborate on their answer or who couldn’t find any relevant option in the multiple choice.
The in-app churn surveys are sent right after a user hits the cancelation button. This ensures that they see the survey before finalizing their decision.
Moreover, you can suggest alternative choices to churning customers, such as temporarily pausing their accounts instead of leaving permanently. That said, knowing the causes of churn allows you to make improvements in your product and user experience for them and your existing customers.
Collect data insights in one place and analyze customer attrition
Finally, bring all the data together and use tools like dashboards for analysis. A dashboard gives an overview of your key customer metrics and visualizes trends in metrics like churn rates using simple charts.
The customer attrition rate should be among the important metrics measured and compared with results from feedback analysis. This will help you better understand the churn drivers in your company. You can also identify the drop-off points to tailor your churn reduction strategies to these particular areas.
How to use attrition analysis to improve customer retention?
Now that you know how to conduct customer attrition analysis, it’s time to incorporate the insights into retention strategies. Here’s what you should do.
Predict future churn and proactively reach out to at-risk customers
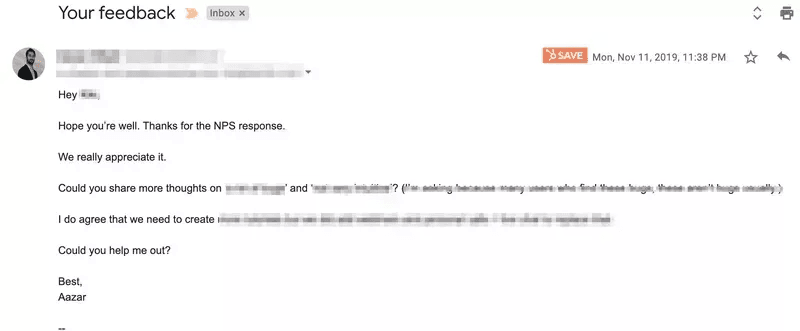
You should use historical data to find high-risk customers. Combined with insights from customer feedback analysis, you can proactively reach out to these customers with customized solutions.
It’s better to make them feel as involved as possible in your improvement strategy. Allowing customers to share more thoughts on how their experience can be improved will increase the chances of customer success. Moreover, customers will appreciate your emphasis on their input and might choose to stick around.
A trend analysis of the historical churn data will let you predict future churn rates. You can re-evaluate these rates later on to check the impact of your churn reduction strategies.
Run A/B experiments and optimize your product
After implementing strategies to mitigate the apps you have found in your analysis, you can run A/B experiments and optimize your product.
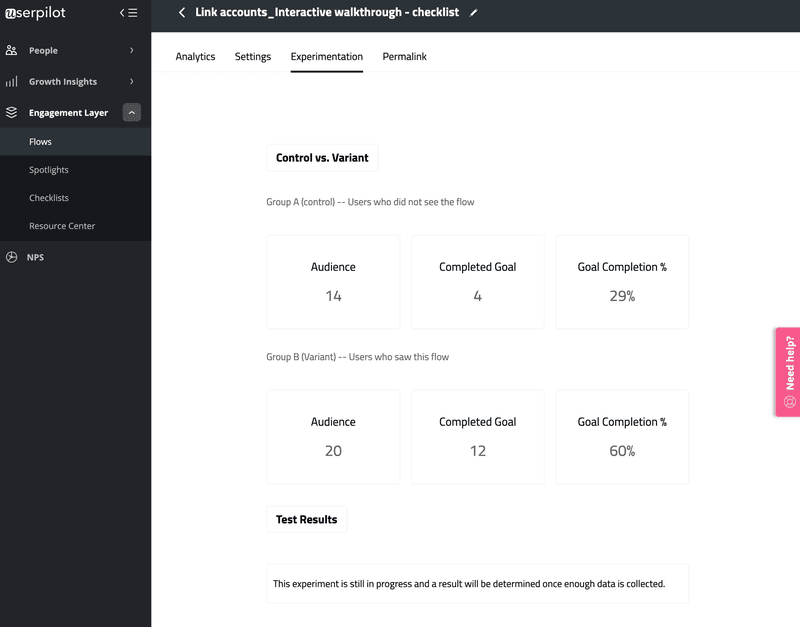
With Userpilot, you can A/B test to see if an interactive walkthrough helps users reach a product milestone without churning. For example, can a tooltip help users discover and engage with a new feature? Run an experiment to see.
Analyzing the experiment results will help you understand how customers engage with your product. As a product manager, you can run A/B experiments and iterate your onboarding processes to drive adoption goals and prevent churn.
Improve in-app guidance to provide better support to existing customers
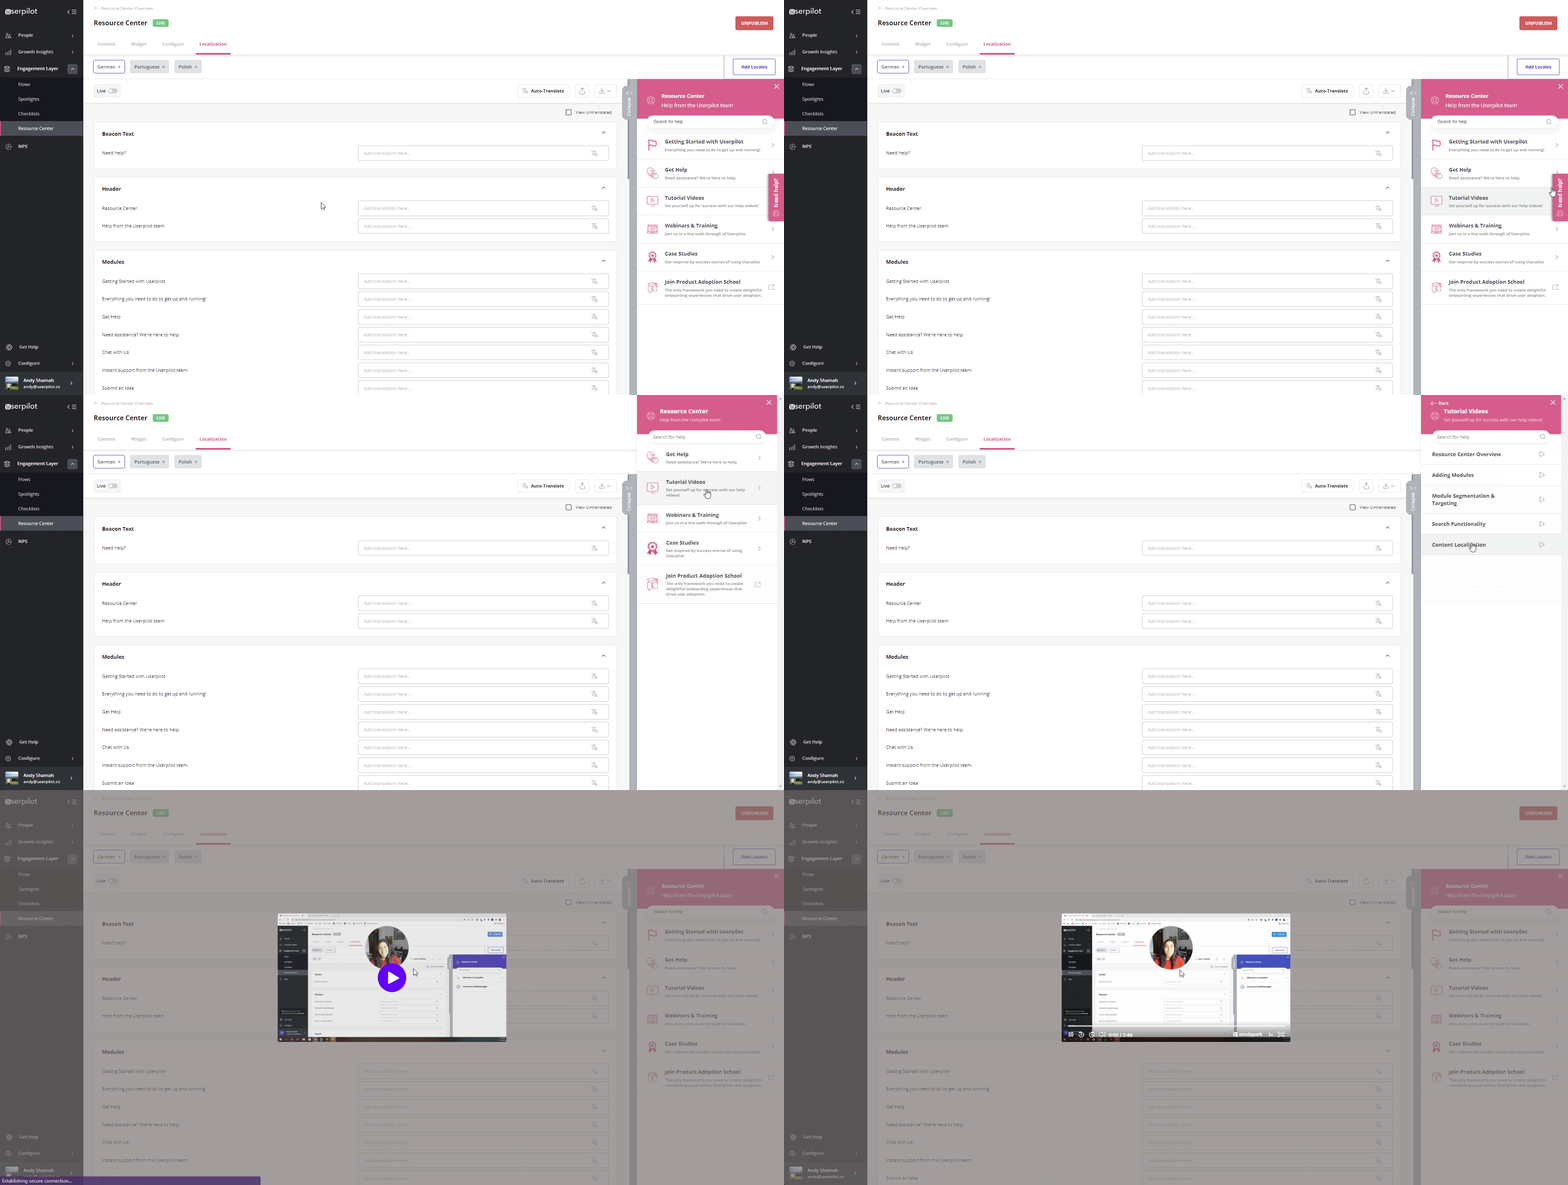
Build in-app self-service support so that customers can access it whenever they run into problems, particularly the repetitive kind. This ensures top-notch, 24/7 support that would also reduce pressure on the customer support team.
One poor customer service is often enough to make a long-term customer skeptical about using your product. To prevent this, the in-app resource center comes with bug fixes, documentation, FAQs, troubleshooting tips, a live chat option, a link to the knowledge base, etc.
In-app guidance reduces frustration and improves the customer experience. Users also feel accomplished when they fix an issue using your knowledge base.
Best tools for customer attrition analysis
Here are the two best tools for churn analysis.
Userpilot
Userpilot is a product growth platform with product analytics as one of its core offerings. It provides a vast array of functionalities that help you optimize your product code-free.
With its mobile capabilities, Userpilot also allows you to onboard and engage mobile app users by creating personalized messaging, push notifications, and surveys.
You can create several microsurveys like NPS, CSAT, and CES surveys and perform feedback analysis. Moreover, you can use event tracking and feature tagging to observe the engagement level and user behavioral patterns. It’s easy to create track combinations of in-app events, including subtle actions like forms/hovers.
Userpilot’s advanced segmentation lets you use various criteria to group customers. You can then create custom flows to suit your target segment’s needs.
Userpilot offers a 14-day free trial. Paid annually, its Traction plan costs $299/month (billed annually) and Growth plan offers customized pricing. The Enterprise package offers custom pricing based on user needs.
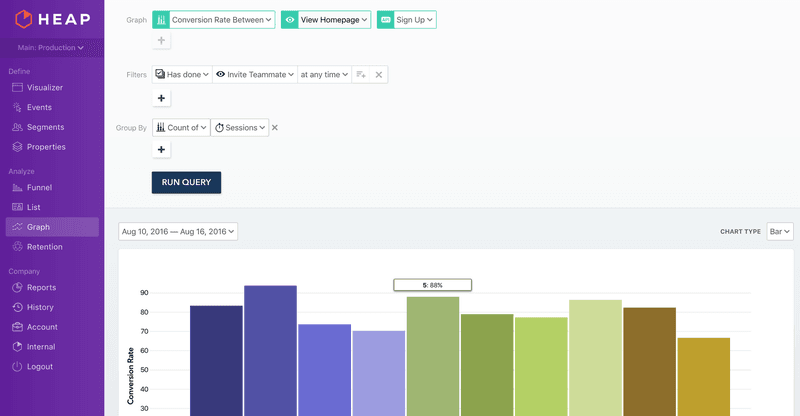
Heap
Heap is a comprehensive product analytics platform.
It allows you to track every user interaction with your product. You can create custom events to use in cohorts and funnel analysis. The tool also lets you analyze multiple user segments and provides real-time reporting.
Heap offers a 14-day free trial, and pricing starts at $1,000/month.
Wrapping it up
Churn reduction is not feasible without proper analysis. Here, churn analysis enables you to uncover meaningful insights into user behavior and engagement. You can use the results to develop strategies to improve the customer experience.
Want to get started with customer attrition analysis? Get a Userpilot demo and reduce customer churn.


