15 Customer Retention Metrics for SaaS [With Formulas & Examples]

![15 Customer Retention Metrics for SaaS [With Formulas & Examples] cover](https://blog-static.userpilot.com/blog/wp-content/uploads/2024/06/15-customer-retention-metrics-for-saas-with-formulas-and-examples_932aa4fd855a35bb9f5435d0971b3937_2000-1024x670.png)

If you’re not retaining customers, you have a problem with your SaaS worth looking into. Your product might not be fulfilling your customers’ wants and needs, and you might need to proactively address any issues to ensure your business succeeds in the long run. To do this, tracking customer retention metrics is essential.
These 15 metrics will allow you to keep your finger on the pulse of your business and respond or make changes where needed.
What is customer retention?
Customer retention refers to a company’s ability to keep its customers over a period of time. In SaaS, this means getting your customers to continue using your software instead of switching to a competitor.
Tracking customer retention metrics is vital because it directly impacts revenue. When customers stay with you, they keep paying for your service, which means a steady income stream.
High retention rates indicate satisfied customers and a successful business model. SaaS companies aim for a retention rate of around 85-90% on average.
How can you measure customer retention?
To measure customer retention effectively, you need to choose the right metrics to track, set up a system to monitor them and establish your benchmarks and goals.
Once you’ve chosen your metrics, you need a reliable system to track them. These tools, including in-app mobile surveys, help you collect and analyze data, making it easier to understand how well you retain customers.
After setting up your monitoring system, establish benchmarks and goals. Look at industry standards and your past performance to set realistic targets.
What are customer retention metrics?
Customer retention metrics provide insights into customer loyalty, satisfaction, and the effectiveness of your customer retention tools and strategies. Focusing on the right customer retention metrics will help you identify areas for improvement.
Why do retention metrics matter?
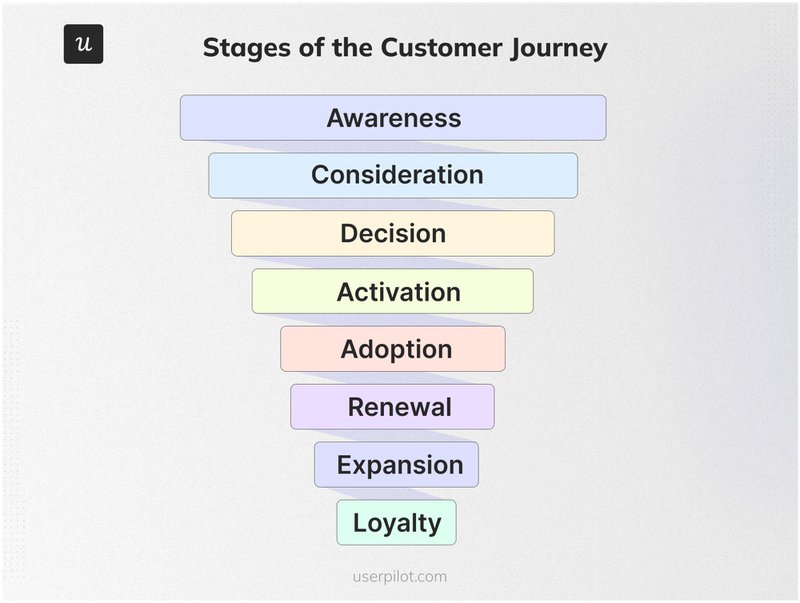
Retention metrics highlight the importance of the retention stage in the user journey. In the long run, investing in retaining users is much cheaper than acquiring new ones. When you focus on keeping your existing customers happy, you spend less money than you would on marketing and advertising to attract new ones.
Additionally, strong customer retention leads to more upsells and cross-sells, as satisfied customers are more likely to purchase additional products or services from you. This results in a higher renewal or purchase rate, providing a steady revenue stream. Higher customer satisfaction also translates to increased loyalty, meaning customers are likelier to stick with your brand over time.
Furthermore, loyal customers often become brand advocates, recommending your products or services to others. This word-of-mouth promotion is incredibly valuable and can help attract new customers without extra marketing costs.
15 Customer retention metrics to track
Tracking the right customer retention metrics is essential for understanding how well you keep your customers engaged and satisfied. Here are 15 key metrics you should monitor to measure and improve your customer retention efforts effectively.
1. Customer Retention Rate
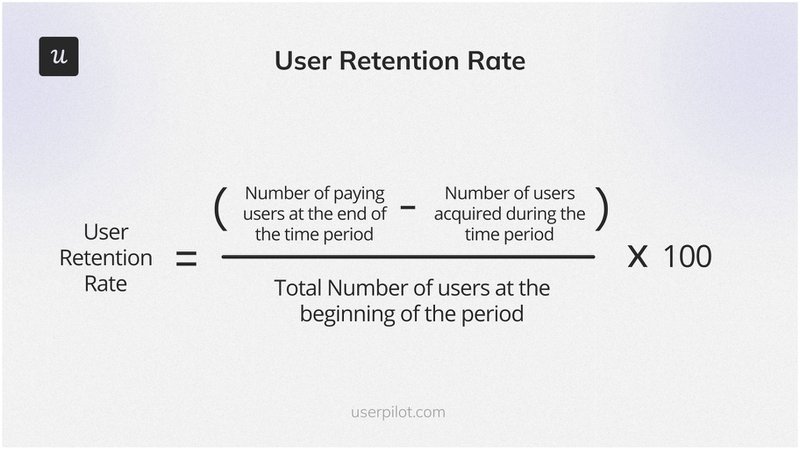
Customer Retention Rate (CRR) measures the percentage of customers who continue using your service over a period, indicating how well you maintain your customer base.
Here’s the formula to calculate Customer Retention Rate:
((Customers at period end – New customers acquired) / Customers at period start) x 100
For example, starting the quarter with 200 customers, gaining 50 new customers, and ending with 230 customers, your CRR would be:
((230 – 50) / 200) x 100 = 90%
2. Customer Churn Rate
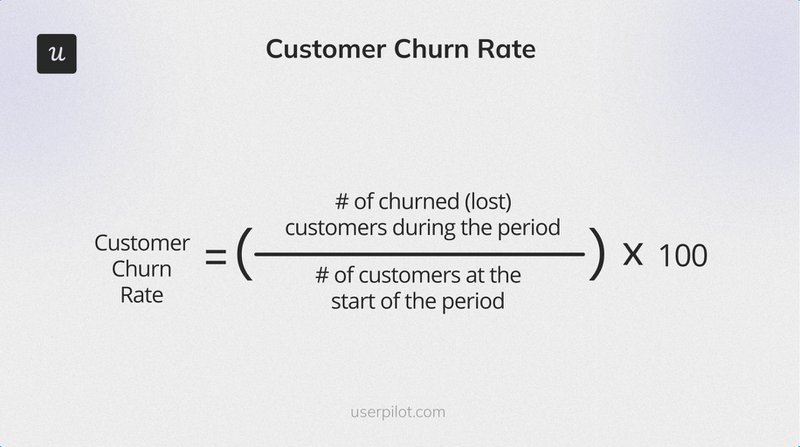
Customer Churn Rate measures the percentage of customers who stop using your service during a period, highlighting potential issues with your product or service.
The churn rate formula is:
((Customers at start of period – Customers at end of period) / Customers at start of period) x 100
For example, if you started the month with 300 customers and ended with 270, your churn rate would be:
((300 – 270) / 300) x 100 = 10%
You can also use a similar approach to measure your Revenue Churn Rate.
Tools like Userpilot allow you to segment users based on behaviors or events to prevent churn. For example, you can track user activity to identify patterns indicating a customer might leave, such as reduced usage, lack of engagement with key features, or extended inactivity.
Identifying at-risk customers early enables proactive re-engagement. This can involve sending personalized messages, offering additional support, or providing incentives to encourage them to stay.

3. Customer Lifetime Value
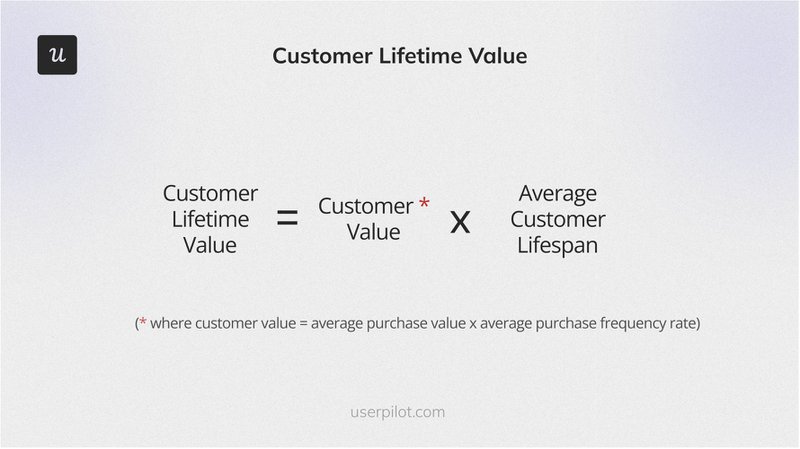
Customer Lifetime Value (CLV) estimates the total revenue a customer generates over their time with your service. It helps you understand long-term customer value and guides marketing and retention strategies.
The customer lifetime value formula is:
(Average Purchase Value) x (Average Purchase Frequency Rate) x (Customer Lifespan)
For example, if the average purchase value is $50, the purchase frequency is four times per year, and the customer lifespan is five years, the customer lifetime value is:
$50 x 4 x 5 = $1,000
4. Engagement Rate
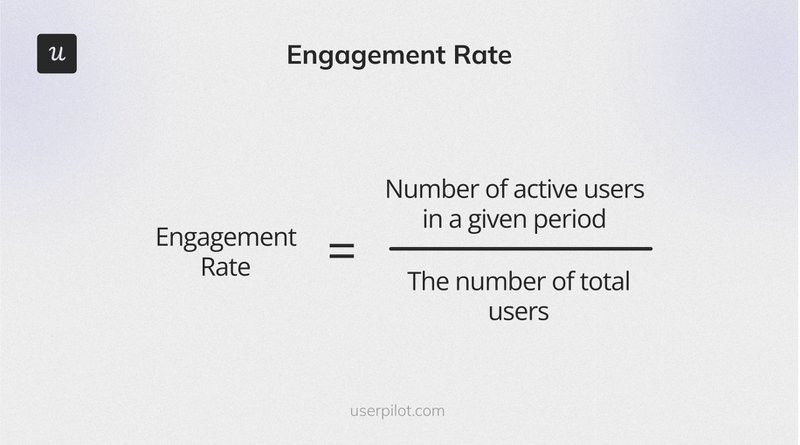
Engagement Rate measures how actively customers use your product or specific features, indicating the product’s value and relevance to them.
The formula for Engagement Rate is:
(Number of Engaged Users / Total Number of Users) x 100
For example, if 150 out of 300 users actively engage with a new feature, the Engagement Rate is:
(150 / 300) x 100 = 50%
To measure Engagement Rate, you can use tools like Userpilot to track how often users interact with your product or specific features. Userpilot allows you to set up event tracking and monitor user actions, such as clicks, logins, or time spent on particular features.

5. Monthly Recurring Revenue
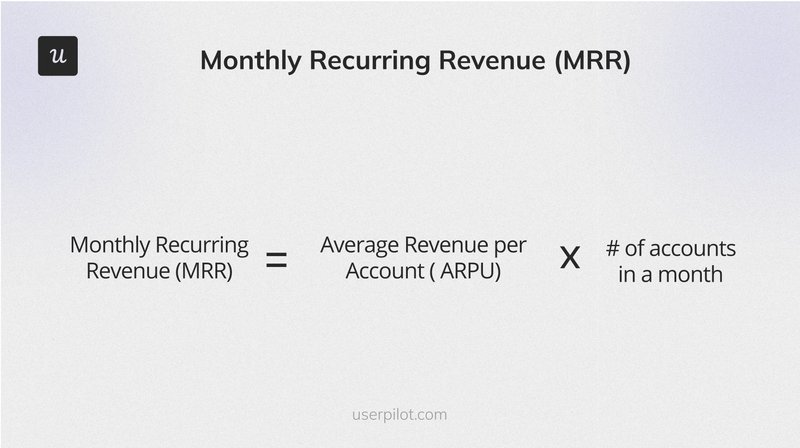
Monthly Recurring Revenue (MRR) is crucial for SaaS businesses. It measures predictable monthly revenue from active subscribers and indicates your company’s financial health and growth potential.
The MRR formula is:
(Average Revenue Per Customers) x (Total Number of Customers)
For example, if the average revenue per user is $50 and there are 200 active users, the MRR is:
$50 x 200 = $10,000.
6. Revenue Growth Rate
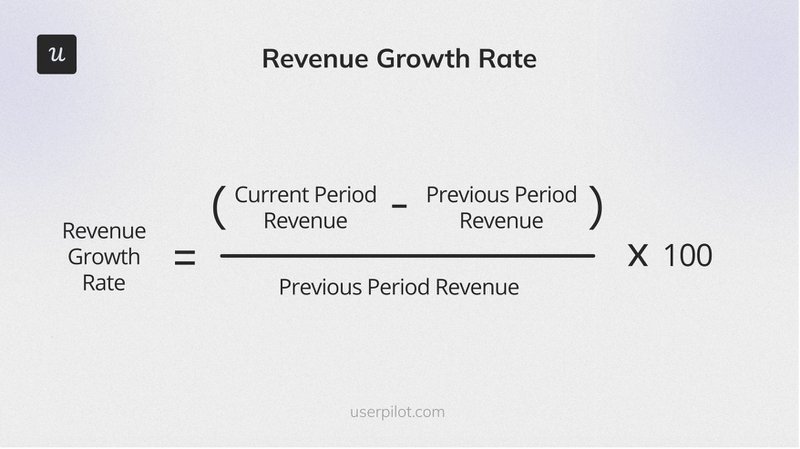
Revenue Growth Rate measures how quickly your company’s revenue increases over a period. It reflects the effectiveness of growth strategies and overall business health.
The formula is:
((Revenue at End of Period – Revenue at Start of Period) / Revenue at Start of Period) x 100
For example, if your revenue at the start of the year was $100,000 and at the end was $150,000, the Revenue Growth Rate is:
((150,000 – 100,000) / 100,000) x 100 = 50%
7. Customer Acquisition Cost
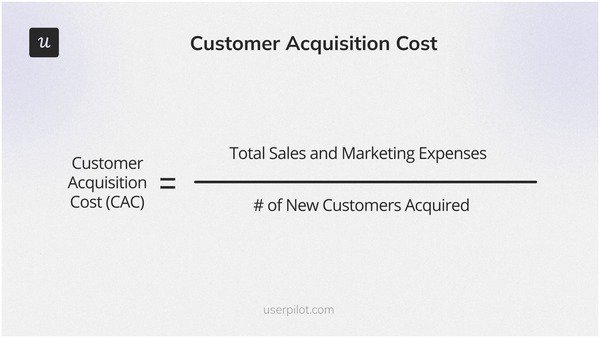
Customer Acquisition Cost (CAC) measures the total cost of acquiring a new customer, including marketing, sales, and other efforts. Understanding CAC helps evaluate the efficiency of your acquisition strategies and their impact on profitability.
The formula is:
(Total Sales and Marketing Expenses) / (Number of New Customers Acquired)
For example, if your sales and marketing expenses for a month are $10,000 and you acquired 50 new customers, the CAC is:
$10,000 / 50 = $200
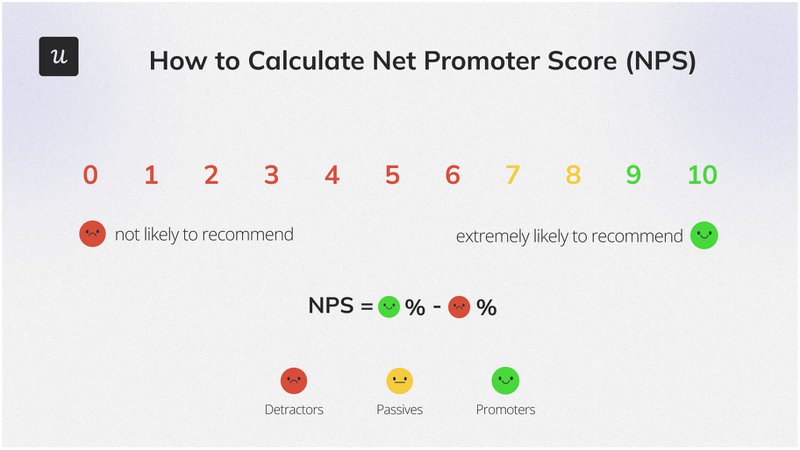
8. Net Promoter Score
Net Promoter Score (NPS) measures customer satisfaction and loyalty by asking how likely customers are to recommend your product or service. It provides insight into customer sentiment and identifies areas for improvement.
To measure Net Promoter Score (NPS), ask customers: “On a scale of 0 to 10, how likely are you to recommend our product/service to a friend or colleague?” Based on responses, categorize customers into three groups:
- Promoters (scores 9-10): Loyal customers who likely recommend your product.
- Passives (scores 7-8): Satisfied but unenthusiastic customers who might switch to competitors.
- Detractors (scores 0-6): Unhappy customers who are unlikely to recommend your product and may discourage others.
The Net Promoter Score formula is:
Percentage of Promoters – Percentage of Detractors
For example, if 70% of respondents are Promoters and 10% are Detractors, your NPS is:
70% – 10% = 60
An NPS of 60 indicates a strong likelihood that your customers will recommend your product.
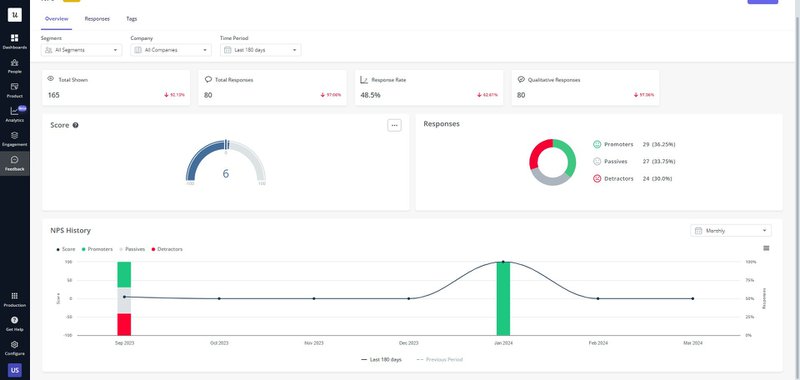
Tools like Userpilot allow you to easily create, distribute, and analyze NPS surveys. Userpilot’s NPS surveys enable direct feedback collection from users, while the analytics dashboard helps track and visualize the data. Regularly measuring NPS with Userpilot allows you to take targeted actions to enhance customer experience and increase loyalty.
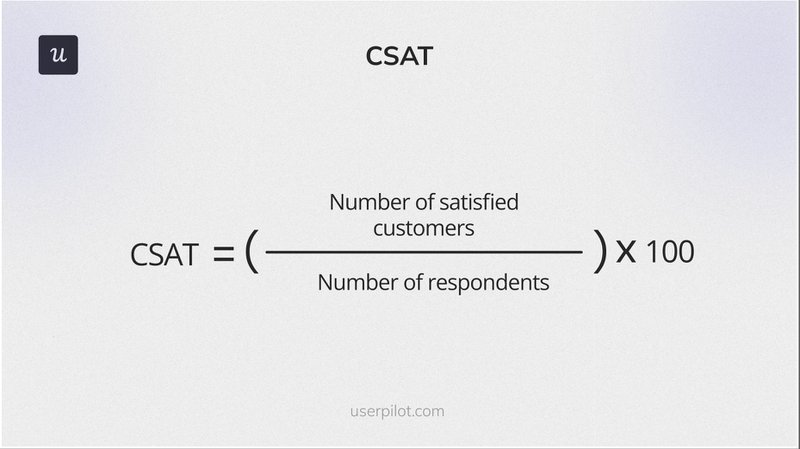
9. Customer Satisfaction Score
Customer Satisfaction Score (CSAT) measures how satisfied customers are with your product or service, providing direct feedback and identifying areas for improvement.
To measure CSAT, ask customers to rate their satisfaction with a specific interaction, product, or service on a scale (often 1 to 5 or 1 to 10). Customers choose a rating that best represents their satisfaction level.
The customer satisfaction score formula is:
(Number of Satisfied Customers / Total Number of Responses) x 100
“Satisfied Customers” typically rate their experience positively, usually at the top end of the scale (e.g., 4-5 on a 5-point scale).
For example, if you receive 200 responses and 160 are positive, the CSAT is:
(160 / 200) x 100 = 80%
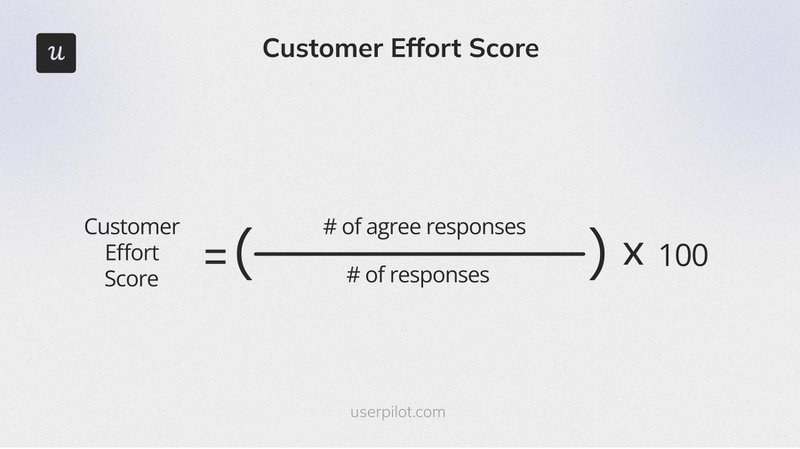
10. Customer Effort Score
Customer Effort Score (CES) measures the ease of interaction with your product or service, especially when seeking support or completing a task. It helps identify friction points and improve the customer experience.
To measure CES, ask existing customers to rate the ease of their experience. A common prompt is, “It was easy for me to resolve my issue today” to which customers can agree or disagree.
The CES formula is:
(Number of ‘Agree’ responses / Total Number of Responses) x 100
For example, if you receive 250 ‘agree’ responses with a total number of responses of 400, the CES is:
(250 / 400) x 100 = 62,5%
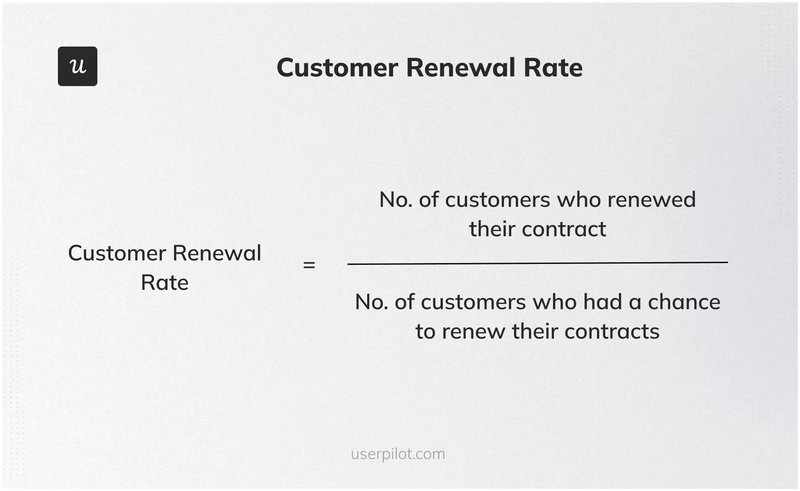
11. Customer Renewal Rate
Customer Renewal Rate measures the percentage of customers who renew their subscriptions or contracts over a specific period, indicating customer loyalty and the ongoing value of your product or service.
The formula is:
(Number of Customers Who Renewed / Number of Customers Up for Renewal) x 100
For example, if 150 out of 200 customers renewed their subscriptions during the year, the renewal rate is:
(150 / 200) x 100 = 75%
12. Daily/Weekly/Monthly Active Users
Daily, Weekly, and Monthly Active Users (DAU, WAU, MAU) measure the number of unique users engaging with your product within specific time frames, helping to understand user engagement and the health of your user base.
- Daily Active Users (DAU): Number of unique users interacting with your product daily.
- Weekly Active Users (WAU): Number of unique users engaging with your product over a week.
- Monthly Active Users (MAU): Number of unique users using your product over a month.
To calculate these metrics, count the unique users interacting with your product within the specified period.
For example:
- If 1,000 unique users logged in on a given day, your DAU is 1,000.
- If 20,000 unique users used your product over the past month, your MAU is 20,000.

Using tools like Userpilot, you can segment and track active users‘ numbers and behaviors. Userpilot allows for detailed user segments based on criteria such as user activity, feature usage, and time spent on the platform. This segmentation offers deeper insights into user interactions with your product. By tracking these behaviors, you can identify patterns, understand engagement levels, and make data-driven decisions to enhance user experience and retention.
Userpilot’s analytics dashboard provides a comprehensive view of DAU, WAU, and MAU, enabling you to monitor trends and respond quickly to changes in user behavior. This ensures your product remains engaging and valuable to your users over time.

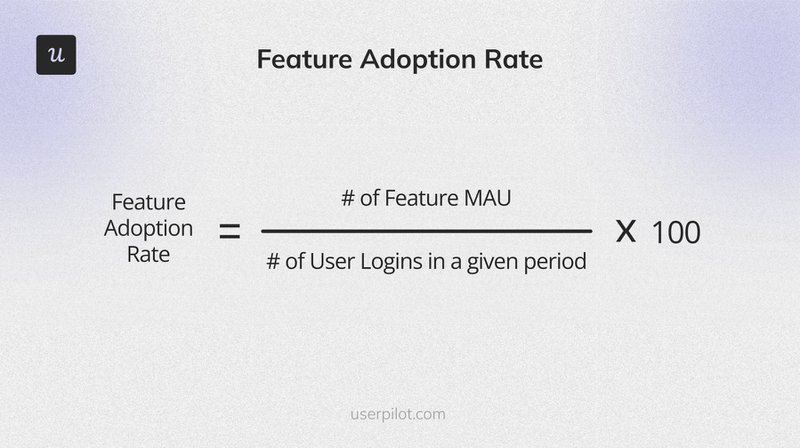
13. Feature Adoption Rate
The Feature Adoption Rate measures how many customers are using a specific feature within your product. This metric helps you understand the popularity and usefulness of new features, guiding improvements and prioritizing future developments.
The formula is:
(Number of Users Who Used the Feature / Total Number of Users) x 100
For example, if 500 out of 2,000 total users have used a new feature, the Feature Adoption Rate is:
(500 / 2,000) x 100 = 25%
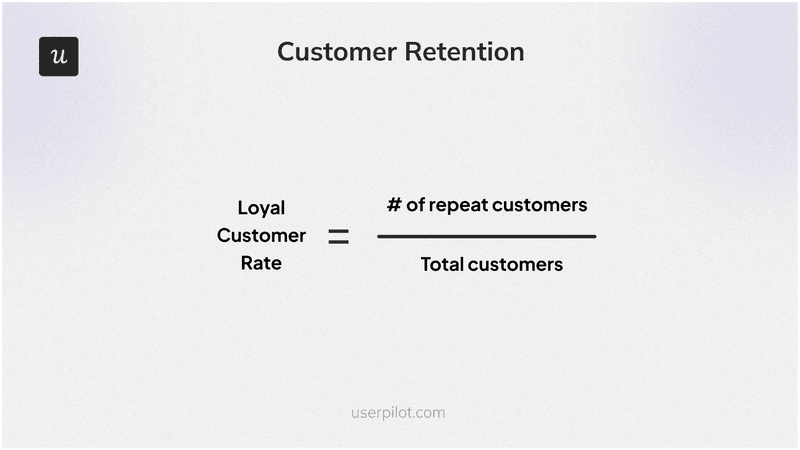
14. Loyal Customer Rate
Loyal Customer Rate measures the percentage of customers who continue to purchase from your business over a specific period, indicating strong customer loyalty and satisfaction. This metric helps you understand how well you retain your most valuable customers.
The formula is:
(Number of Repeat Customers / Total Number of Customers) x 100
For example, if you have 1,000 total customers and 300 have made repeat purchases, the Loyal Customer Rate is:
(300 / 1,000) x 100 = 30%
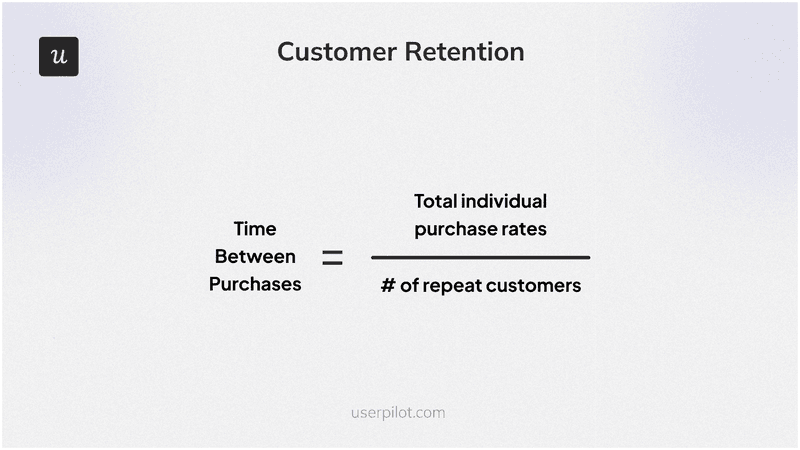
15. Time Between Purchases
Time Between Purchases measures the average duration between successive purchases made by repeat users. This metric helps you understand customer buying patterns and optimize marketing and sales strategies to increase the repeat purchase rate.
The formula is:
Total Individual Purchase Intervals / Number of Repeat Customers
For example, if three customers made repeat purchases with intervals of 30, 45, and 60 days, the Time Between Purchases is:
(30 + 45 + 60) / 3 = 45 days
Conclusion
These 15 customer retention metrics should provide you with enough information to monitor the effectiveness of your customer retention strategy to avoid negative consequences.
If you need help tracking metrics like customer retention rate or lifetime value, then Userpilot can help. It allows you to segment users and implement win-back strategies; you can monitor product and feature engagement, create NPS surveys, and review the results.
Explore how you can improve the retention in your mobile app with Userpilot’s brand-new mobile features.
If you want to know more book a demo now!
About the author