Your Team Ships 4x Faster Now. Your Success Metrics Have Not Kept Up.


Product success metrics should be getting easier to get right in 2026. Userpilot’s product analytics is more capable than ever, AI writes 46% of the code at most companies using it, and GitHub Copilot has cut pull request time from 9.6 days to 2.4. Engineering teams are shipping more features per quarter than ever. Most of those features are shipping with no success metric defined for them.
When I look at feature funnels at Userpilot, the pattern I see most often is not bad metrics. It is missing ones. Features that shipped, got iterated on, got iterated on again, and now live in a product layer no one can read because the original measurement was never set up. Two features per quarter was survivable. Eight is not.
This guide covers how to define success metrics before a feature enters the build queue, not after it ships. It covers the five-step process, the right framework for organizing your metrics, and all 12 metrics across the AAARRR lifecycle, with the specific pre-launch decisions each one requires.

Why shipping faster broke product measurement
Most product teams think of the measurement problem as a tool or skills gap. The actual problem is the sequence. Every team I talk to defines success criteria after a feature ships. Two features per quarter made post-launch measurement survivable. Eight features per quarter means you are always measuring the wrong version of the feature, because it has already been iterated on by the time you get to it.
Our CEO Yazan Sehwail described the shift when we were building Userpilot’s analytics layer: “As AI is also writing code, it’s helping engineers and product teams build features a lot faster. Instead of every quarter you’re releasing one or two features, now you’re releasing seven, eight, nine. What happens is now it becomes even harder for product teams to manually track each one and understand usage for each one.” The speed is real. The measurement has not kept up.
What makes this serious is the compounding effect. An unmeasured feature does not fail quietly in isolation. It becomes the substrate for the next one, which ships on top of an outcome no one has read. After three or four cycles, you have a product layer that is genuinely unmeasurable, because each layer inherits the gaps of the one below it.
I know what the alternative looks like because we built it into our process. When we launched the email feature at Userpilot, we had the activation funnel instrumented before the feature went live. The first day in production, the data showed a sharp drop-off at domain verification. I built a tooltip and a checklist directly inside Userpilot in a few hours without a dev ticket, and the drop-off closed within days. Without that pre-launch instrumentation, the problem would have been invisible for weeks while the team shipped the next feature on top of a broken flow.
The question most metric guides answer wrong
Every product metric guide will tell you what to track. Sign-up rate, activation rate, NPS, MRR, the list is well-documented and has not changed much in years. What those guides almost never address is when to define those metrics. The answer is before the feature enters the build queue, not after it ships, and the difference between before and after is not cosmetic.
Defining metrics before launch means instrumenting the specific events that matter for that feature. Doing it after means reaching for whatever data is already available: almost always activity data. Page views, sessions, login counts. Activity metrics are always available retroactively. Outcome metrics require deliberate instrumentation before the product exists.
Activity metrics always look good when usage grows. Every feature launch creates some activity spike, and teams that define metrics post-launch almost always end up measuring the spike, calling it success, and moving on. The metric that would have caught the failure (activation rate, feature adoption, NPS tied to this specific release) was never defined and so was never tracked.
The framework that forces the pre-launch question
A metrics framework is useful not because it gives you better metrics, but because it forces the question “what does success look like for this feature?” at the right moment: before the sprint starts, not after the release. Teams that skip the framework step almost always skip the measurement step too, because there is no checkpoint in their process that demands an answer before the build begins. Three frameworks do this work. I use all three together.
The North Star Metric is the single measure of product success that guides every other decision. Before any feature enters the build queue, the first question is whether it moves the North Star. A yes answer immediately tells you which downstream metrics to define. An unclear answer means the feature should not be in the queue yet, because you cannot define success criteria for a feature whose purpose you have not agreed on.
HEART, developed by Google, organizes metrics into Happiness, Engagement, Adoption, Retention, and Task Success. It is the most useful framework for catching the qualitative gaps that pure quantitative measurement misses. Run a HEART check before launch and you will catch missing satisfaction metrics (CSAT, NPS) before they get skipped in the instrumentation rush.
AAARRR, also called Pirate Metrics, maps metrics to the stages of the customer lifecycle: Acquisition, Activation, Adoption, Retention, Revenue, and Referral. Running AAARRR before launch tells you which lifecycle stages the feature touches and which metrics you have not yet defined for each one. It is the spine I use for the 12 metrics below for exactly that reason.
The way I run all three: North Star tells me which AAARRR stage a feature primarily affects. AAARRR tells me which specific metrics to define at that stage. HEART tells me whether I have missed a qualitative signal. All of this runs before the feature enters development, not after it ships.
How to define success metrics before a feature ships: A 5-step process
1. Anchor to a business goal at discovery
Before any feature discussion goes further than the discovery stage, it needs a business goal. Metrics are a measurement system for goals, and without the goal defined first you are picking numbers that measure nothing in particular. This mistake is affordable when you ship two features a quarter. At eight, you compound it across every sprint and end up with a backlog of metrics that cannot be traced to any outcome.
Use the SMART framework to make the goal specific enough to generate the right metric. “Increase the trial-to-paid conversion rate from 22% to 30% by end of Q3″ immediately tells you which metrics matter (sign-up rate, activation rate, time to value) and which features should and should not be built to move it. Vague goals like “improve user experience” do not generate any metric at all.
One addition I make in 2026: specify which user type the goal applies to. An activation rate goal means something different if a significant share of your new signups are AI agents with a different activation profile than human users.
2. Pick your metrics before sprint planning
With the goal set, run your framework check before the feature enters sprint planning, not during it. AAARRR tells you which lifecycle stage the feature primarily affects and which metrics belong there. The North Star check confirms whether the feature is pointed at the right outcome. A quick HEART scan surfaces any qualitative signals you have not yet defined a metric for.
Before finalizing targets, benchmark them against Userpilot’s SaaS Product Metrics Benchmark Report, which tracks activation, time to value, retention, feature adoption, NPS, and onboarding checklist completion across 547 SaaS companies. The median activation rate is 37%. A target of 40% for a new feature is ambitious but achievable; a target of 80% is not, and setting it will waste a sprint chasing a number the data cannot support.
3. Instrument your analytics tool before development starts
Metrics only exist if the events that feed them are tracked. The instrumentation work of defining events, tagging them, and confirming they fire correctly needs to happen before development, not as a post-launch add-on. If instrumentation lands in the post-launch backlog, it stays there while the team ships the next feature.
Userpilot’s product analytics lets you tag events without code, which means the PM can instrument the events before a developer writes a line of feature code. The Agent Analytics module launching this quarter adds task completion tracking and failure signals for AI agent users on top of the standard event taxonomy, covering the second user stream most teams are not yet measuring.
4. Build the dashboard before launch
A metric defined but not visible is a metric that will not be reviewed. Get the custom dashboard built before launch day, not in the sprint after. The dashboard gives you a launch-day baseline: the numbers it shows the first day in production are the numbers every subsequent comparison is measured against. Without a launch-day baseline, you have no reference point, and by sprint three you will not remember what the pre-launch state was.
Structure the dashboard with the North Star metric at the top, the feature-specific AAARRR metrics in the middle, and the agent-stream metrics (task completion rate, failure rate) alongside the human-stream metrics if the feature has any API or MCP-accessible surfaces.
5. Set your targets before the feature ships
The final pre-launch step is committing to a specific number you are trying to move. Not “increase activation rate” but “increase activation rate from 37% to 45% within 60 days of launch.” A target without a number and a deadline is a direction, not a metric.
Userpilot’s benchmark report gives you the reference points for the human-side targets. On the agent side, the Google Cloud team published a KPI framework for production AI agents covering reliability, adoption, and business value across three pillars, worth reading before you set your first agent-stream target.
12 Product success metrics: What to define before each one ships
The 12 metrics below follow the AAARRR framework. For each one: what it measures, what you need to decide before the feature launches to track it properly, the formula, and what changes when agent traffic enters the picture. None of these are new. What is new is the discipline of defining them before the feature ships instead of after.
Acquisition stage metrics
Acquisition is where new users first encounter your product and take an initial action. Any feature that changes your sign-up flow, expands your target audience, or opens a new entry point needs its acquisition metrics defined before it ships. The baseline you establish at launch is the reference point for every cohort analysis you run afterward. Once users have flowed through the new experience, there is no retroactive baseline to create.
1. Free trial sign-up rate
The free trial sign-up rate is the percentage of sign-up page visitors who complete registration and start a free trial over a given period. It measures the effectiveness of your acquisition strategy and the friction in your sign-up flow. If a feature changes the sign-up path in any way, you need the pre-change baseline locked in before the change goes live.
To calculate: divide total free trial sign-ups by sign-up page visitors, multiply by 100. If 1,000 people visit the sign-up page and 170 register, the sign-up rate is 17%.
Sign-up rate = (170 / 1,000) x 100 = 17%
Before you ship: Decide whether you are separating programmatic registrations (API or developer flow) from UI sign-ups, and tag each origin before the feature goes live. Without this decision made pre-launch, you have no clean baseline once agent registrations start mixing into the data.
Agent lens: If agents are registering through your API or developer onboarding flow, your sign-up rate can spike in ways that do not predict revenue. Segment sign-ups by origin before reading this number as a growth signal.
2. Customer acquisition cost
Customer acquisition cost (CAC) is the average cost to acquire one new paying customer across all sales and marketing spend in a period. It is the counterpart to lifetime value: a healthy SaaS business maintains a LTV:CAC ratio of at least 3:1. If a feature is intended to improve acquisition efficiency (a new landing page, a new channel, a new onboarding path), set your CAC baseline before it ships so you can isolate its contribution from the existing trend.
To calculate: divide total sales and marketing spend by new customers acquired. Spending $10,000 to acquire 100 customers gives a CAC of $100.
CAC = $10,000 / 100 = $100
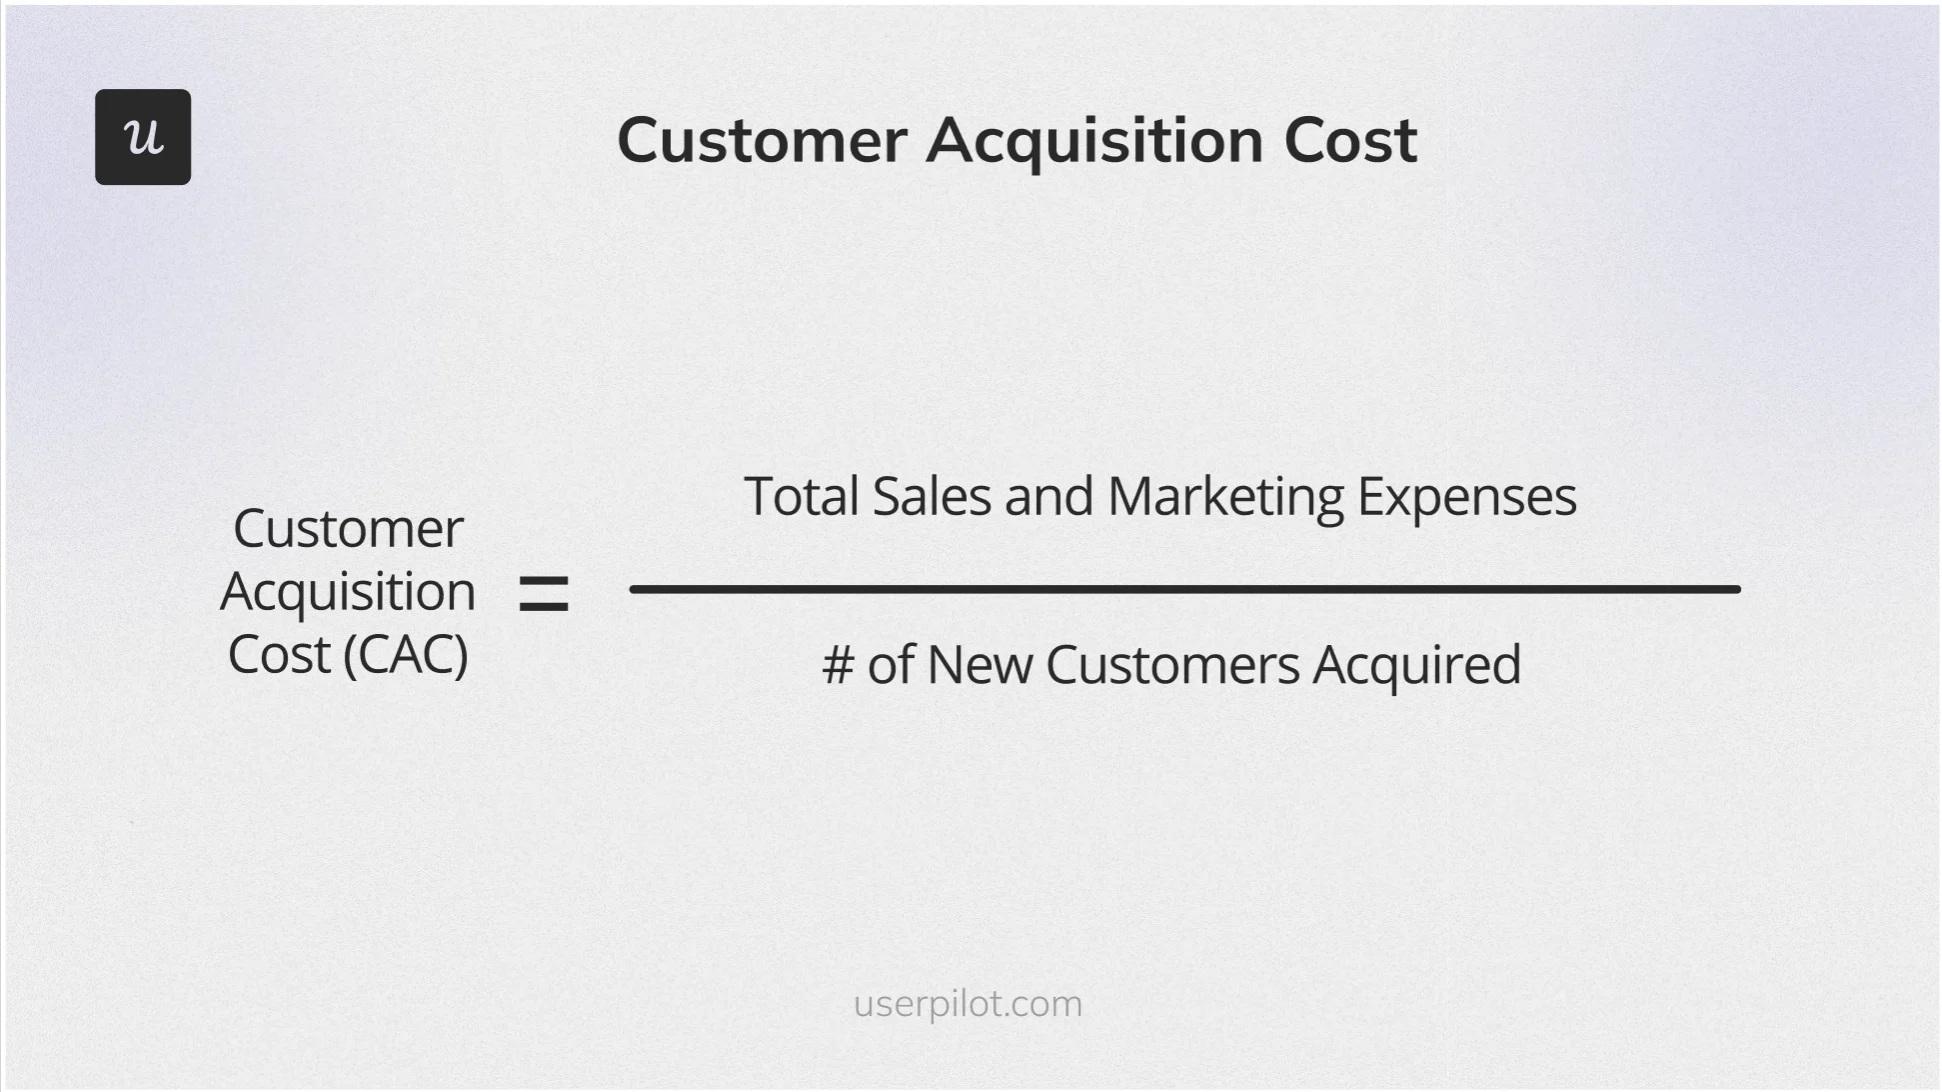
Before you ship: Agree on the cost accounting period and which channels to include. If a new feature expands into a new acquisition channel, define the channel attribution rules before launch. Otherwise, you will not be able to separate its contribution from the baseline after the fact.
Agent lens: Agent adoption typically comes through developer docs and API directories, not marketing campaigns. Track agent acquisition cost separately from human CAC, because the channel economics are fundamentally different and blending them distorts both numbers.
Activation stage metrics
Activation is the moment a new user first realizes your product’s value, and defining your activation milestone before launch is how you catch broken flows on day one instead of six weeks in. The email feature story I shared earlier is exactly this: we had the funnel instrumented before launch, saw the domain verification drop-off immediately, and fixed it before the next sprint started. Without pre-launch instrumentation, that problem compounds silently while the team ships the next feature on top of a broken flow.
3. Time to value
Time to value (TTV) is the duration from sign-up to the first meaningful outcome in your product. It is the most diagnostic activation metric because it predicts retention: users who reach value quickly convert and stay at higher rates than those who do not. The “meaningful outcome” you define as the activation event is everything: define it precisely before the feature ships, or you will have no baseline the moment users start flowing through it.
To measure: define the activation event before the feature goes live (the specific moment a user achieves their first meaningful outcome), then calculate the average time between sign-up and that event using your analytics platform.
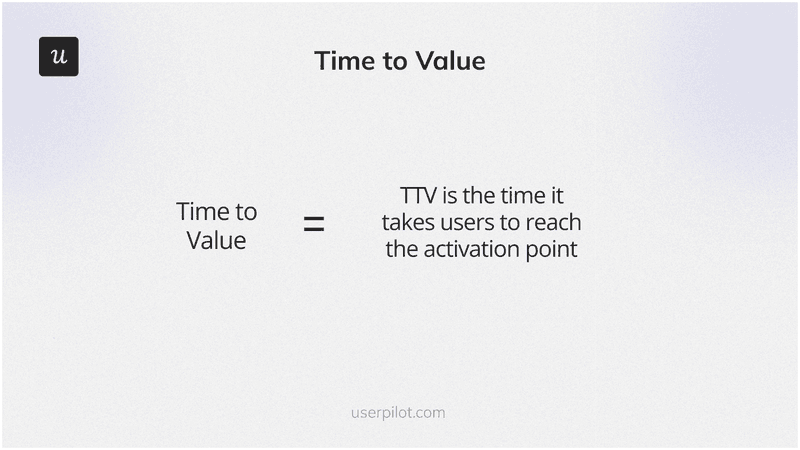
Before you ship: Write the activation event for this feature in one sentence before development starts. “User has completed X and seen Y” is a valid definition. “User is engaged” is not. The specificity of this definition is what turns TTV from a number that fluctuates randomly into a diagnostic signal you can act on.
Agent lens: For agent users, TTV is the time from first API call to first successful task completion, which is a different event than human activation. Track it separately, since agent TTV tends to be shorter but is more sensitive to API documentation quality and onboarding flow clarity.
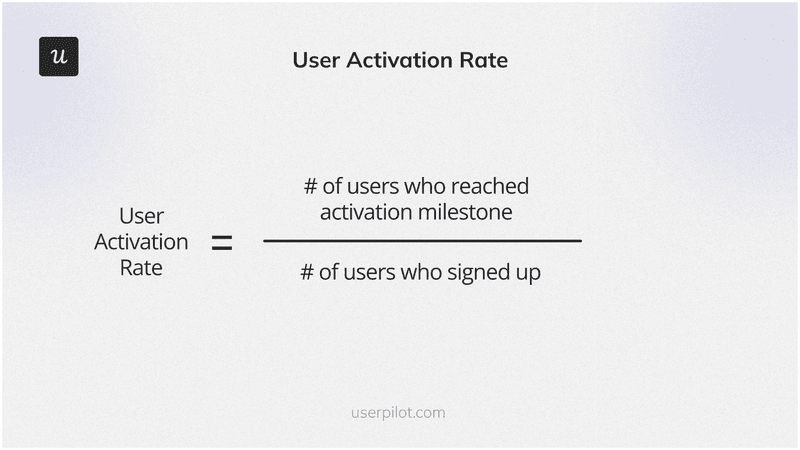
4. Customer activation rate
The customer activation rate is the percentage of new users who reach the activation milestone in a given period. It converts TTV into a population-level picture: not just how long it takes to reach value, but how many users get there at all. Userpilot’s SaaS benchmark report puts the median activation rate across 547 companies at 37%. If a feature changes the onboarding flow in any way, your pre-launch baseline is the number that tells you whether the change helped or hurt.
To calculate: divide activated users by total sign-ups in a period, multiply by 100. If 666 out of 1,000 sign-ups reach the activation milestone, the activation rate is 66.6%.
Activation rate = (666 / 1,000) x 100 = 66.6%
Before you ship: Confirm the activation event is instrumented and firing correctly in staging before the feature goes live. If you wait until production to verify this, your first two weeks of data will be unreliable, and you will have no clean launch-day baseline for the cohort that encounters the feature at release.
Agent lens: For agent users, activation means a successful first task completion via API or MCP call. Define a separate activation event for agents before tracking this metric; otherwise agent activations inflate your numbers in ways that do not reflect human onboarding quality.
Adoption stage metrics
Adoption is where users build the product into their working habits. At a team shipping eight features a quarter, adoption tracking is also the primary signal for which features to iterate on and which to retire. If the adoption threshold was not defined before launch, the post-launch retrospective becomes an argument about what “good enough” adoption looks like rather than a data-driven decision.
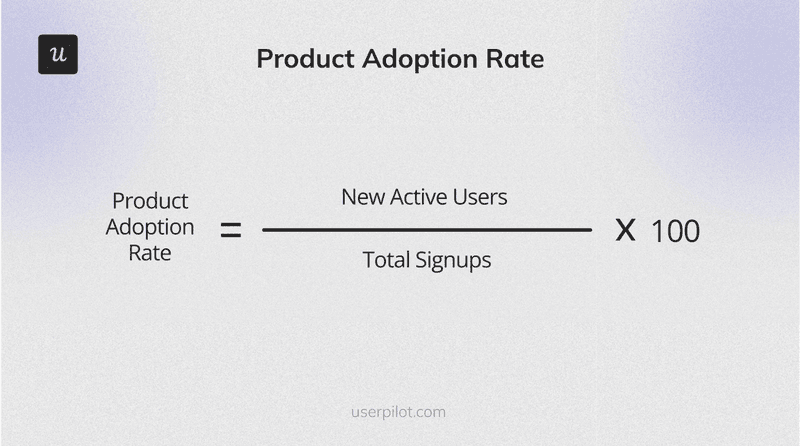
5. Product/feature adoption rate
The feature adoption rate is the percentage of users who use a specific feature regularly. High adoption indicates the feature is solving a real problem. Low adoption (under 10% at six months) is a signal to investigate or retire the feature, but the investigation is is only actionable if the adoption threshold was defined precisely before launch, not estimated afterward.
To calculate: define what “regular use” means for this feature (a frequency threshold), then divide users meeting that threshold by total users and multiply by 100. If 200 out of 1,000 users use a feature at least twice a week, adoption is 20%.
Adoption rate = (200 / 1,000) x 100 = 20%
Userpilot’s feature adoption tracking lets you tag events without code and build funnel reports per feature. The standard post-launch triage is: find where drop-off happens, watch session replay at that step, run a survey to understand the reason, then build the fix. All of this is faster and cleaner when the adoption event was defined and instrumented before the feature shipped.
Before you ship: Write the adoption threshold in one sentence before launch: “A user has adopted this feature when they have [done X] at least [N] times in [Y days].” This definition determines what the adoption rate actually measures, and it must be set before the feature exists so you have a day-one baseline.
Agent lens: A single agent can call a feature endpoint thousands of times in a day, which will dominate any adoption percentage that includes agent traffic. Filter agent API calls separately before calculating human feature adoption.
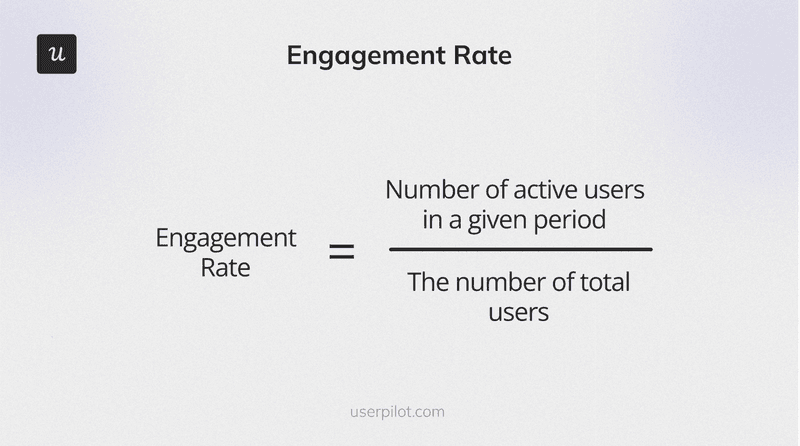
6. User engagement rate
User engagement rate measures how frequently and deeply users interact with your product in a given period. It is the broadest adoption-stage signal and the one most likely to mislead you if you have not defined “meaningful engagement” before launch. A login does not count as meaningful engagement. Completing a core task in the feature does, and that definition has to be set before the feature exists.
To calculate: divide active users who interact with the product by total users in a period, multiply by 100. If 800 out of 1,000 active users interact in a week, the engagement rate is 80%.
Engagement rate = (800 / 1,000) x 100 = 80%
Before you ship: Define which events count as meaningful engagement for this feature specifically. Generic engagement metrics not tied to a specific action are nearly impossible to use as a post-launch diagnostic tool. Tie it to a feature-level outcome, not a session-level event.
Agent lens: Raw engagement rate is the metric most likely to be inflated by agent traffic. One agent completing tasks every minute will dominate the interaction count. Replace raw engagement with a “meaningful engagement” filter tied to successful outcomes, and track agent and human engagement separately.
Retention stage metrics
Retention is where the full cost of the measurement gap shows up. If you did not define activation and adoption metrics before the feature shipped, retention becomes undiagnosable: accounts start churning and you cannot trace which feature, which onboarding gap, or which cohort caused it. A retention metric defined before launch is a diagnostic tool. Defined six months later, it is just a number that tells you something already went wrong.
7. Daily active users / Monthly active users
Active users are those who use the product meaningfully within a given period. The DAU/MAU ratio measures product stickiness: how often users return relative to how many use it at all. A high ratio signals that users find enough value to build the product into their routine, which is a leading indicator of retention. Any feature that changes the core usage loop needs its active-user baseline set before it ships.
Before you ship: Write the active user definition for this feature before instrumentation starts: does using this feature count as an active session? Does it require completing a specific action or just opening the feature? Agree on this with engineering before launch, or your DAU and MAU counts will be inconsistent across releases.
Agent lens: DAU/MAU breaks down completely for agent traffic. Agents do not have “days” and can fire thousands of events in a single session. Replace the stickiness ratio with “active task runs per account per week” for the agent stream, and track the human DAU/MAU ratio separately.
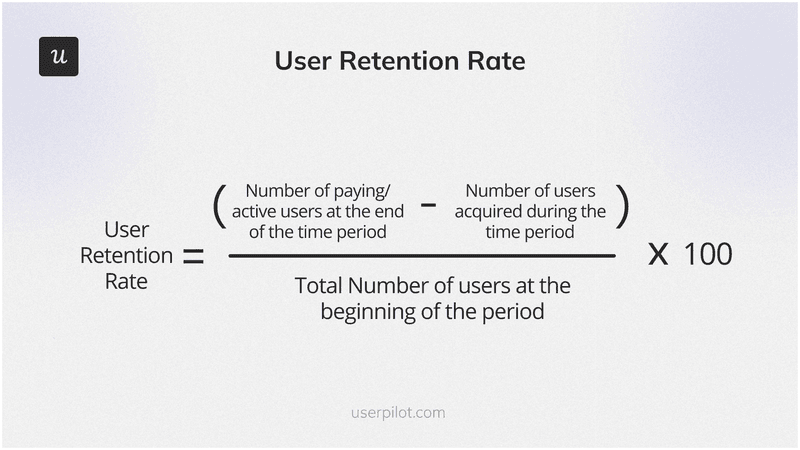
8. Customer retention rate
The customer retention rate is the percentage of users who continue using your product over a specified period. To calculate: subtract new customers acquired during the period from customers at period end, divide by customers at period start, multiply by 100. Starting with 1,000 customers, acquiring 300, and ending with 1,200 gives a retention rate of 90%.
Retention rate = ((1,200 – 300) / 1,000) x 100 = 90%
Retention is the metric that shows whether the features you shipped made the product stickier. Without cohort-level tracking defined before launch, you cannot isolate which feature affected which retention curve. Every post-launch analysis becomes a guessing game about what changed and when, exactly the situation that compounds when your team is shipping eight features a quarter.
Before you ship: Define the cohort window and retention checkpoint for this feature release. Week 1, week 4, and week 8 retention tell you very different things about feature stickiness. Agree on which checkpoint is the primary signal before launch, so the post-launch review is measuring what you intended.
Agent lens: An account can show strong human retention while the agents inside it are silently failing. Cross-reference retention data with agent failure rates and task completion rates on the same accounts. When those signals diverge, you are looking at a churn risk the retention metric alone will not surface.
Referral stage metrics
Referral metrics capture whether users value your product enough to recommend it. Most teams define these last, which means they get an NPS score with no way to connect it to the specific feature that drove it. A referral metric defined before a major release becomes a signal about that release. Defined six months later, it is just a company-wide average that cannot be tied to anything you built.
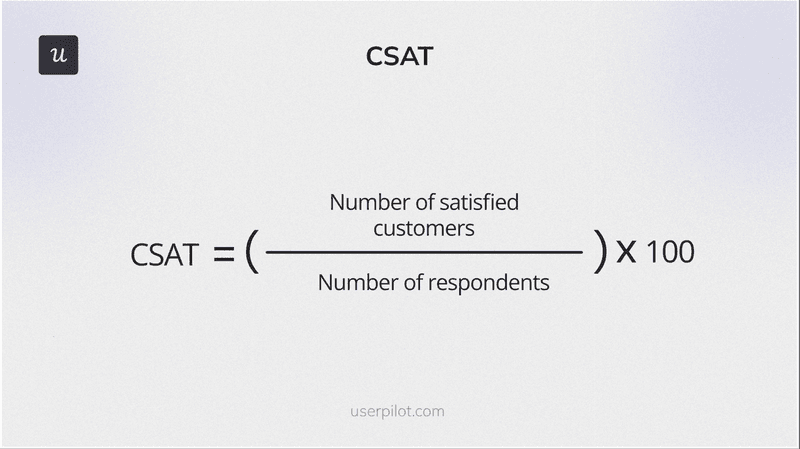
9. Customer satisfaction score
The customer satisfaction score (CSAT) measures how satisfied users are with a specific product interaction or feature. Users rate satisfaction on a 1-to-5 scale; 4s and 5s count as satisfied. To calculate: divide satisfied responses by total responses and multiply by 100. If 400 out of 500 respondents rate their experience 4 or 5, CSAT is 80%.
CSAT = (400 / 500) x 100 = 80%
Before you ship: Decide which specific interaction will trigger the CSAT survey for this feature and set your target score. A CSAT trigger defined post-launch almost always becomes a generic “how are we doing?” survey that cannot be tied to any particular release.
Agent lens: Agents cannot fill in CSAT surveys. If a significant share of your usage is agent-driven, your CSAT sample is unrepresentative. Supplement it with implicit satisfaction signals: task acceptance rate, re-prompt rate, and whether the human approves or reverts the agent’s output.
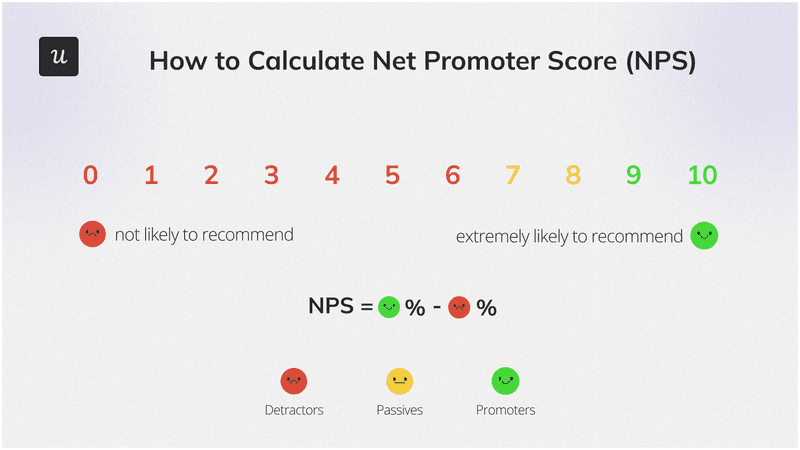
10. Net Promoter Score
Net Promoter Score (NPS) measures how likely users are to recommend your product to others. Respondents are classified as promoters (9-10 on a 10-point scale), passives (7-8), or detractors (1-6). Your NPS is the promoter percentage minus the detractor percentage. If 60% are promoters and 20% are detractors, your NPS is 40.
NPS = % Promoters – % Detractors = 60% – 20% = 40
Before you ship: Agree on the segment, timing, and target score for NPS collection tied to this release. Without a segment and timing definition set pre-launch, the NPS you collect afterward will be a company-wide average with no connection to this feature.
Agent lens: NPS only captures human users willing to respond to a survey. A human who loves your UI can give a 9 while the agent integration they depend on fails 30% of the time. For agent-heavy accounts, add resolution rate and failure rate as satisfaction proxies alongside NPS.
Revenue stage metrics
Revenue metrics are lagging by design. They only become useful diagnostic tools when the upstream metrics they depend on (activation, adoption, retention) were defined and tracked from launch day, not reconstructed six months later. A feature that drives MRR growth is invisible as a cause if you never measured its adoption. You know revenue went up; you do not know which feature moved it.
11. Customer lifetime value
Customer lifetime value (LTV) estimates the total average revenue expected from a single customer across the full relationship. A healthy LTV:CAC ratio for SaaS is at least 3:1. To calculate: multiply average monthly revenue per customer by average customer lifespan in months. A customer paying $249 per month who stays for five years has an LTV of $14,940.
LTV = $249 x 12 x 5 = $14,940
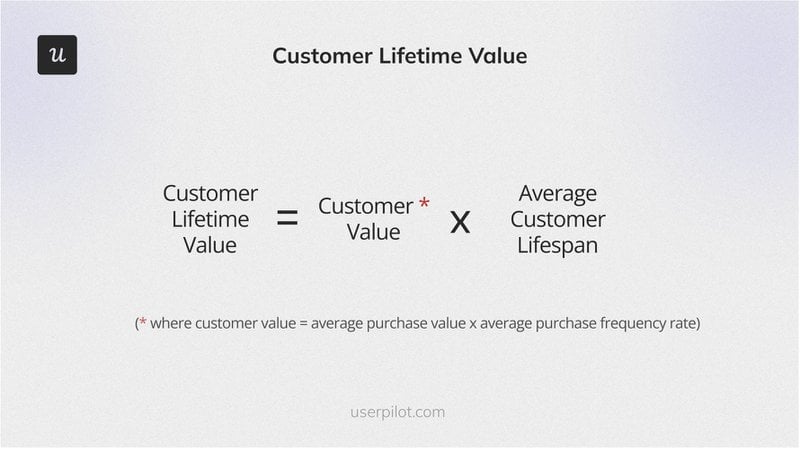
Before you ship: Define the revenue model impact of this feature before it launches. Does it drive upsell, reduce churn in a specific tier, or increase usage volume on usage-based pricing? The LTV signal from a feature is only readable if you defined which revenue path it was supposed to affect before users touched it.
Agent lens: On usage-based pricing, agent users often drive significantly higher LTV than human users because their task volume is an order of magnitude larger. Track LTV separately for agent accounts, or the average will distort your acquisition and retention investment decisions.
12. Monthly recurring revenue
Monthly recurring revenue (MRR) is the predictable income your business generates from subscriptions each month. To calculate: multiply average revenue per user by total paying accounts. With 100 customers each paying $249 per month, MRR is $24,900.
MRR = $249 x 100 = $24,900
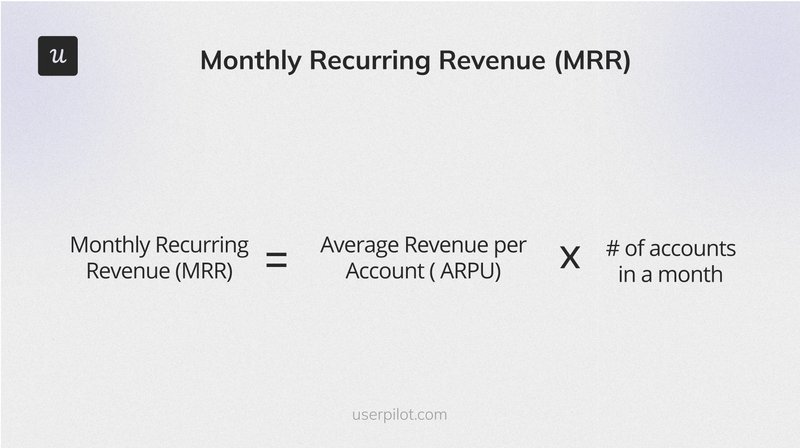
Before you ship: Know which pricing tier this feature is expected to drive or protect before it goes live. If the feature targets expansion revenue, set the MRR expansion target before launch. Without this, your post-launch review will show MRR moved but you will have no way to attribute it to this feature.
Agent lens: Agent-driven usage creates MRR volatility that human-driven MRR does not. A single agent integration can spike usage 10x, and if that agent is deprecated, MRR can drop just as fast. Segment MRR by account type to catch concentration risk before it hits your renewal forecast.
Define the metric before you build the feature, every single time
The measurement gap is not a technology problem. Every tool you need to define and track these 12 metrics exists and is accessible right now. It is a sequence problem: most teams define metrics after a feature ships instead of before it enters the build queue, and at current shipping velocities, that sequence produces a compounding backlog of unmeasured features that gets harder to unwind with every sprint.
Faster shipping does not automatically mean better products. It means more features, more quickly, and without the measurement discipline to match, it means more features that shipped into silence. The pre-launch checklist is simple: goal at discovery, framework and metric selection before sprint planning, instrumentation before development, dashboard before launch. Run it every time, for every feature, without exception.
If you want to see how Userpilot handles instrumentation and visualization across both human and agent user streams from a single platform, book a demo. The product analytics layer covers the human-side metrics, and the Agent Analytics module launching this quarter adds task completion tracking, resolution rate, and failure signals for AI agent users alongside the standard event taxonomy.
FAQ
What is a good product success metric?
A good product success metric traces to a business goal and measures an outcome, not an activity. “Users who complete the activation milestone within 7 days” passes because it predicts retention. “Total logins per week” does not because a user can log in without getting any value. The faster your team ships, the more critical this distinction becomes: activity metrics always look good when launch velocity is high, regardless of whether any of those features are actually working.
When should you define success metrics for a product?
During discovery, before the feature enters the build queue. Defining metrics after a feature ships means you have no baseline, no cohort definition, and no event instrumentation for the data you want, so whatever you measure post-launch is incomplete at best and misleading at worst. If a feature is already live and unmeasured, instrument it now. Historical data with gaps is still more useful than no data at all.
How do you measure product success in 2026?
Use the AAARRR framework as your spine, define your North Star metric first, run the framework check before each feature enters sprint planning, and track both human and agent traffic separately if your product has any API or MCP-accessible surfaces. None of the mechanics have changed. Doing all of this before launch rather than after is simply more urgent than it has ever been.
How do you know if you have chosen the wrong metrics?
Three signals: the metric is trending up while the product is clearly struggling, the team is optimizing for the metric in ways that do not actually help users, or no one on the team can connect the metric to a business goal when asked directly. Run the framework check when any of these apply: does this metric trace back to your North Star? Any metric that cannot complete that chain should be replaced with one that can.
How do you link metrics to business goals when the connection is not obvious?
Work backwards from the business goal and ask what user behavior predicts it. Retention predicts revenue, which means improving activation improves retention, and shortening time to value improves activation. The causal chain from revenue back to TTV gives every metric along it a clear reason to exist. If you cannot complete that chain for a metric you are currently tracking, it is not connected to the goal and it can go.
About the author