Top 12 SaaS User Engagement Metrics & How To Measure Them


What are user engagement metrics?
First, let’s define user engagement. User engagement indicates the level of active involvement and interaction that users have with your product.
User engagement metrics are the data that you can measure based on these interactions.
How to select the right user engagement metrics?
There are many different user engagement metrics that you can track, but not all of them are created equal. The right metrics for you will depend on your specific product or service, as well as your goals. Here are a few things to keep in mind when selecting user engagement metrics:
- Your goals: What do you want to achieve with your SaaS product? Are you looking to increase customer retention, improve customer satisfaction, or something else? Once you know your goals, you can select metrics that will help you track your progress.
- Actionable insights: Identify the key actions or behaviors that indicate user engagement contributing to your product goals. For example, if your goal is to increase user activation, a relevant metric could be the percentage of users who complete the onboarding process.
- Comparison ability: Consider metrics that allow you to monitor your performance over time or compare against industry benchmarks or competitors. For instance, you can track user engagement metrics like feature adoption rate over time to monitor progress or benchmark them against industry averages.
12 SaaS customer engagement metrics you should track to drive growth
We aren’t here to show you a giant list of metrics for you to scroll through and not have any takeaways from. Instead, we will give you our top 8 most common and valuable user engagement metrics to track and their use cases for your SaaS.
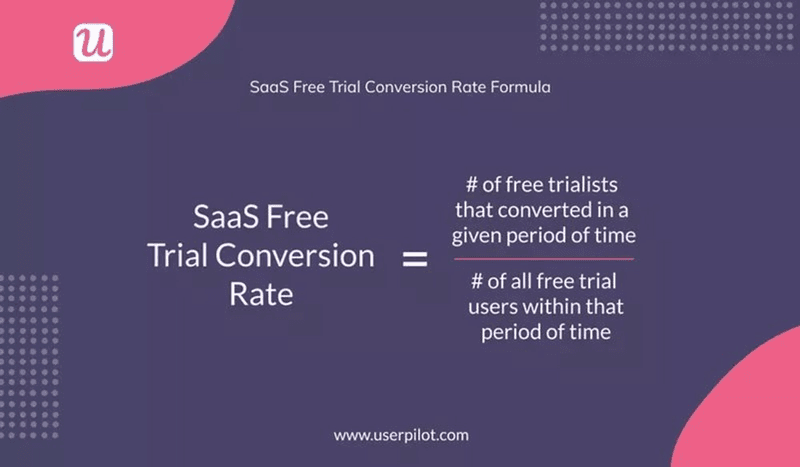
Trial to paid conversion rate
The trial-to-paid conversion rate is an engagement metric that measures the percentage of users who move from a free trial to a paid account. It reflects the level of user engagement and commitment to the product, as users transition from trying out the product to becoming paying customers.
You can use the metrics to evaluate the effectiveness of your product’s trial experience and value proposition in driving customer engagement.
To calculate it, divide the number of users who upgraded from the free trial to a paid account by the total number of users in the free trial during a specific period.
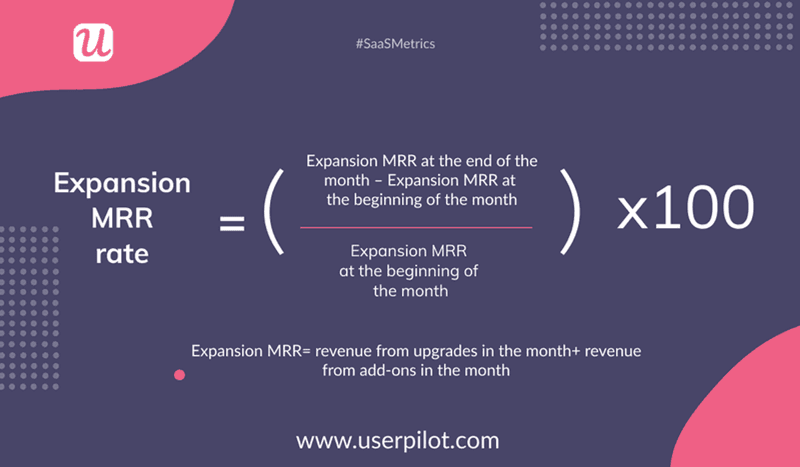
Freemium to premium conversion rate
The freemium to premium conversion rate is an engagement metric that measures the percentage of users who transition from a free version with limited features to a paid version with premium features.
A higher conversion rate signifies stronger engagement and indicates that users see enough value in the premium features or benefits to make the transition.
Expansion Monthly Recurring Revenue (MRR) is the best method for calculating your freemium-to-premium conversion rate, as it simplifies and enhances accuracy.
To calculate the freemium-to-premium conversion rate using Expansion MRR, subtract the starting MRR from the ending MRR, divide by the starting MRR, and multiply by 100.
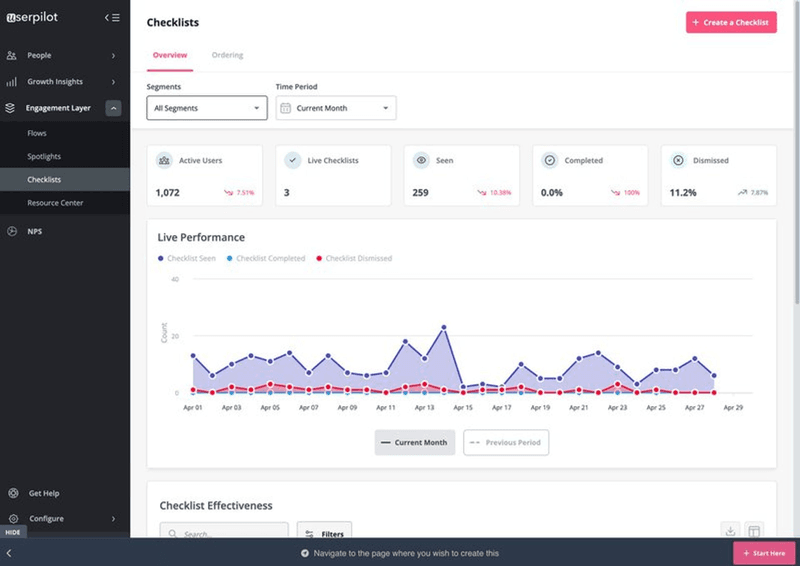
Product onboarding engagement rate
Product onboarding engagement rate measures the level of user engagement during the onboarding process. It indicates how effectively users are interacting with and adopting the product features and functionalities upon initial usage.
To track this metric, you can monitor how users engage with onboarding elements like onboarding checklists, interactive walkthroughs, etc., and calculate the completion rate.
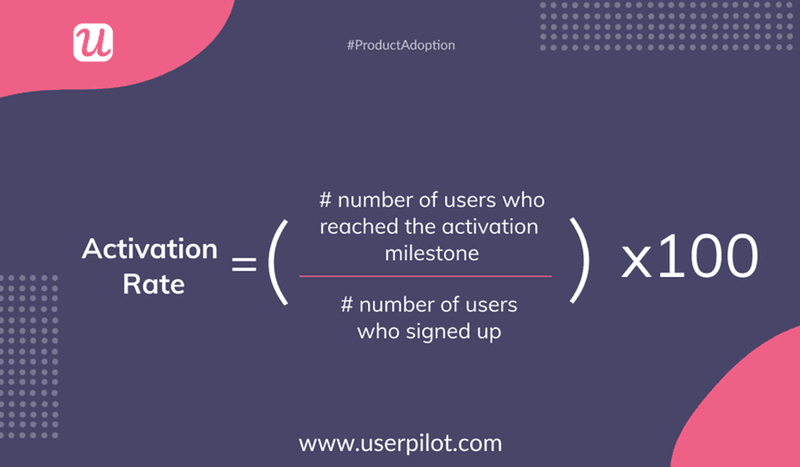
User activation rate
As much as we want to give you a definite answer on what a good activation rate is, unfortunately, it is impossible to create a solid SaaS benchmark.
The actions and experiences are too varied. Specific in-app events need to happen for a specific persona to get the benefits of your product.
So before calculating your rate – you need to make sure you’ve separated your new users into cohorts by the different personas and calculate the rates separately for each cohort.
User activation rate is the number of users activated divided by the total number of new users who signed up in a given period of time, divided by 100%.
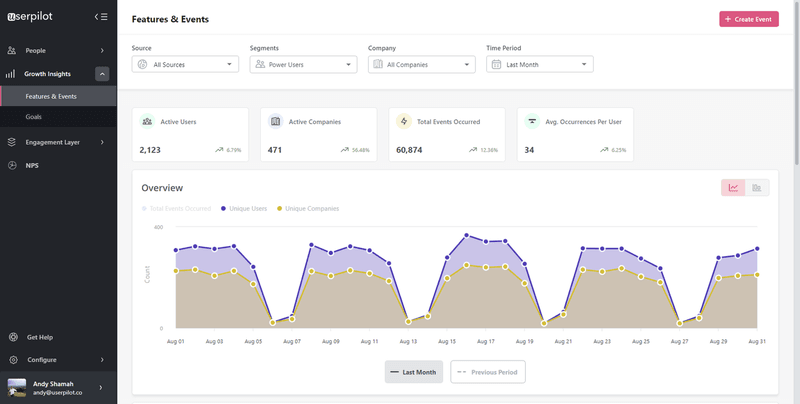
Active users
Active users are one of the important engagement metrics to measure. It is the number of users who regularly interact with your product within a specific time frame. It indicates the level of ongoing engagement and product usage.
For example, if you see a decrease in the number of active users, it means something is not working. In this case, you should crosscheck with user feedback and user behavior analysis to improve user engagement.
Product managers typically track 3 types of active users:
- Daily active users (DAUs)
- Weekly active users (WAUs)
- Monthly active users (MAUs)
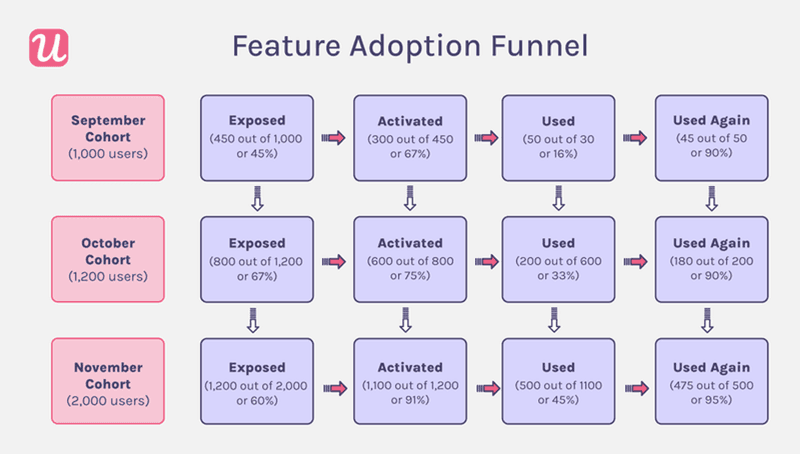
Feature adoption rate
The feature adoption rate is a user engagement metric that measures the percentage of users who have adopted a specific feature within a product. It is calculated using a feature adoption funnel that tracks the user journey from initial awareness to actual adoption.
To calculate the feature adoption rate, you need to consider four stages:
- Exposed: Divide the number of users who have encountered the feature by the total number of users, and then multiplying by 100.
- Activated: Divide the number of users who have activated it by the number of users who were exposed to the feature, and then multiplying by 100.
- Used: Divide the number of users who have used it by the number of activated users, and then multiplying by 100.
- Used Again: Dividing the number of users who have used it multiple times by the number of users who have used it at least once, and then multiplying by 100.
Core feature usage
Feature usage is part of your most important user engagement metrics. By tracking feature usage, you can determine if your product is intuitive enough for users to start gaining value immediately or if they require additional in-app guidance.
It can also indicate if users are getting enough value from your product based on their level of usage. For example, if you see that users are not engaging with a specific feature as much as you expect, you can take steps to improve the user experience or make changes to your product to better meet their needs.
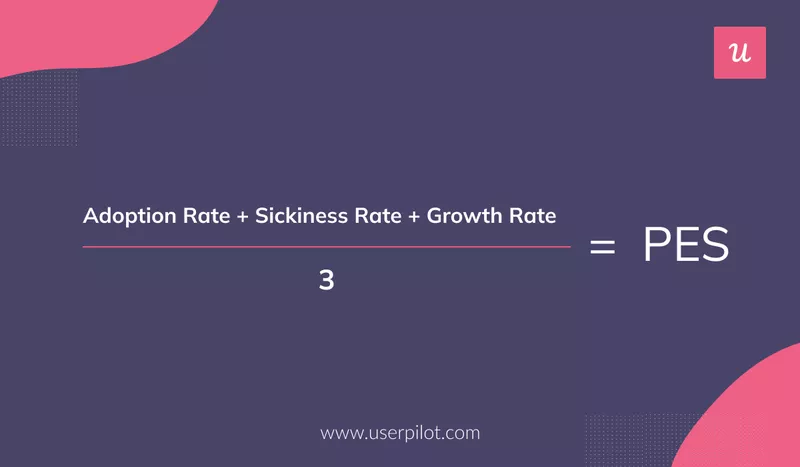
Product engagement score (PES)
The Product Engagement Score (PES) is a consolidated metric that provides a holistic view of user interactions with your product, simplifying the measurement of engagement. It allows you to evaluate your product’s performance and gain insights into customer engagement. PES encompasses three key performance indicators: product adoption, stickiness, and growth.
To effectively measure PES, it is crucial to consistently track and analyze your adoption rate, stickiness, and growth metrics.
Product adoption rate
Product adoption rate measures the percentage of users who engage with all of your product’s features. It reflects the depth of customer engagement and predicts which users may become power users or product advocates.
For instance, if a customer has used 2 out of 5 distinct features in the past month, their 30-day adoption rate would be 40%. In contrast, a user who has used all features would have a 30-day adoption rate of 100%.
Stickiness (daily active users to monthly active users ratio)
Stickiness is your daily active users divided by your monthly active users or DAU/MAU.
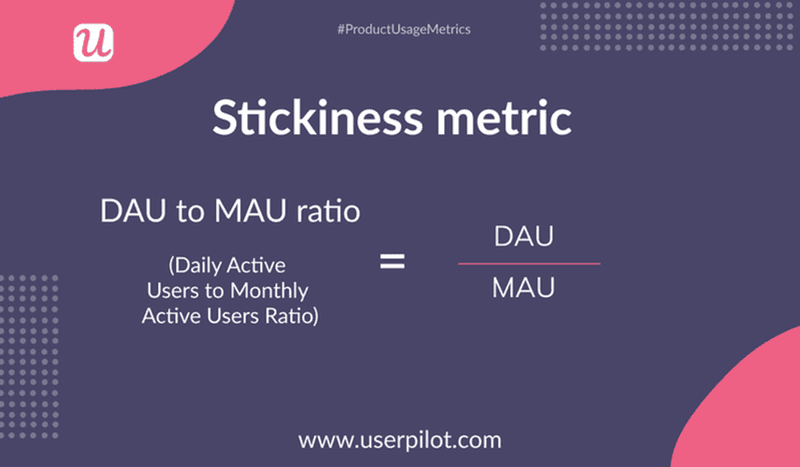
By performing this equation, you are left with a percentage that lets you know how often users are coming back to your app. For example, you may have 2000 daily active users and 5000 monthly active users. That means you have a stickiness percentage of 40%.
This is a typically low percentage for simple B2B or B2C products. Their overall goal is to have the same number of MAUs as DAUS. In other words, have their entire user base getting value from their product all day, every day.
If you have a more complex product, this stickiness rate might be good because users don’t need to log in every day and engage.
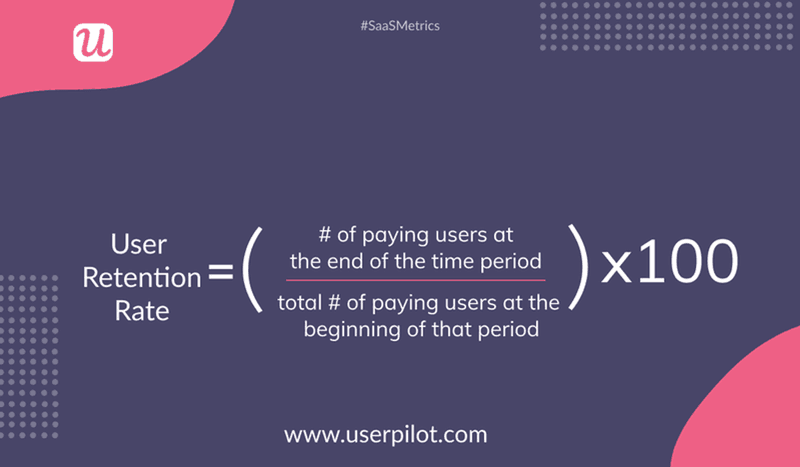
Retention rate
Retention rate is a crucial user engagement metric that measures the percentage of customers or users who continue to use your product over a specific period of time. It provides insights into the effectiveness of your product in retaining and satisfying users.
A high retention rate indicates strong user engagement and customer loyalty, demonstrating that users find ongoing value in your product. On the other hand, a low retention rate may suggest issues with user satisfaction or the need for improvements in the product experience to increase engagement and retention.
To calculate retention rate, you need to determine the number of customers or users at the beginning of a given period and then track how many of them remain active at the end of that period.
Net promoter score (NPS)
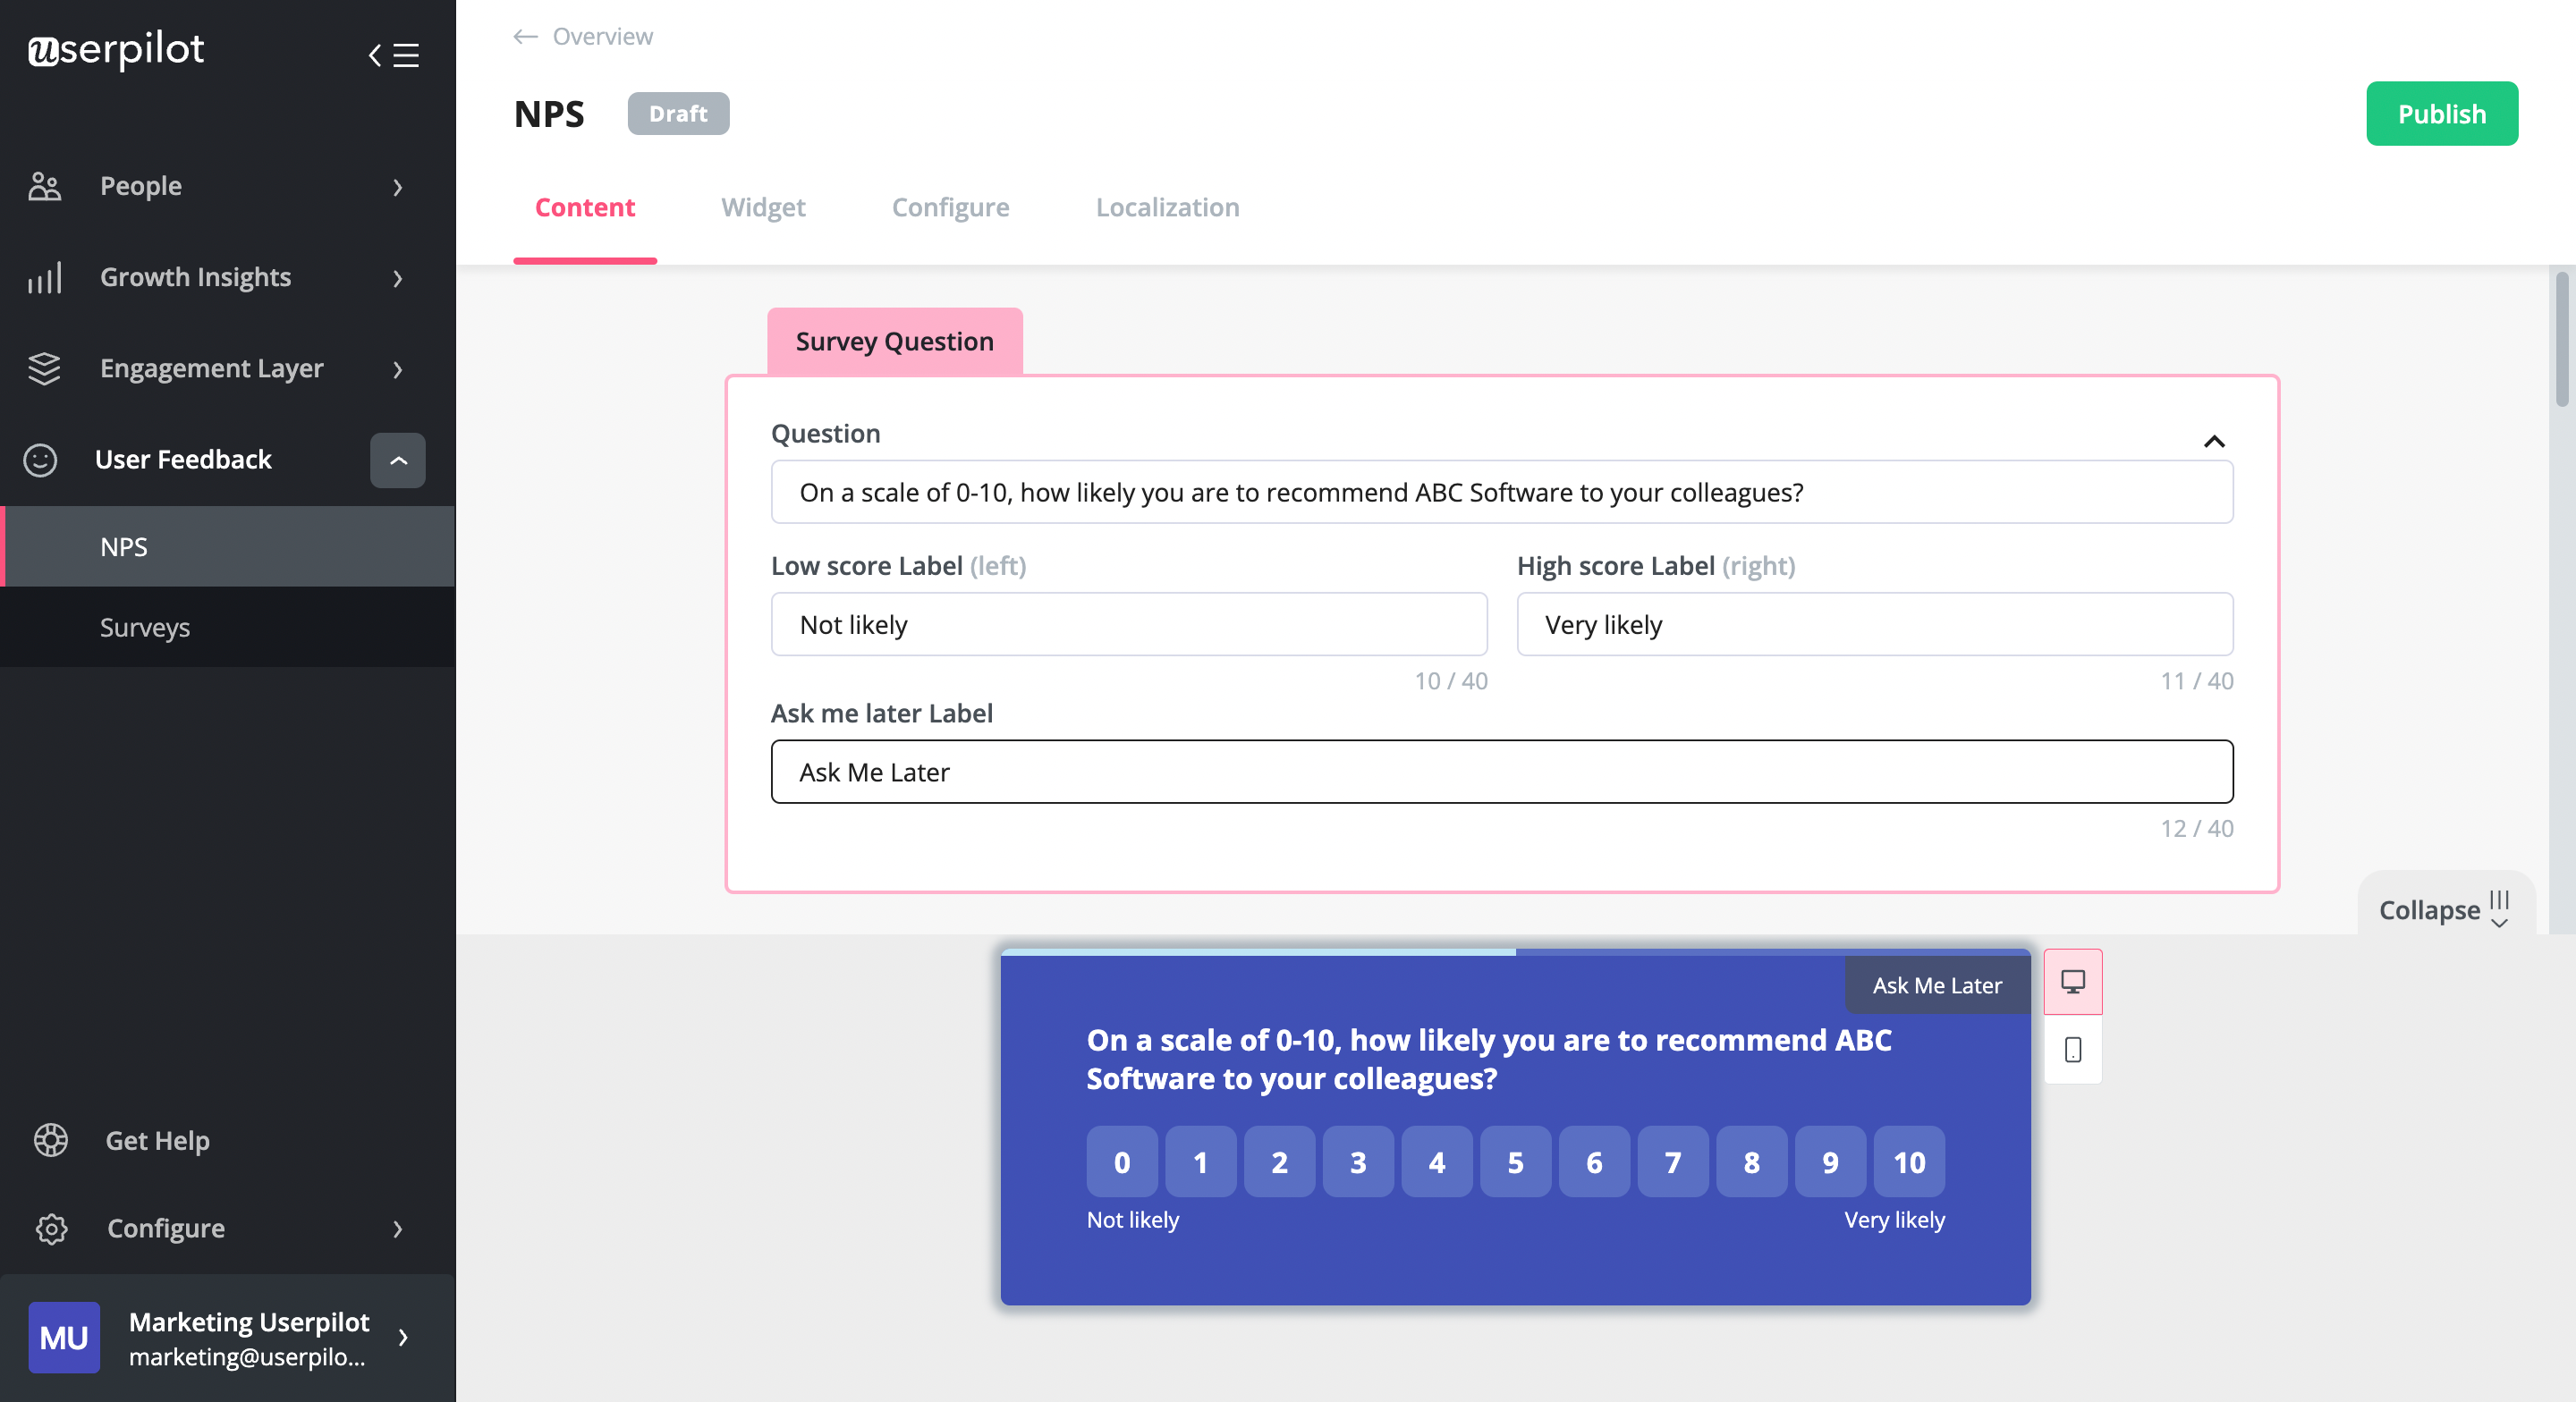
Net Promoter Score (NPS) is a widely used engagement metric that measures customer loyalty and satisfaction. It provides insights into how likely your customers are to recommend your product or service to others.
NPS is determined through a simple survey question: “On a scale of 0 to 10, how likely are you to recommend our product/service to a friend or colleague?”
Based on their responses, customers are categorized into three groups:
- Promoters (score 9-10): Highly satisfied customers who are likely to recommend your product and contribute to positive word-of-mouth.
- Passives (score 7-8): Moderately satisfied customers but not as enthusiastic in recommending your product. They are somewhat neutral in their opinion.
- Detractors (score 0-6): Dissatisfied customers who are more likely to share negative experiences, potentially harming your product reputation.
To calculate NPS, subtract the percentage of Detractors from the percentage of Promoters. The result is a score that can range from -100 to +100.
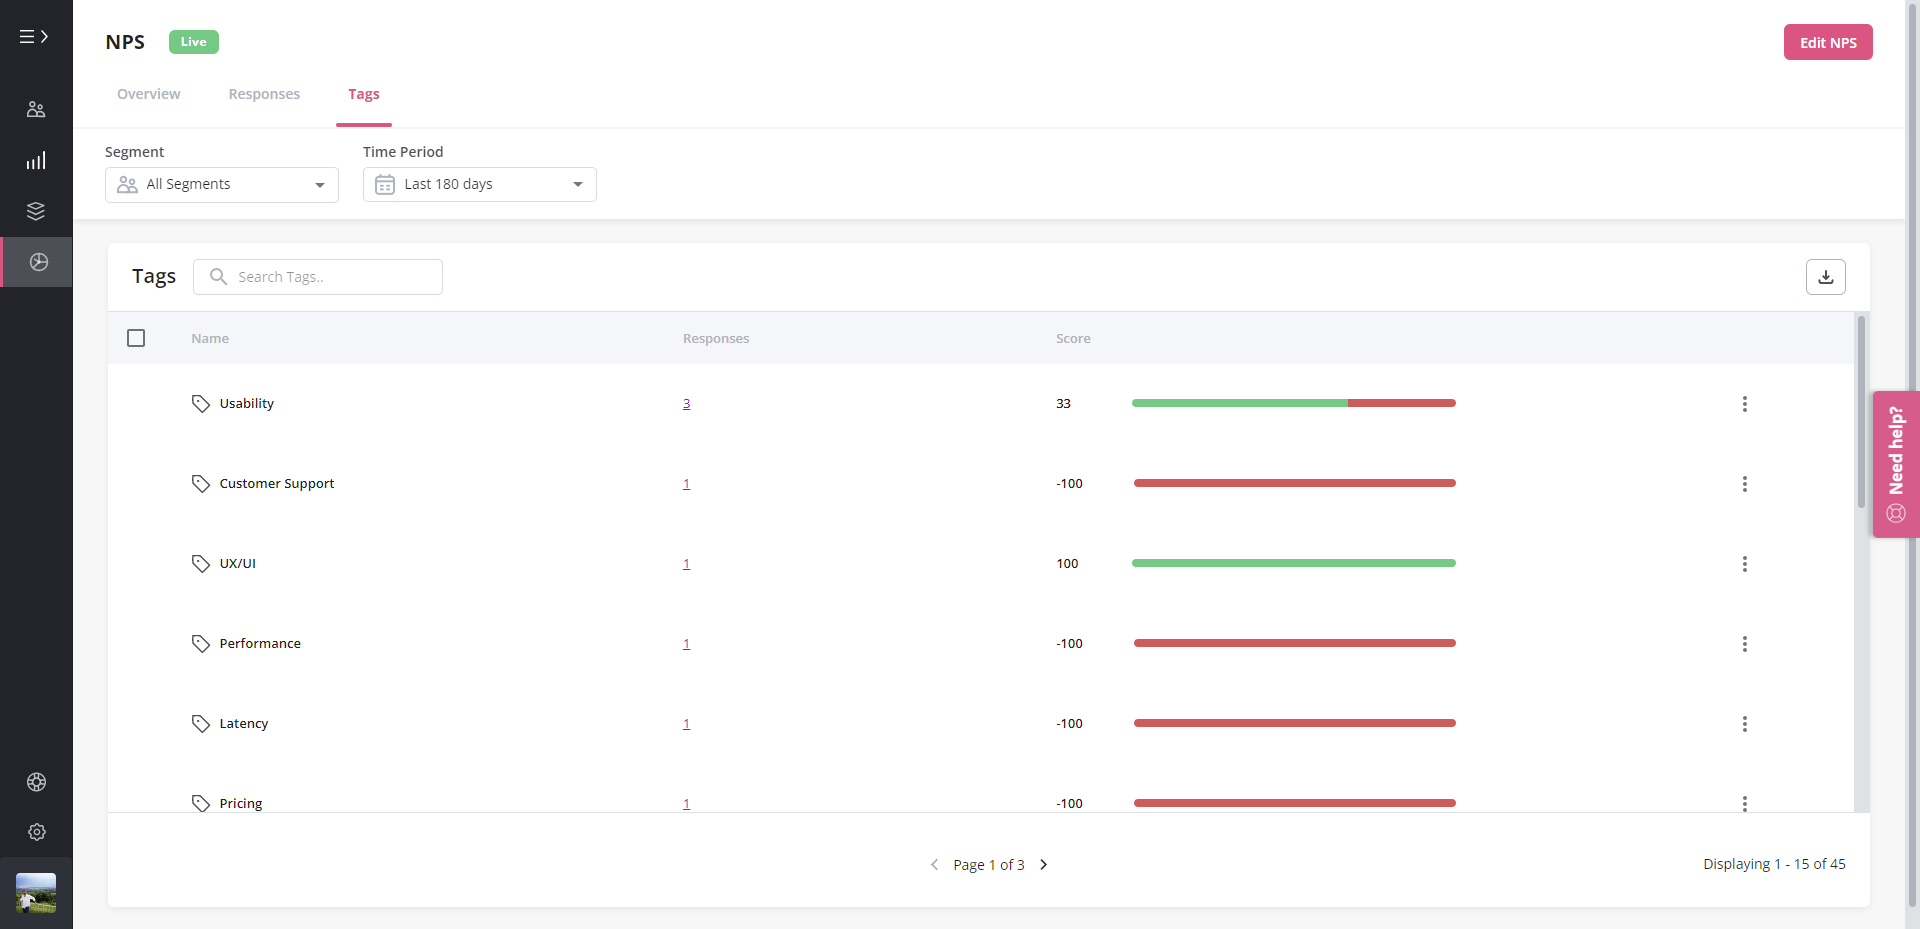
You can also use NPS surveys to collect user feedback and find improvement opportunities by adding NPS follow-up questions and tag responses.
How to measure user engagement metrics using Userpilot?
Userpilot is a powerful product adoption solution that helps businesses drive user engagement and collect valuable data to measure user engagement metrics. We’ll show you how.
Build in-app experiences that drive user engagement
Userpilot has multiple engagement layers (i.e. tooltips, modal, etc.) end experiences to help you build and gamify in-app experiences that turn new signups into engaged users.
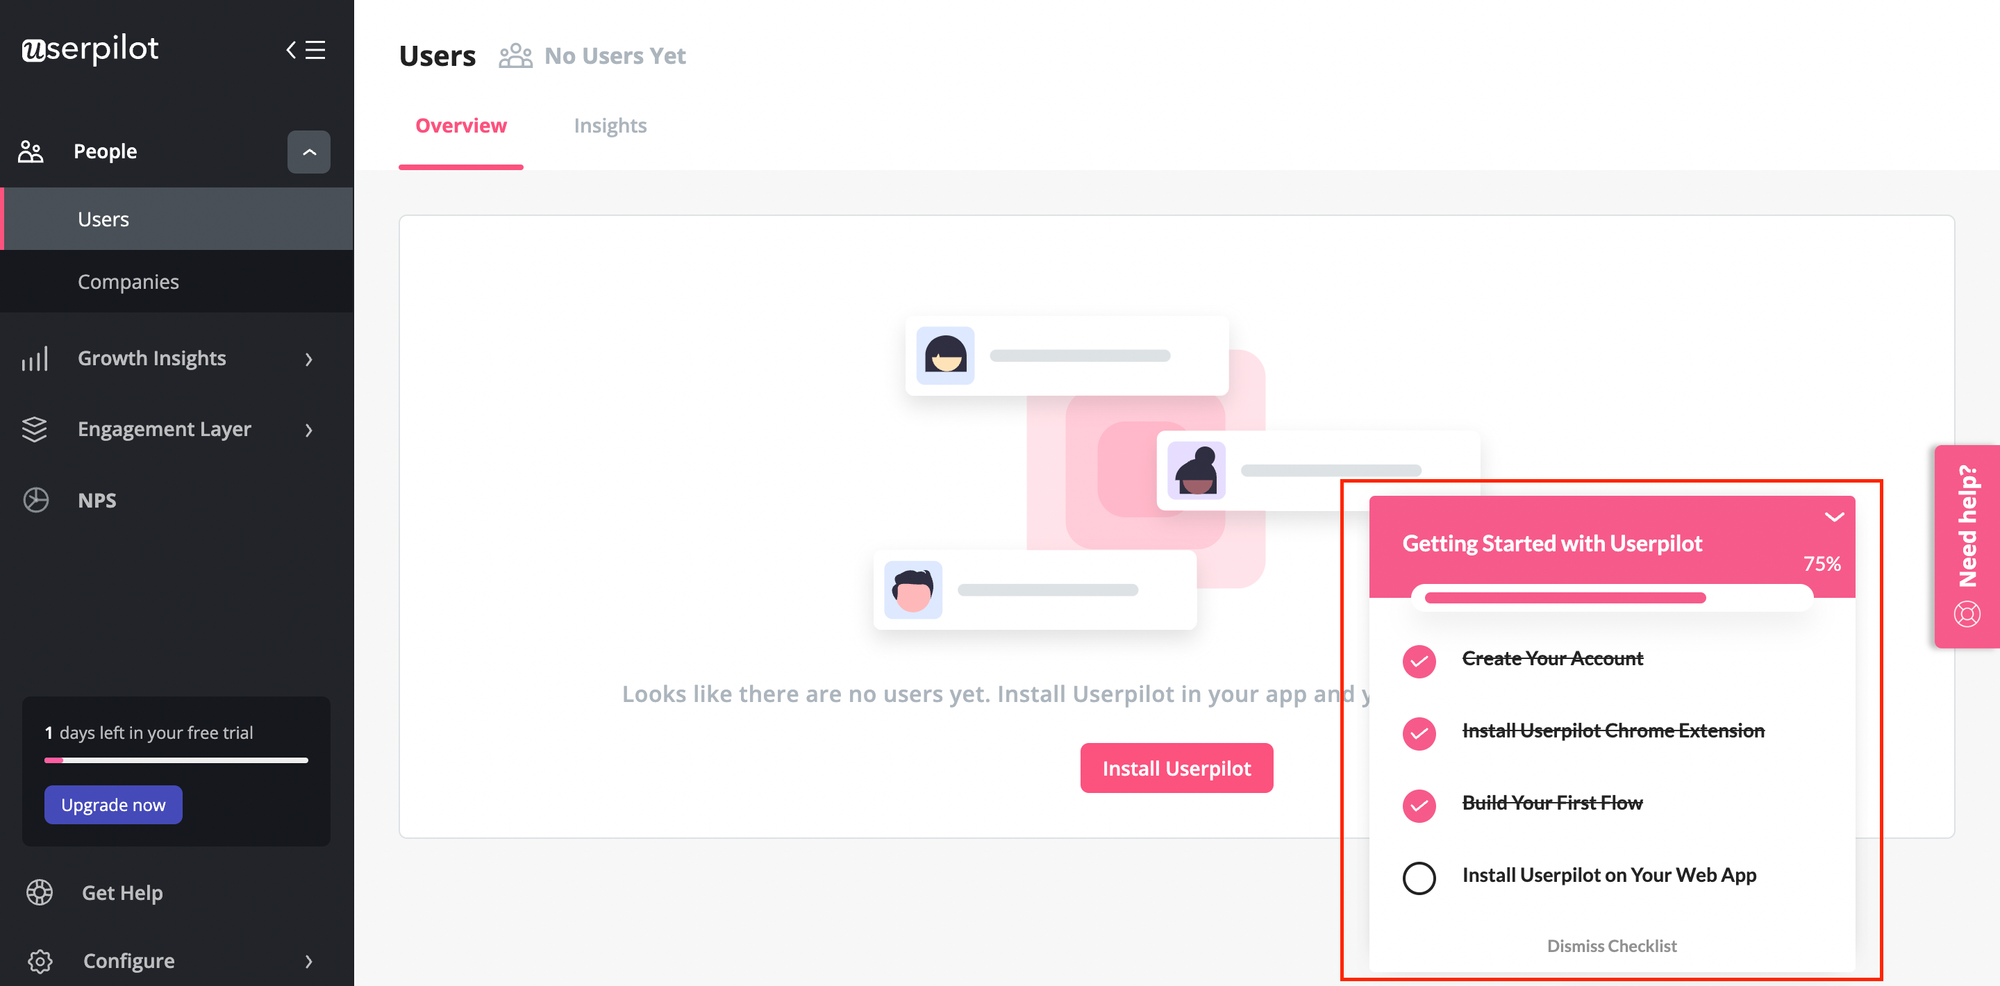
For example, you can enhance onboarding experiences and drive users towards activation by implementing an onboarding checklist with a progress bar.
Collect data for tracking user engagement metrics
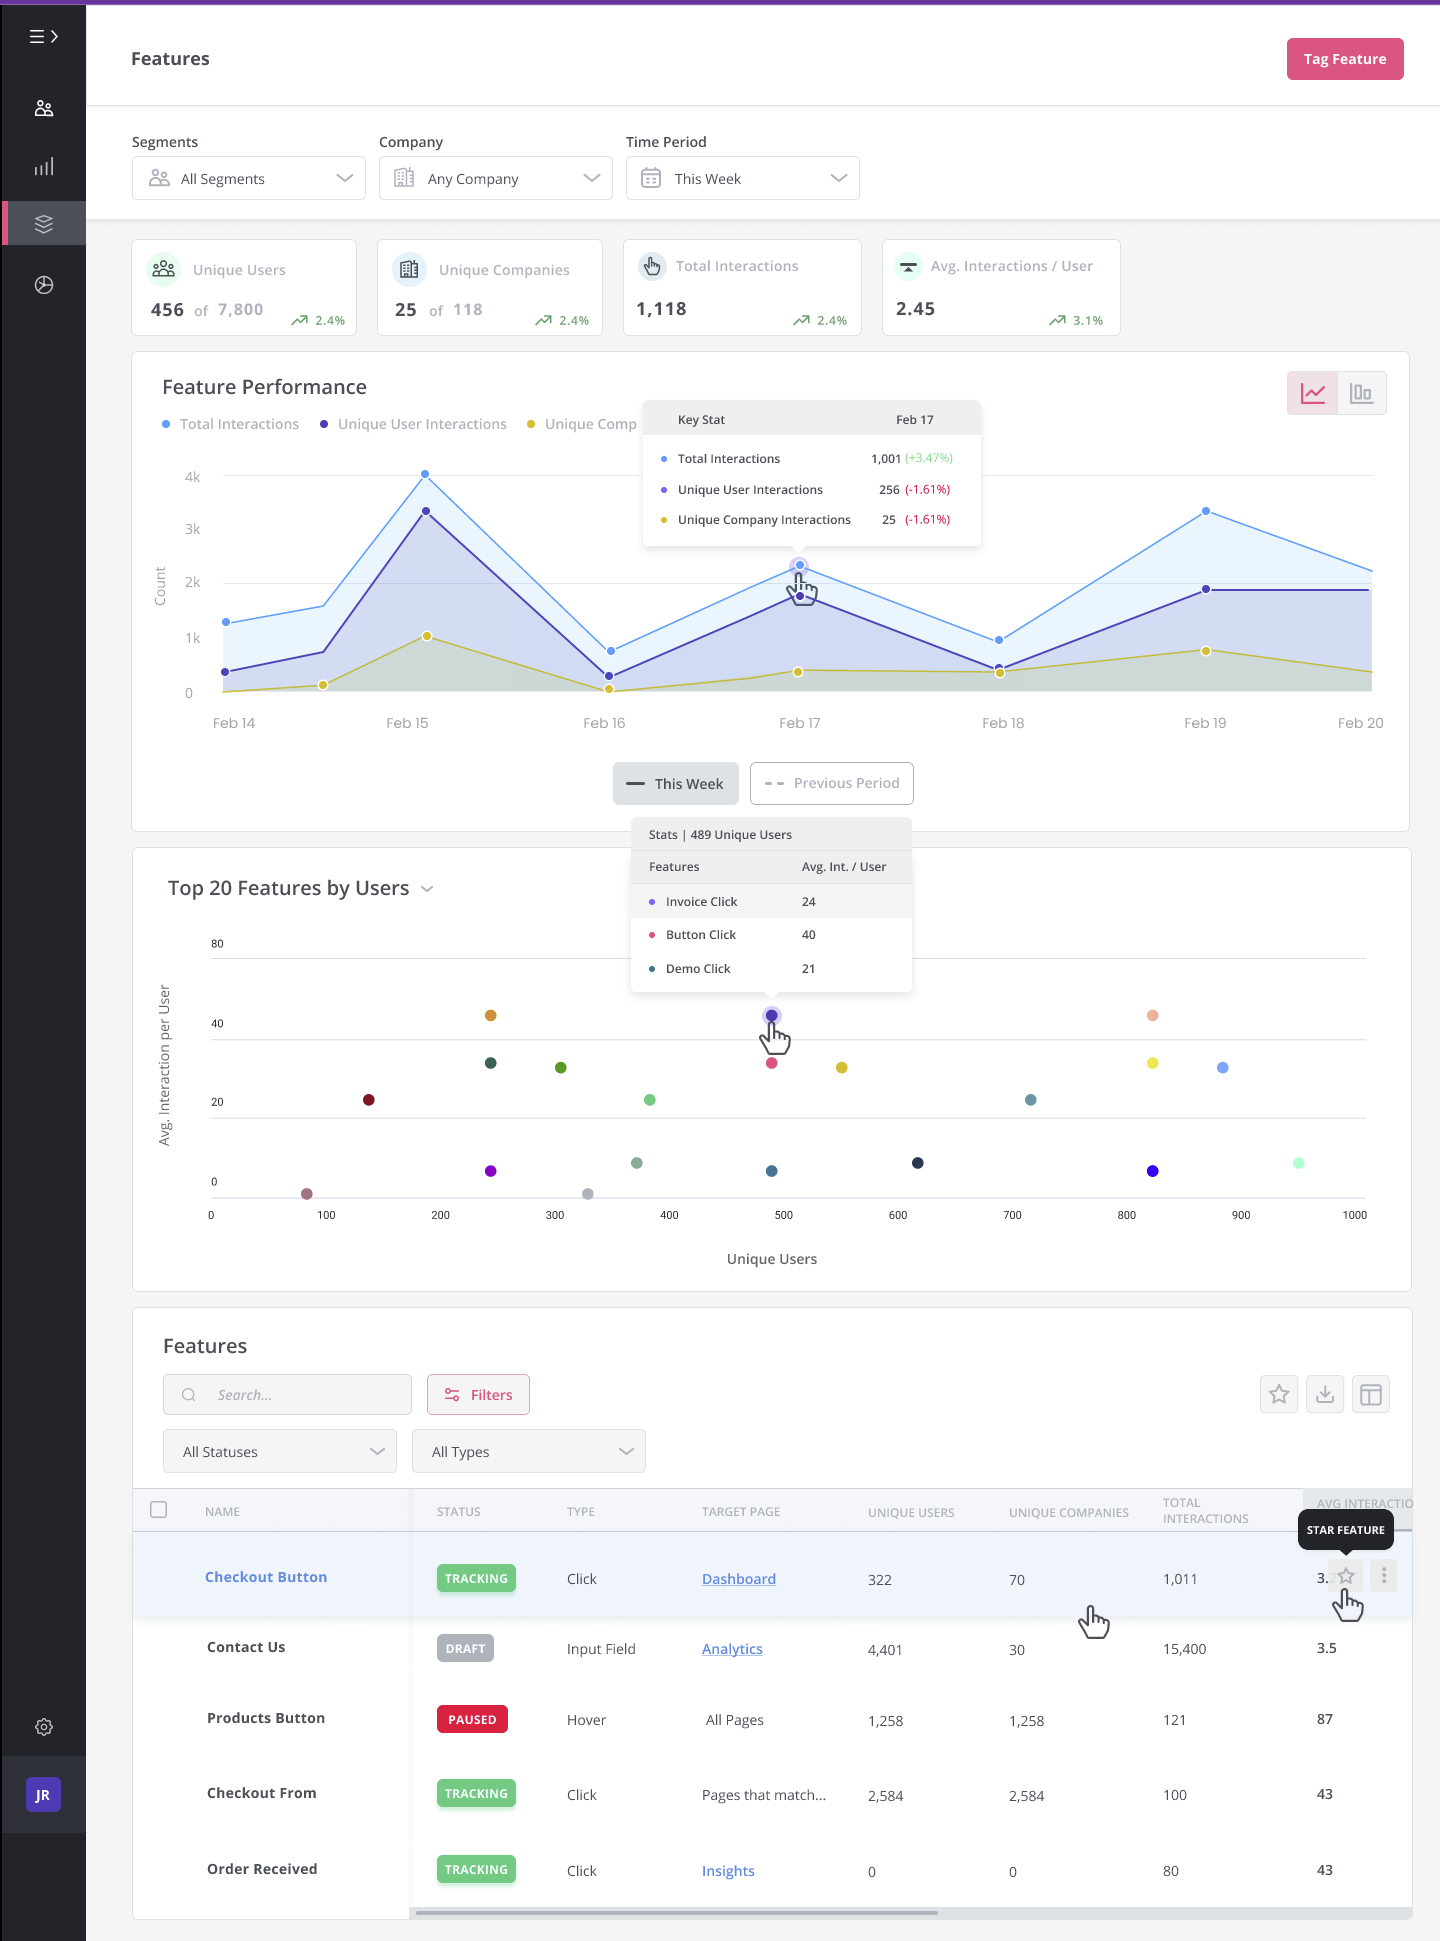
Userpilot also comes with features that help you collect data point for your engagement metrics. You can tag any feature to monitor how an entire user segment or a user spends their time with.
You can also track single events or a group of events to monitor how users move down the customer journey. This is important for calculating engagement metrics like adoption or retention rate.
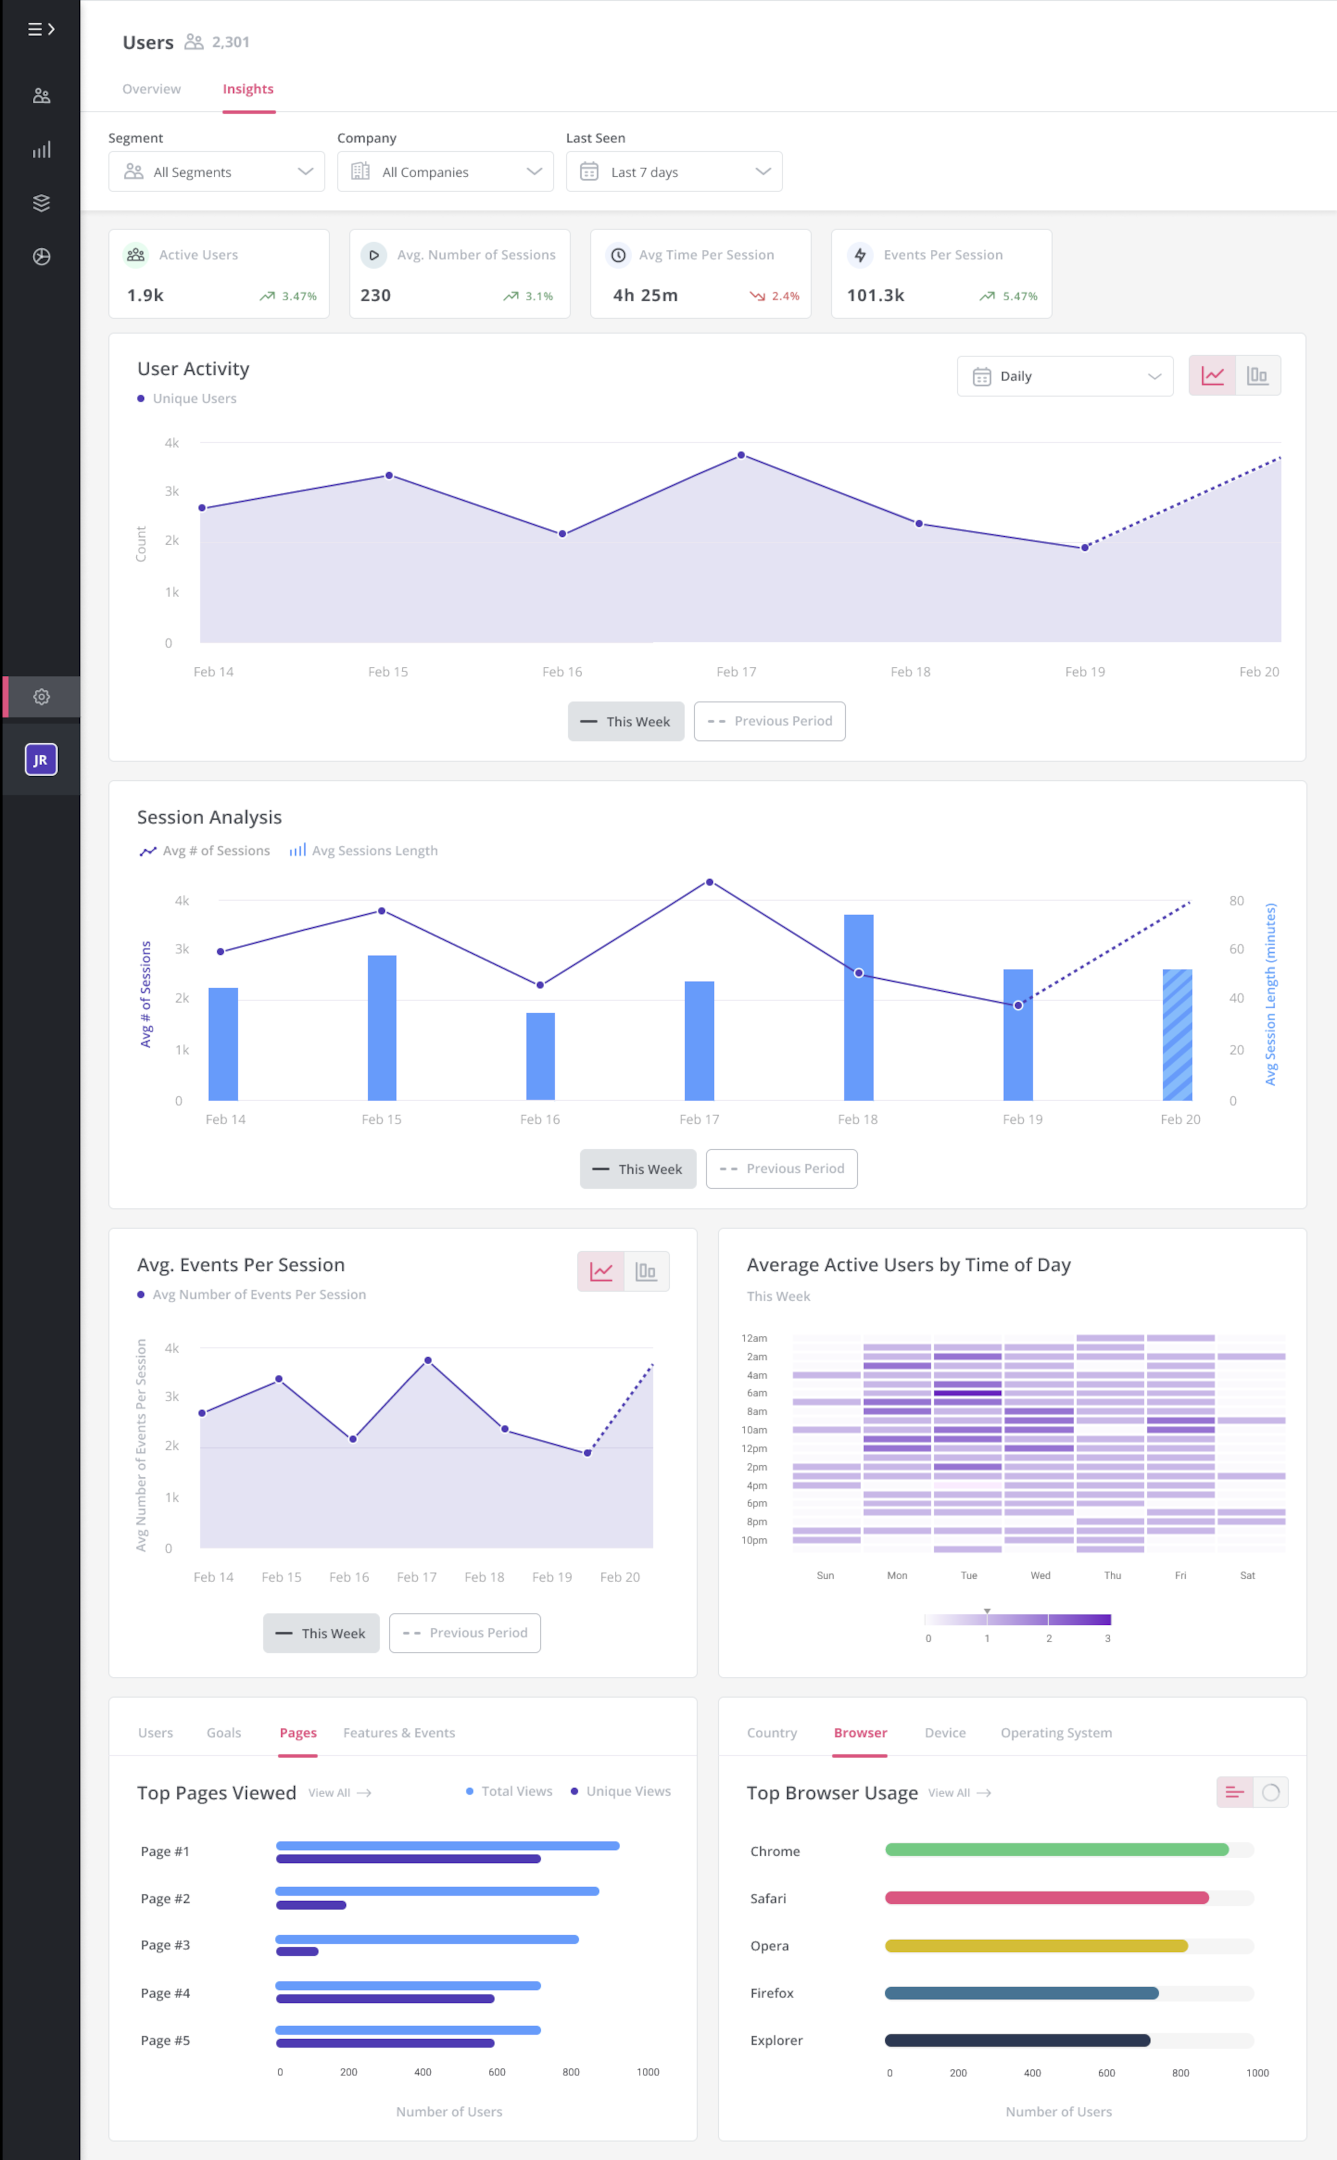
Visualize data for in-app engagement analytics
As you collect data on how users interact with your product, it’s essential to make sense of that information through clear visualizations. Userpilot helps you turn raw user actions into easy-to-understand charts and graphs that reveal how people engage with your product.
Two important ways Userpilot helps you visualize this data are through funnels and paths. Funnels show you the steps users take toward a goal, like completing onboarding or using a feature. By looking at funnels, you can quickly spot where users drop off or lose interest. Paths show you the actual journeys users take inside your product, helping you understand how they move from one action to another.
Using these visual tools, you can identify patterns and trends in user behavior, find areas where users struggle, and discover opportunities to improve engagement. This makes it easier to make informed decisions and optimize your product experience based on real user data.
Conclusion
There are tens if not hundreds of metrics that you might want to focus on in your product. However, don’t get too caught up trying to measure every action that a user takes. You might spend more time watching than actually improving your product.
High user engagement is your gateway to conversion and most importantly, retention. If you are unsure of where to begin, do an internal audit of your features and user behavior.
Want to measure and improve your engagement metrics? Get a Userpilot Demo and see how you can collect data and gain actionable insights into user engagement.
About the author