What is Usermaven? A Detailed Overview of Features and Pricing


Usermaven markets itself as a privacy-first analytics platform that helps businesses track user behavior and make smarter decisions without the clutter of traditional tools.
But is it the best tool for SaaS teams today?
In this article, I’ll walk you through Usermaven’s key features, pricing plans, pros and cons, then break down when it might make more sense to consider an alternative and which tools stand out.
What is Usermaven?
Usermaven is an all-in-one marketing attribution and analytics platform that gives teams a complete view of the customer journey, from first website visit through conversion and product usage.
It’s used by different cross-functional teams, including:
- Marketing teams want to connect ad spend directly to revenue, see which campaigns attract the most valuable customers, and optimize their marketing strategy.
- Agencies to manage analytics for multiple clients from the same place, by creating different dashboards and reports.
- Product managers to identify which features drive retention, identify friction points in the user journey, and prioritize the roadmap based on real usage data.
- Founders and executives to get a holistic view of business health without toggling between multiple tools.
Key Usermaven features
In the sections below, I’ll review Usermaven’s main use cases and real-life applications.
Autocapture
Usermaven automatically records key user events like clicks, page views, and form submissions from day one without requiring manual tagging.
This not only eliminates your dependency on developers but also ensures there are no blind spots in your data and enables retroactive analysis.
For example, when you decide next month to track clicks on your “Pricing” page, you define the event and immediately view historical data from last month without waiting for new events to accumulate.
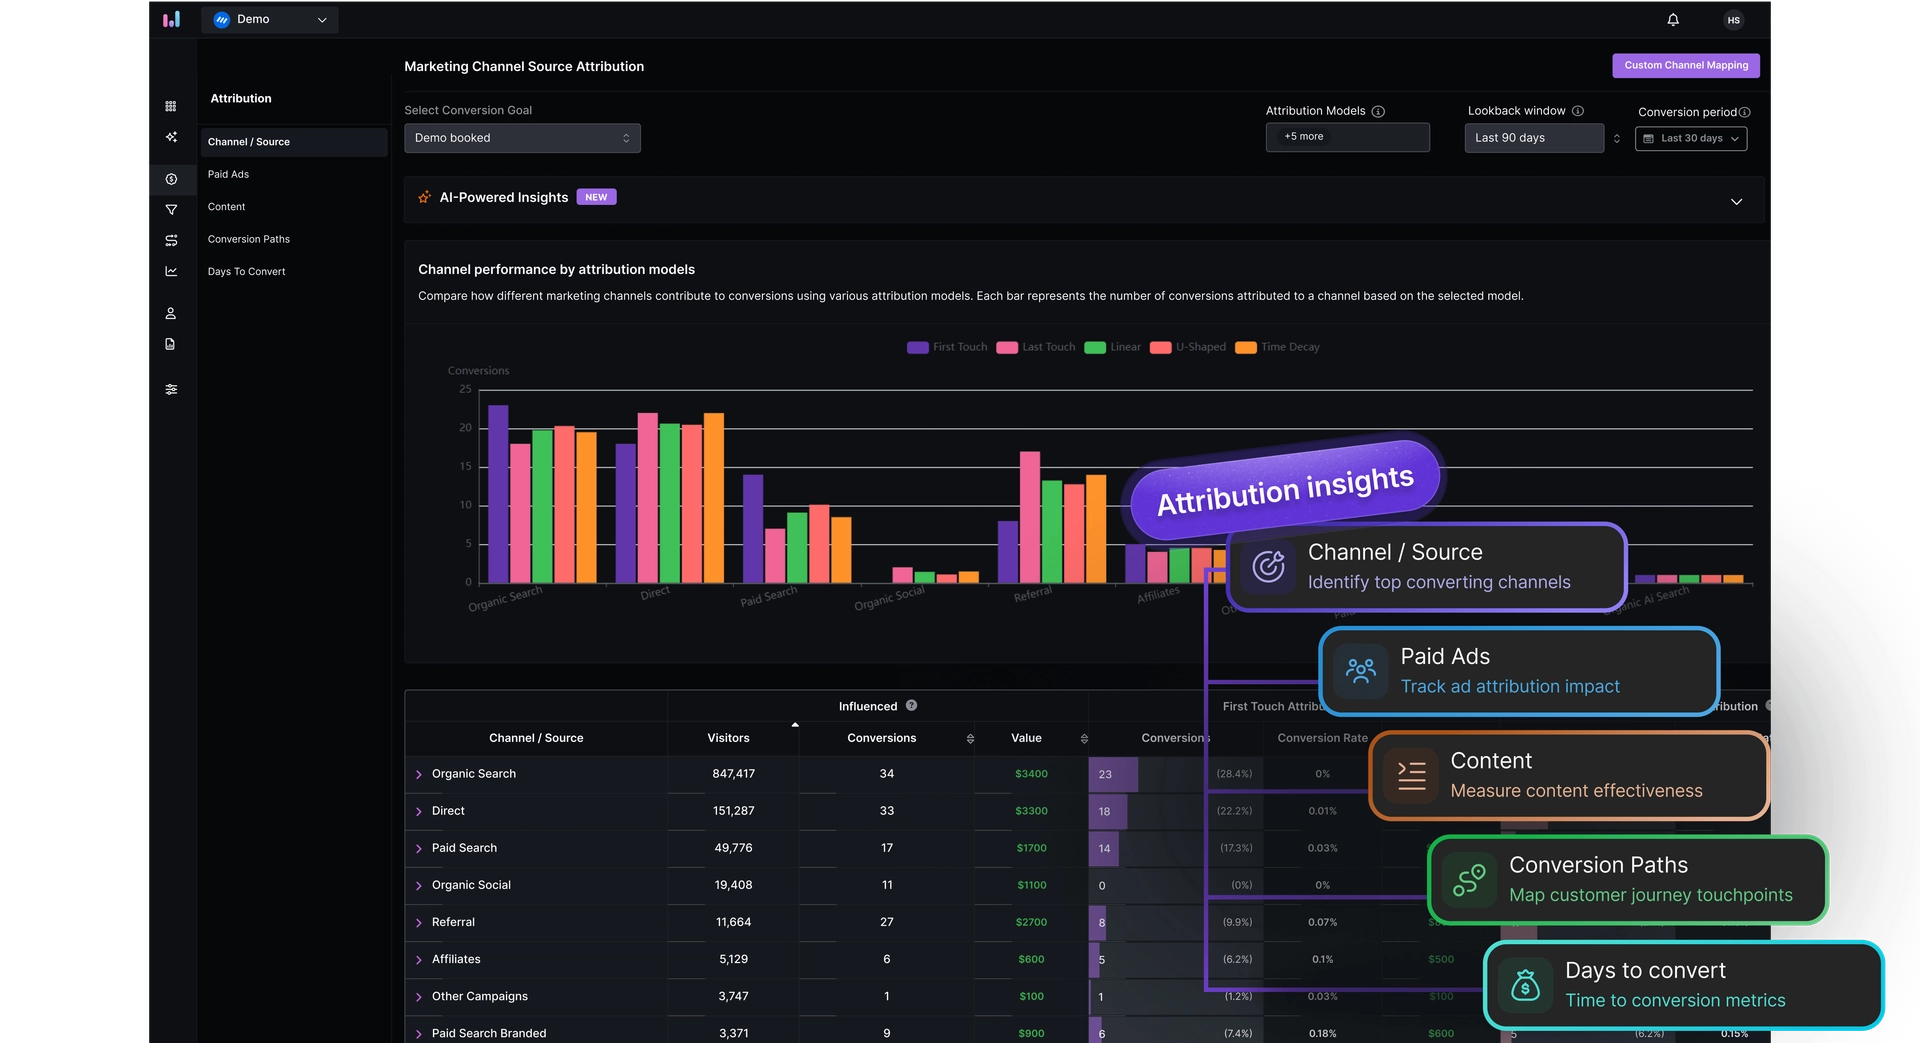
Multi-touch attribution
In today’s complex buyer journeys, customers rarely convert after one single touchpoint. They might discover your brand via a social ad, read a blog post later, engage with an email, and finally convert after a search visit. Usermaven tracks all these touchpoints and assigns credit across them, revealing the true influence of each interaction in the path to conversion.
Usermaven’s paid ads integration takes this even further. You can see exactly how Google Ads, Meta Ads, LinkedIn Ads, and Bing Ads perform side by side, with visibility into spend, impressions, clicks, and click-through rates. Instead of jumping between platforms, all your paid performance data lives in one unified view, right next to product usage.
Ultimately, this allows you to identify your most valuable channels, reallocate budget where it has the greatest impact, and scale successful marketing campaigns.
Website analytics
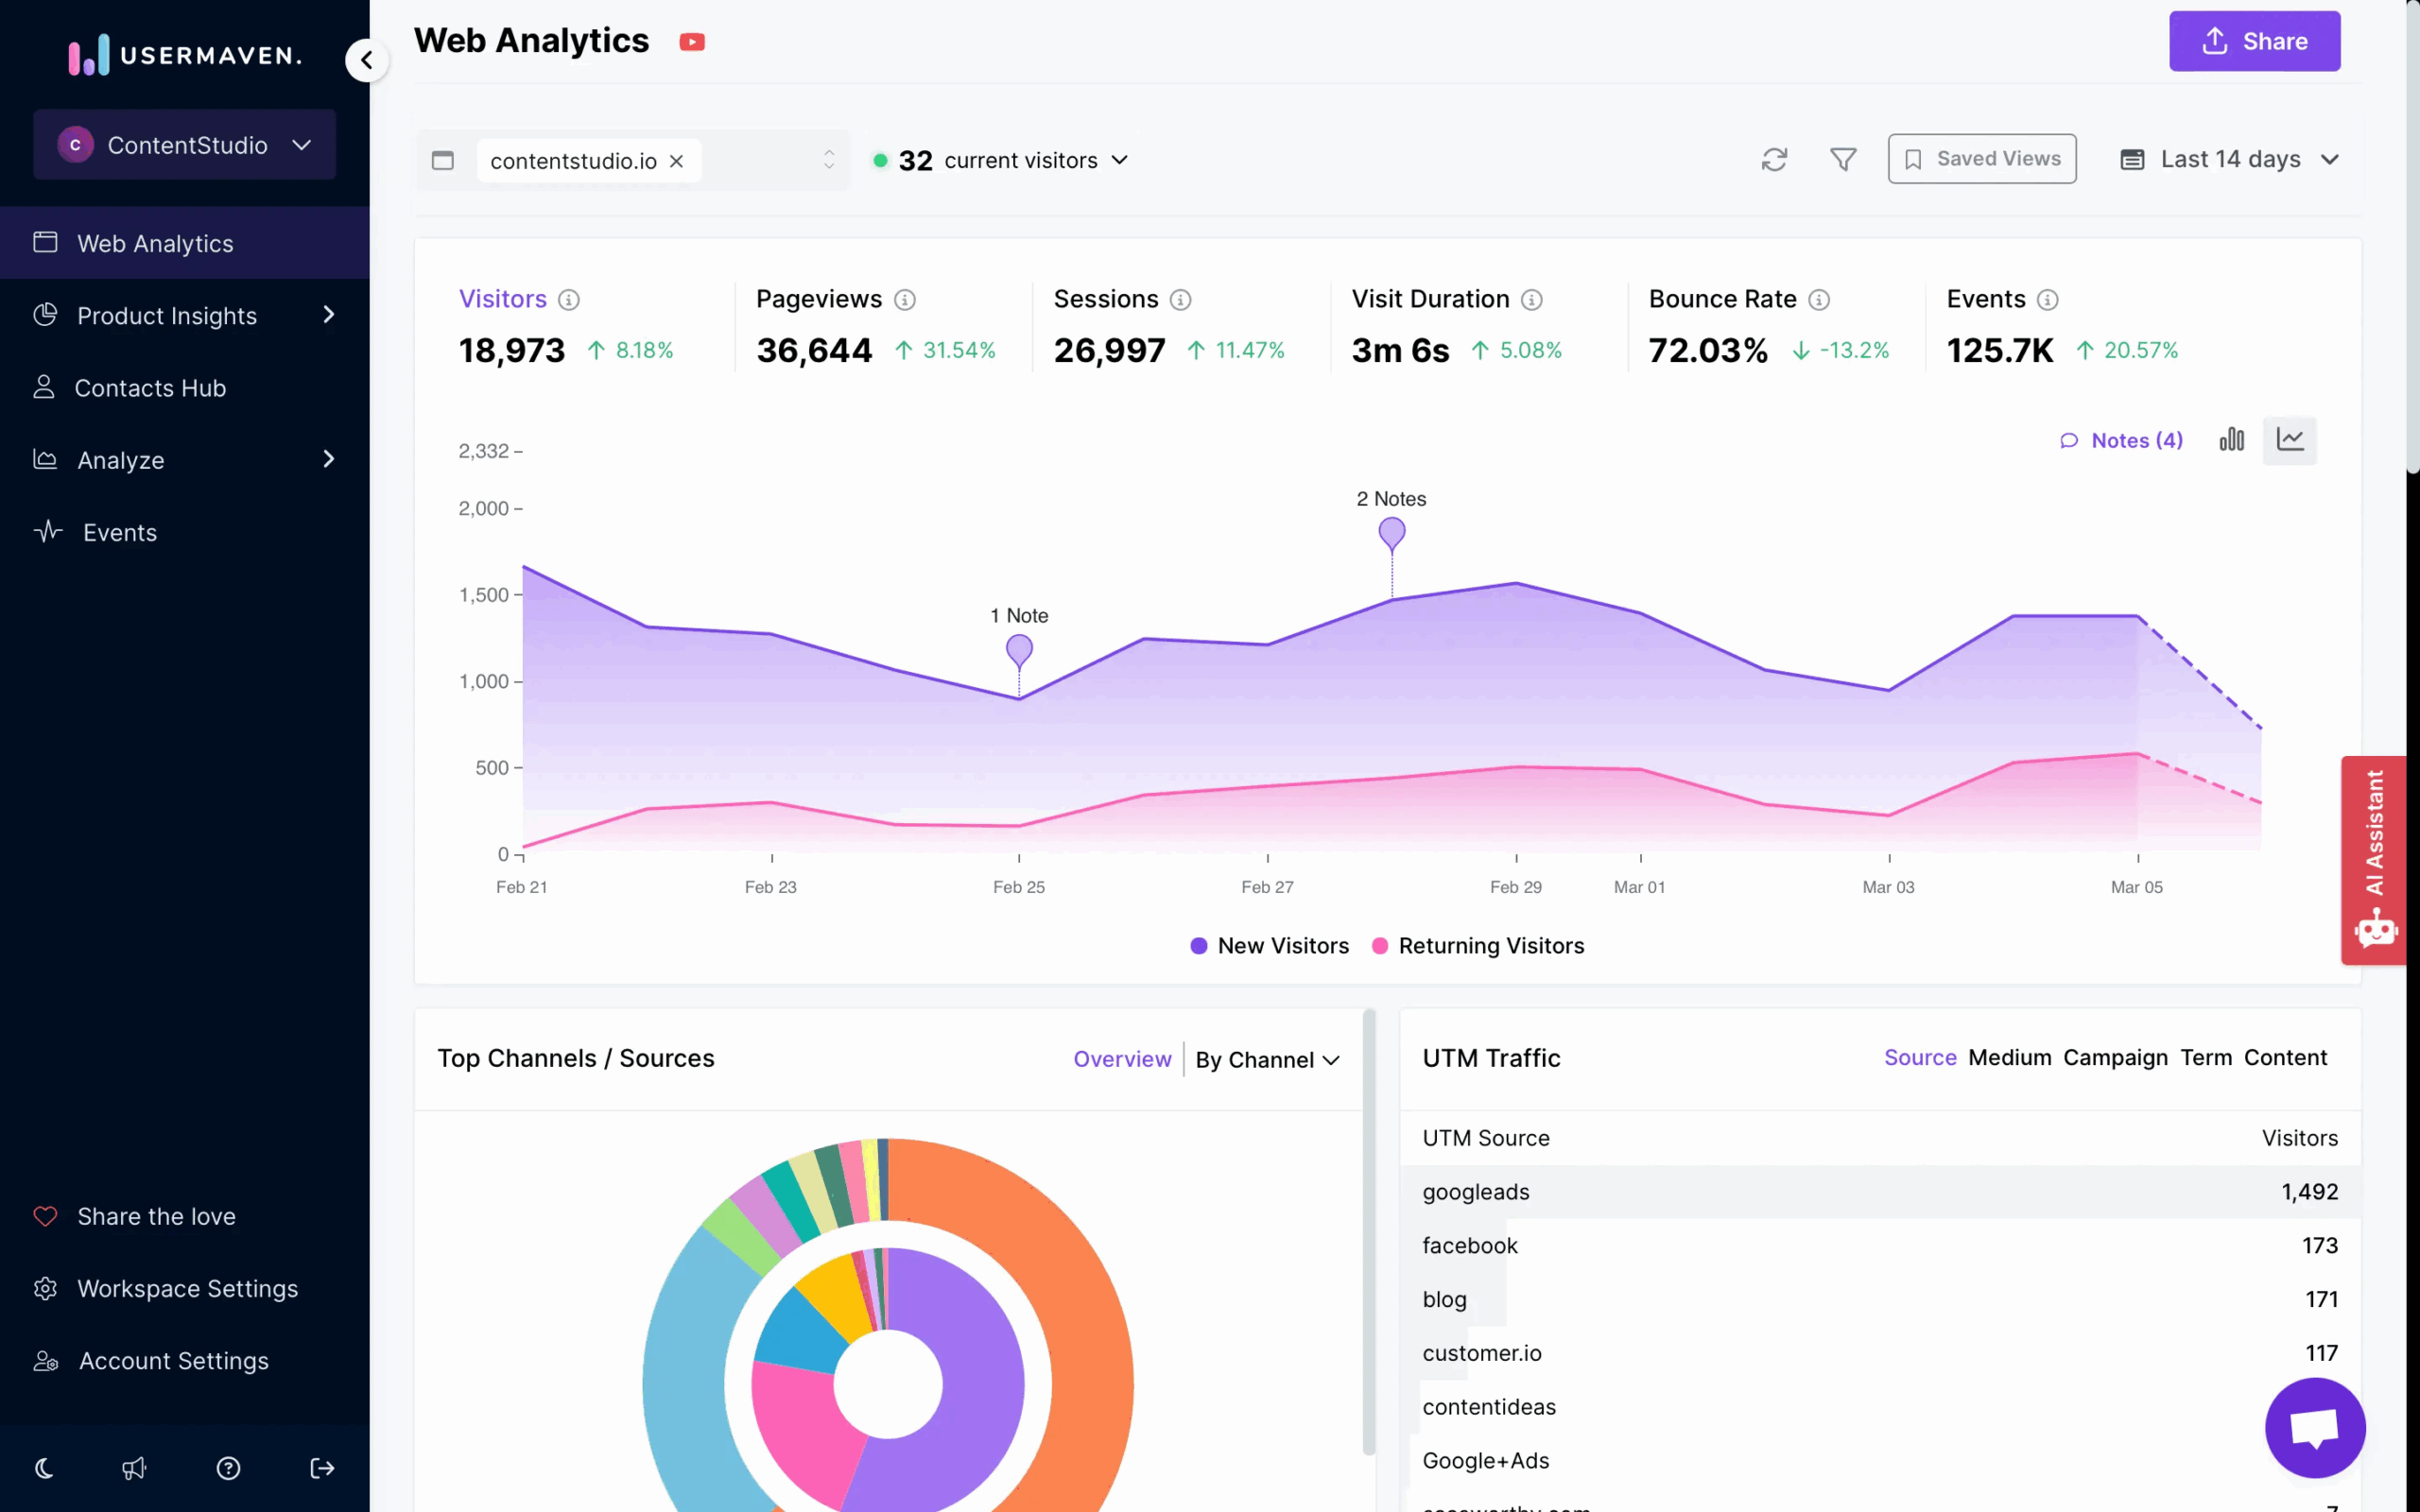
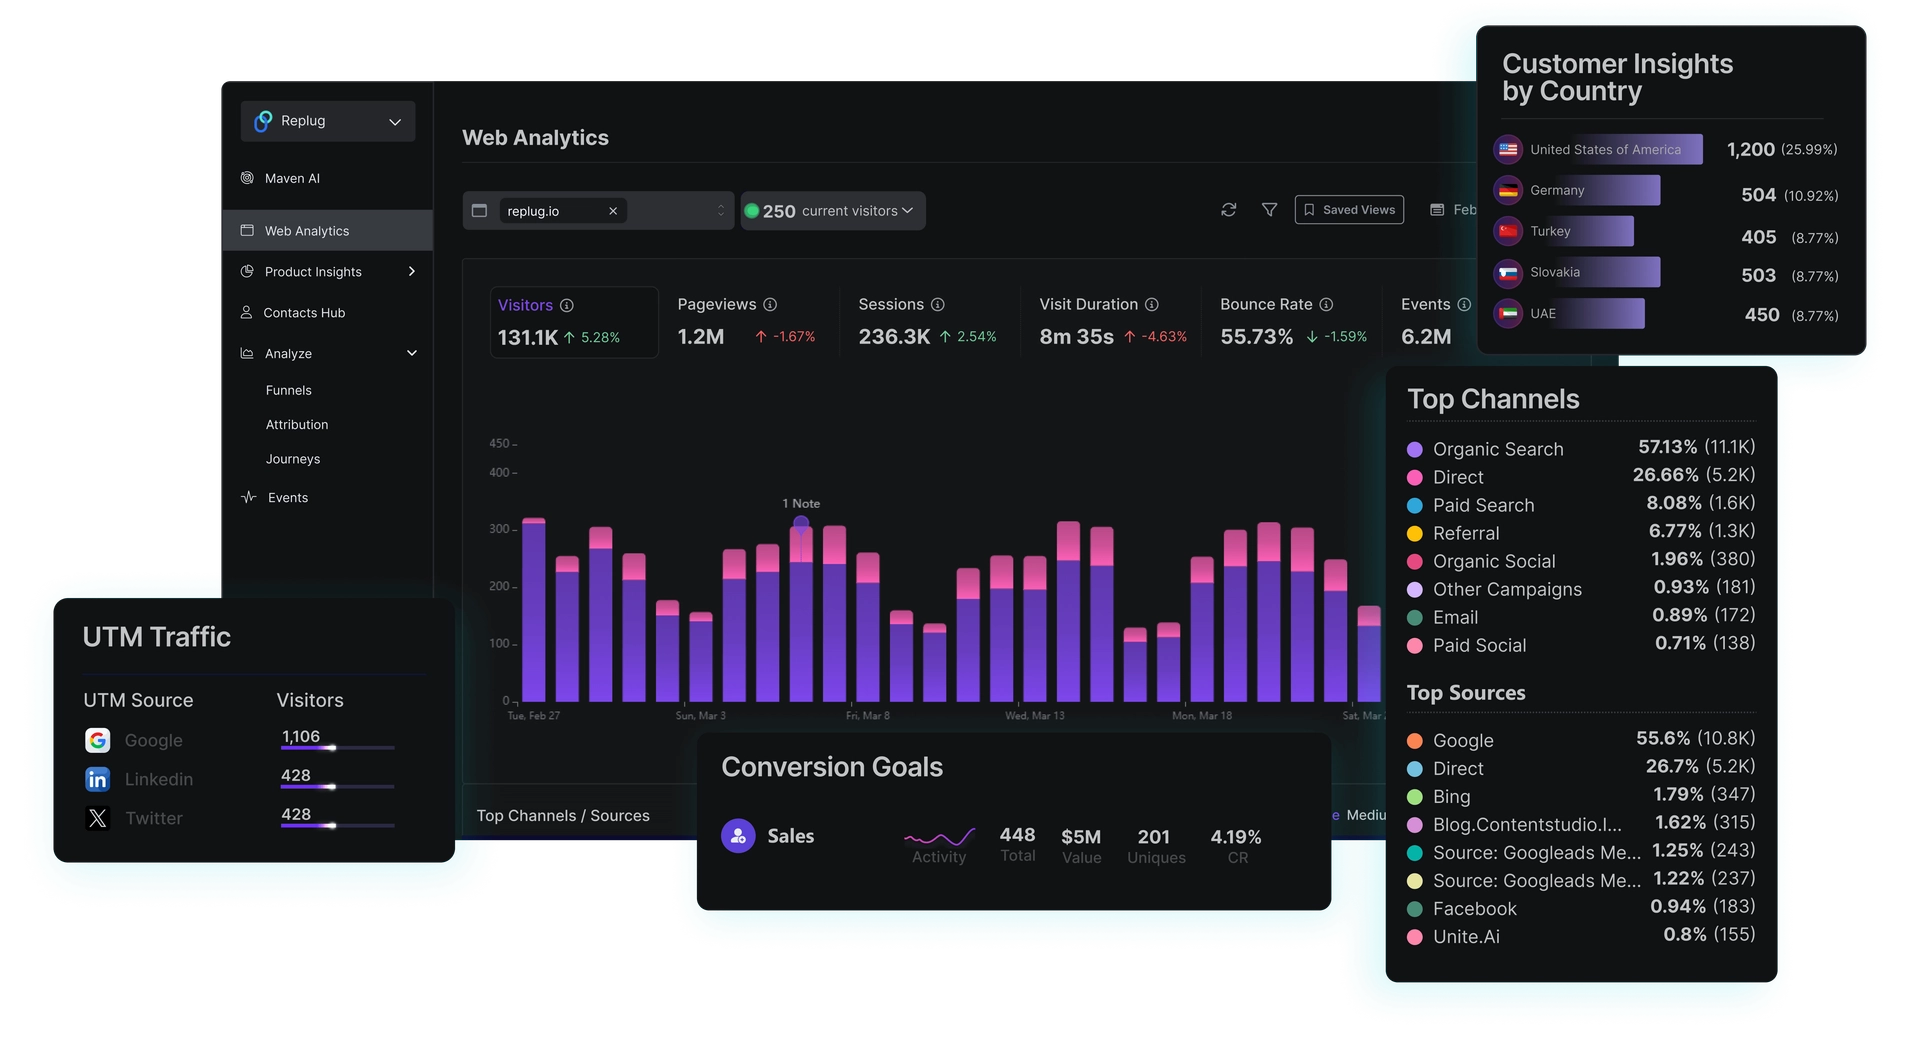
Usermaven opens with a clean dashboard that surfaces your core website stats like unique visitors, pageviews, sessions, average visit duration, and bounce rate in one place. Want to dig deeper? Just click any metric and the top graph reveals richer details instantly.
You can also switch between bar and line views depending on how you like to visualize your trends.
Here are some other insights you can find on the dashboard:
- Top content and engagement stats: Identify your most visited pages and understand which pieces of content resonate with your audience.
- Audience insights: Break down visitors by device and location so you can create personalized engagement strategies.
- Search keywords data: Connect your Google Search Console to discover what terms are actually driving organic traffic.
Trends
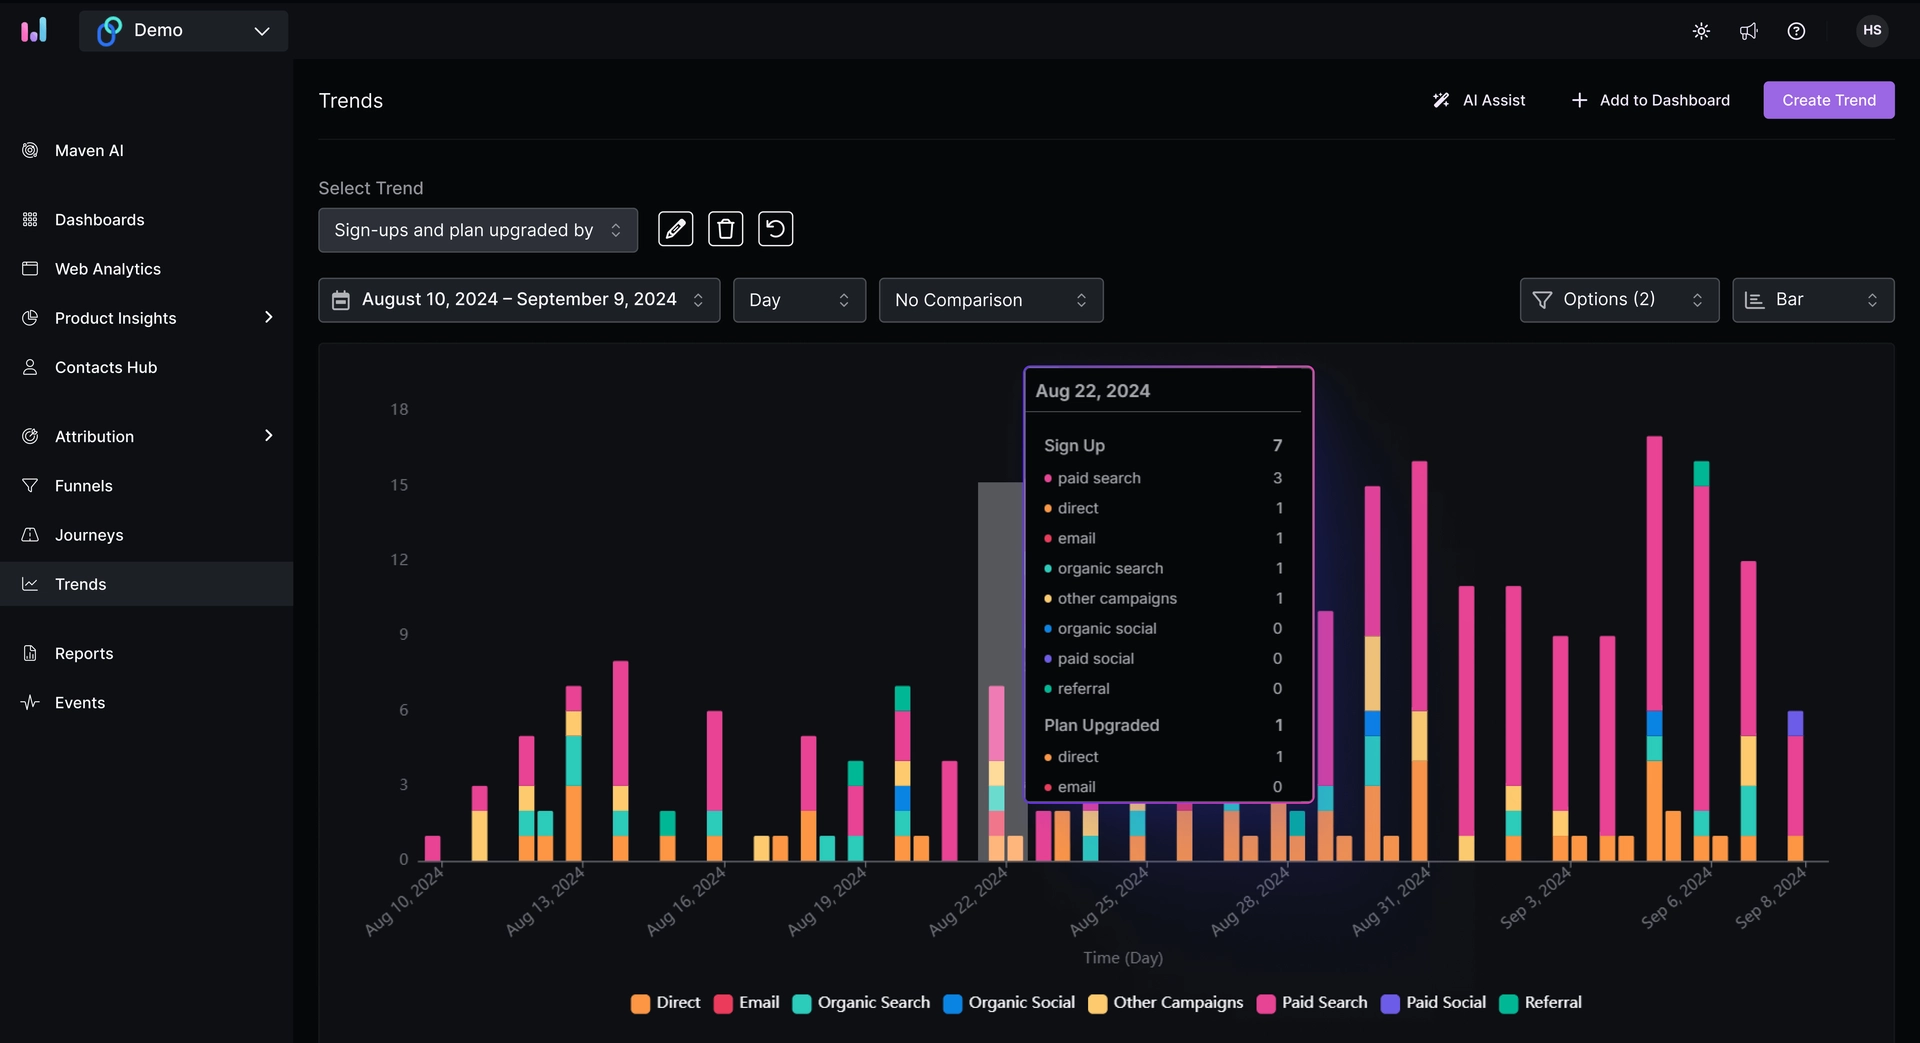
At its core, Trends lets you view two or more events side by side over a time period to see underlying patterns. Rather than looking at isolated reports, you get time-based context, which is crucial for understanding growth, seasonality, or sudden dips.
You can also break down trend lines by properties like country, device type, user segment, or plan type, giving context to why things are happening.
For example, you can use the trends report to see how purchases evolve over time to judge the success of product launches.
User journeys
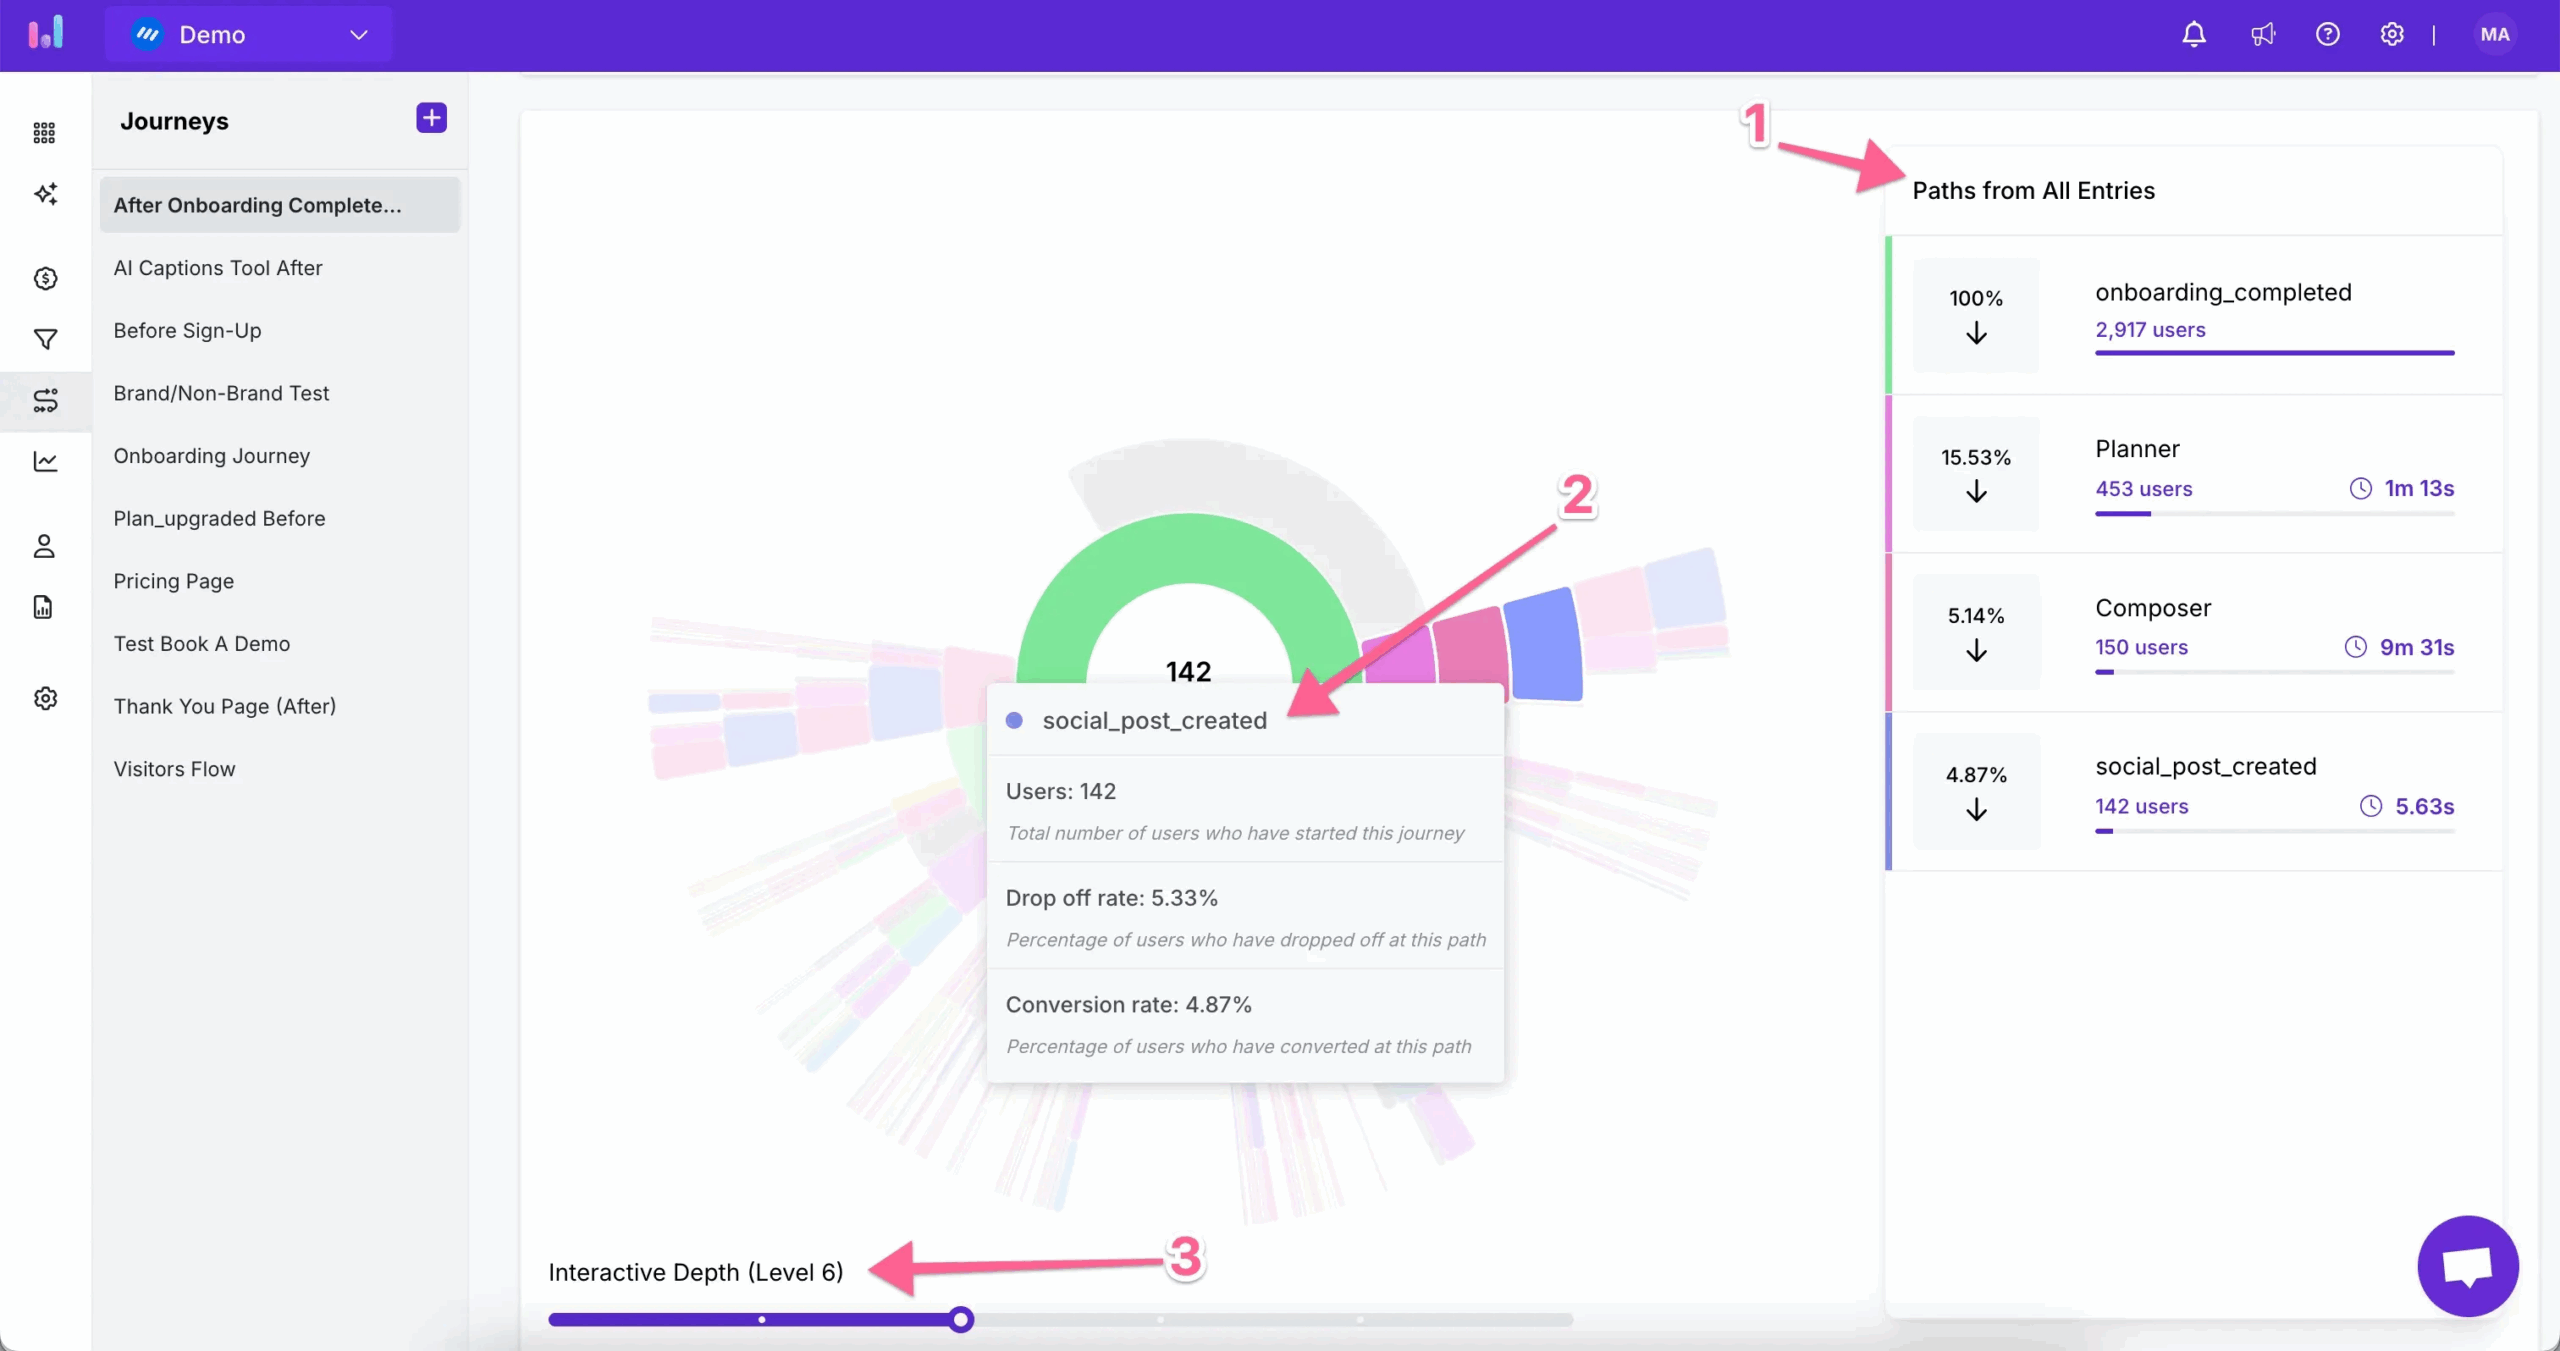
Usermaven allows you to visualize the exact paths users take inside your product. You define a starting point (like a landing page) and then automatically reveal the most common actions users take afterward.
You can analyze journeys within a single session or across multiple sessions over time, giving you both short-term and long-term behavioral insights.
Here are just a couple of ways you can use these insights:
- Understand feature discovery: Learn how users find and adopt key features.
- Improve conversions: Understand which steps lead to goal completion
- Optimize user experience: See if users take unexpected paths or reach dead ends.
- Compare different segments: Understand how different user groups (e.g., startups vs. enterprise) navigate your product.
Funnels
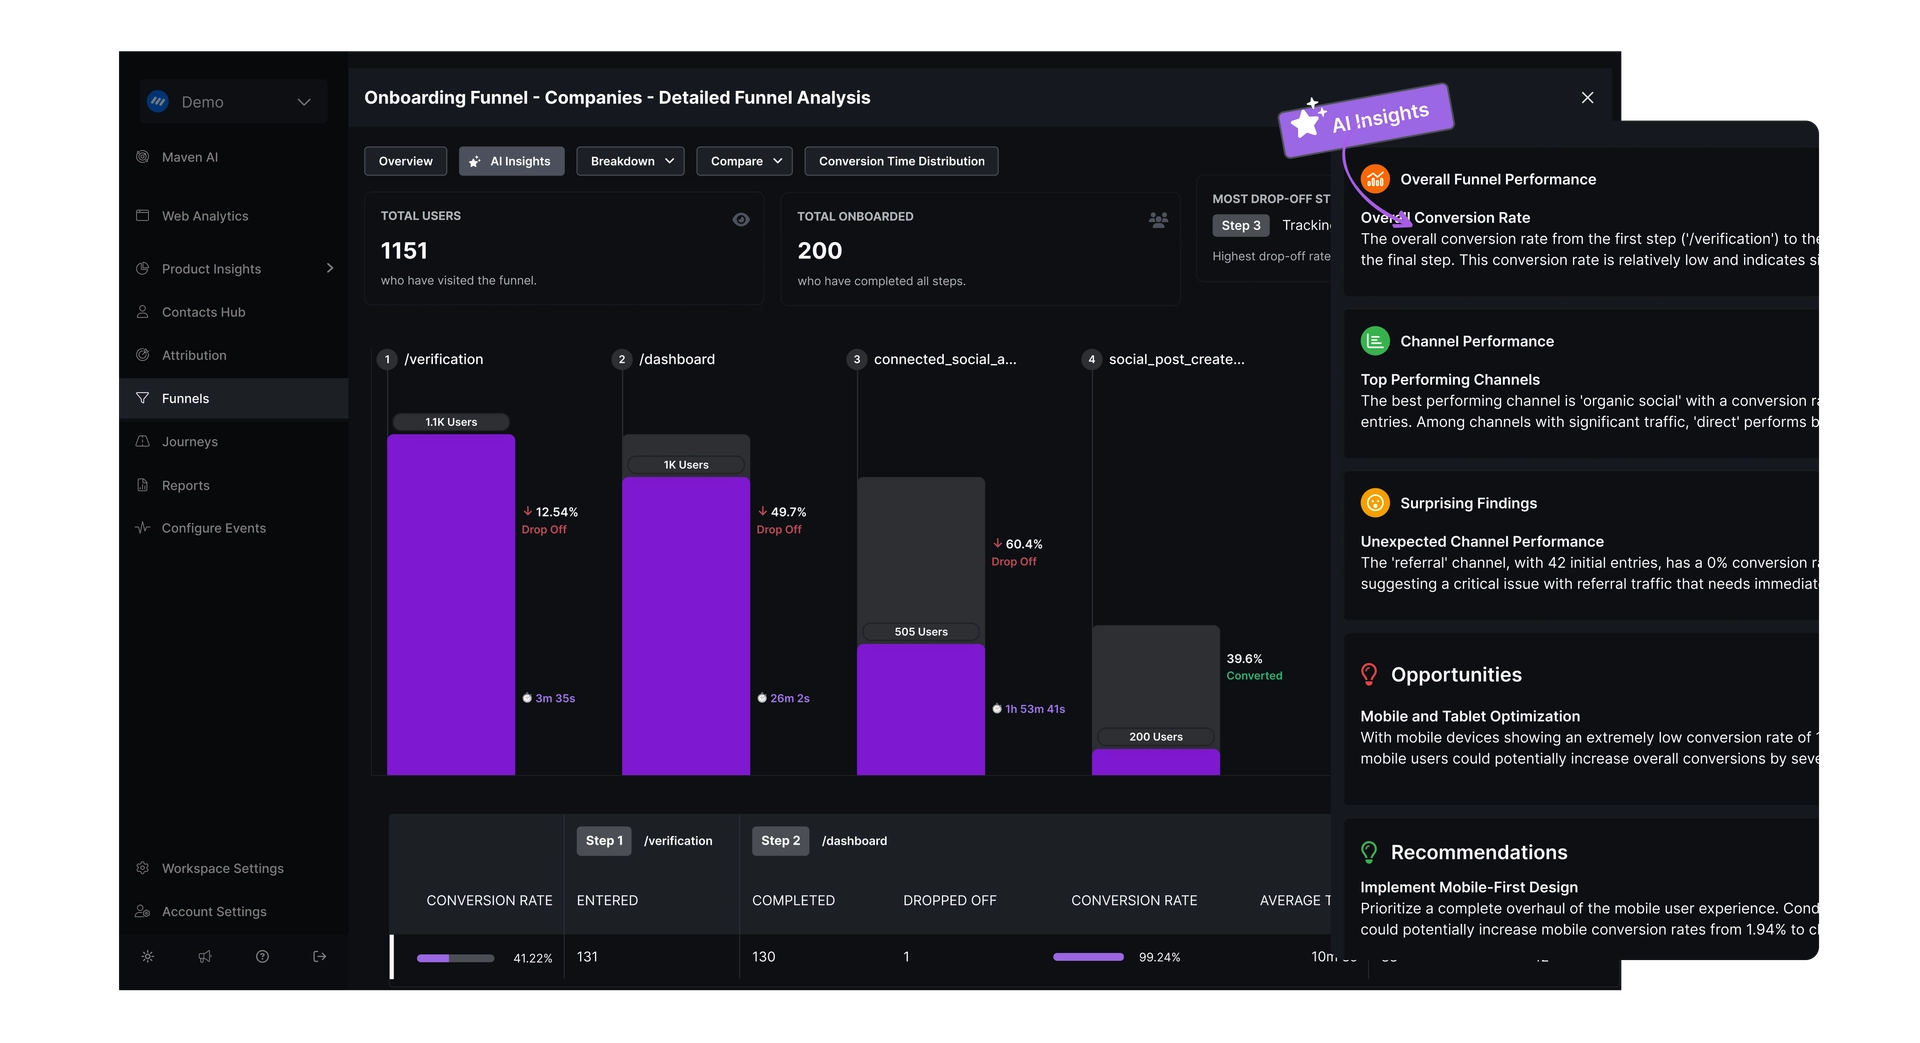
A funnel comprises multiple stages, each representing a step in a user journey toward a desired outcome. You choose the events or actions that define each stage (e.g., “Visited Pricing Page,” “Started Signup,” “Completed Signup”), and Usermaven tracks how many users make it through each one.
Here are some ways you can use funnels in SaaS:
- Conversion optimization: See where prospects abandon before converting and refine that step (e.g., shorten forms or simplify wording).
- Onboarding analysis: Track how many users complete each step of onboarding and fix confusing stages to boost activation.
What I like most is the AI assistant that automatically proposes effective funnels based on real user behavior. You just pick a conversion goal and let the AI identify meaningful paths you might not have thought to track, complete with suggested funnel steps and projected performance. Once you have data, the AI assistant generates actionable insights from the data, making your job easier.
Custom product analytics dashboards
Usermaven allows you to build custom dashboards for tracking user behavior. You can use the flexible builder to add Trends, Funnels, Journeys, and Attribution reports in one view.
There are also 4 pre-built dashboards specifically for SaaS lifecycle analytics. These include:
- Onboarding: Tracks onboarding completion rates, time to value, and where users drop off. This helps you identify friction early and improve first-time user experience.
- Retention: Reveals how well your product keeps users coming back over time, after signup or key actions. This helps you identify churn patterns.
- Feature adoption: Shows which features users actually use and how often. It measures adoption rates, usage frequency, and engagement intensity per feature. This helps product teams focus on features that drive real value. You can filter by segments for more granular analysis.
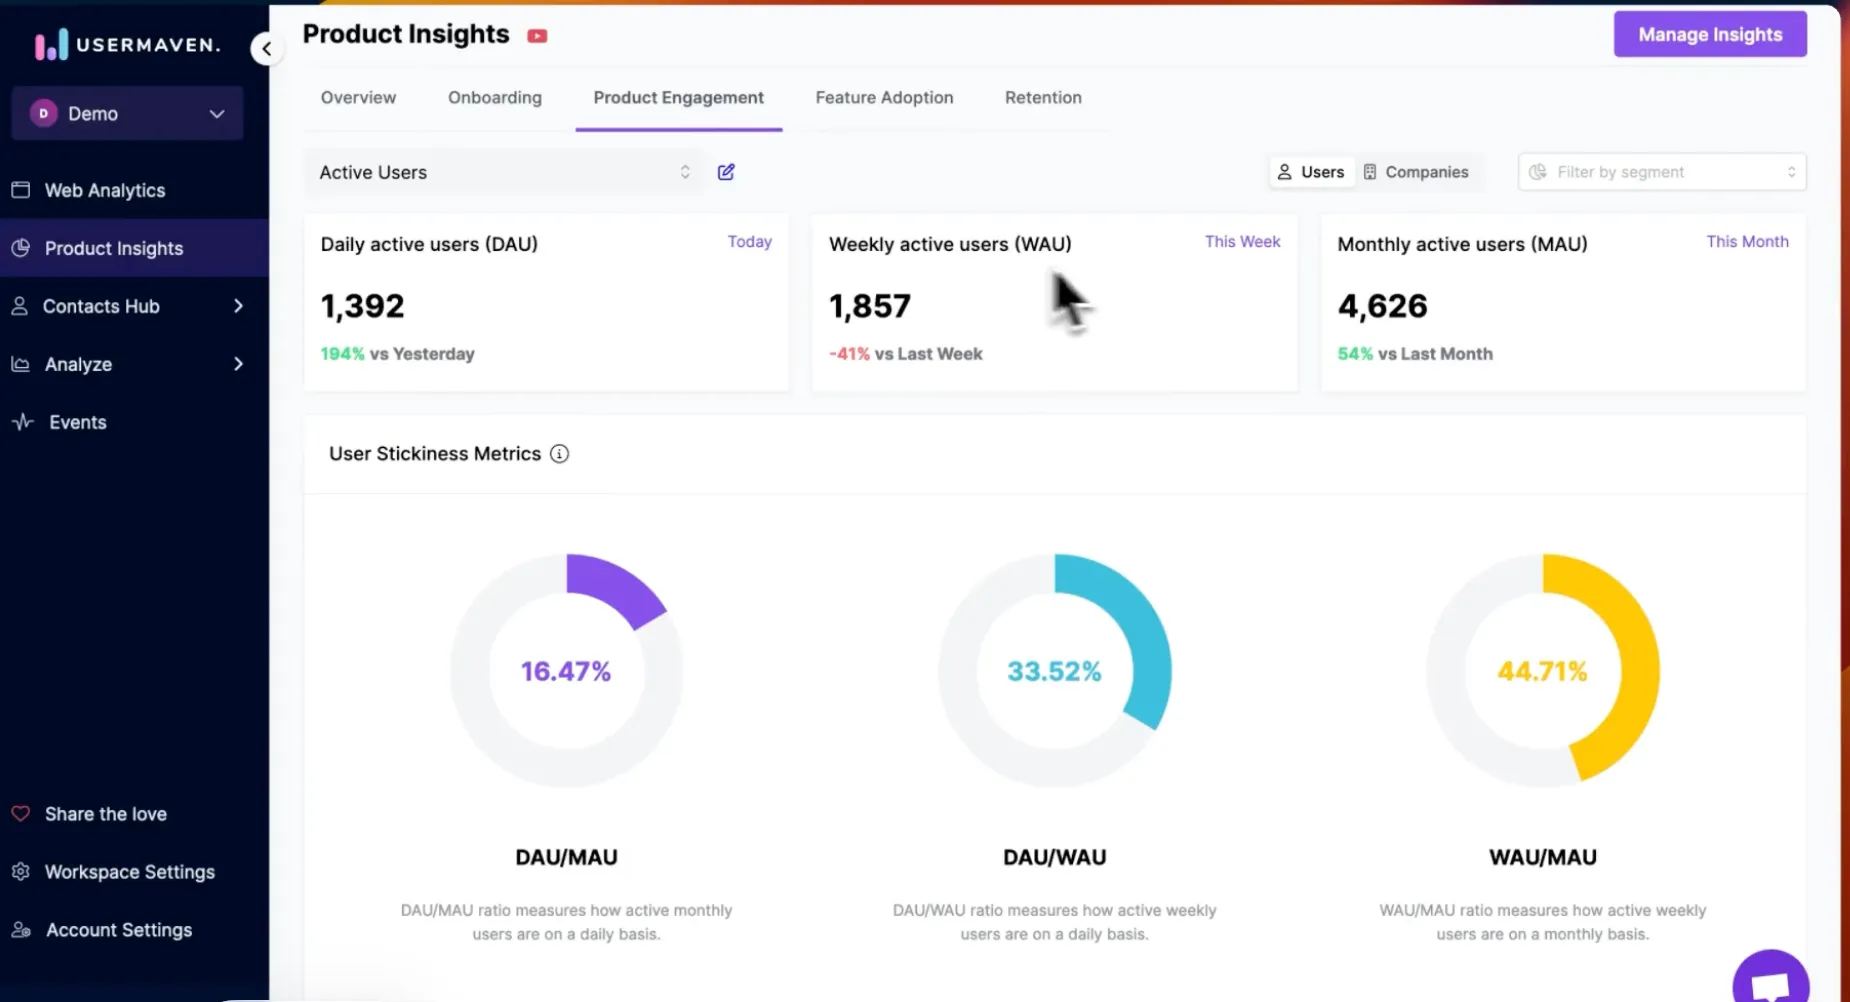
- Product engagement: Measures how actively users interact with your product over time. It tracks key metrics like daily, weekly, and monthly active users, along with stickiness ratios such as DAU/MAU. This dashboard helps you understand whether users are forming habits. Insights can be viewed at the user or company level.
Contacts hub and segmentation
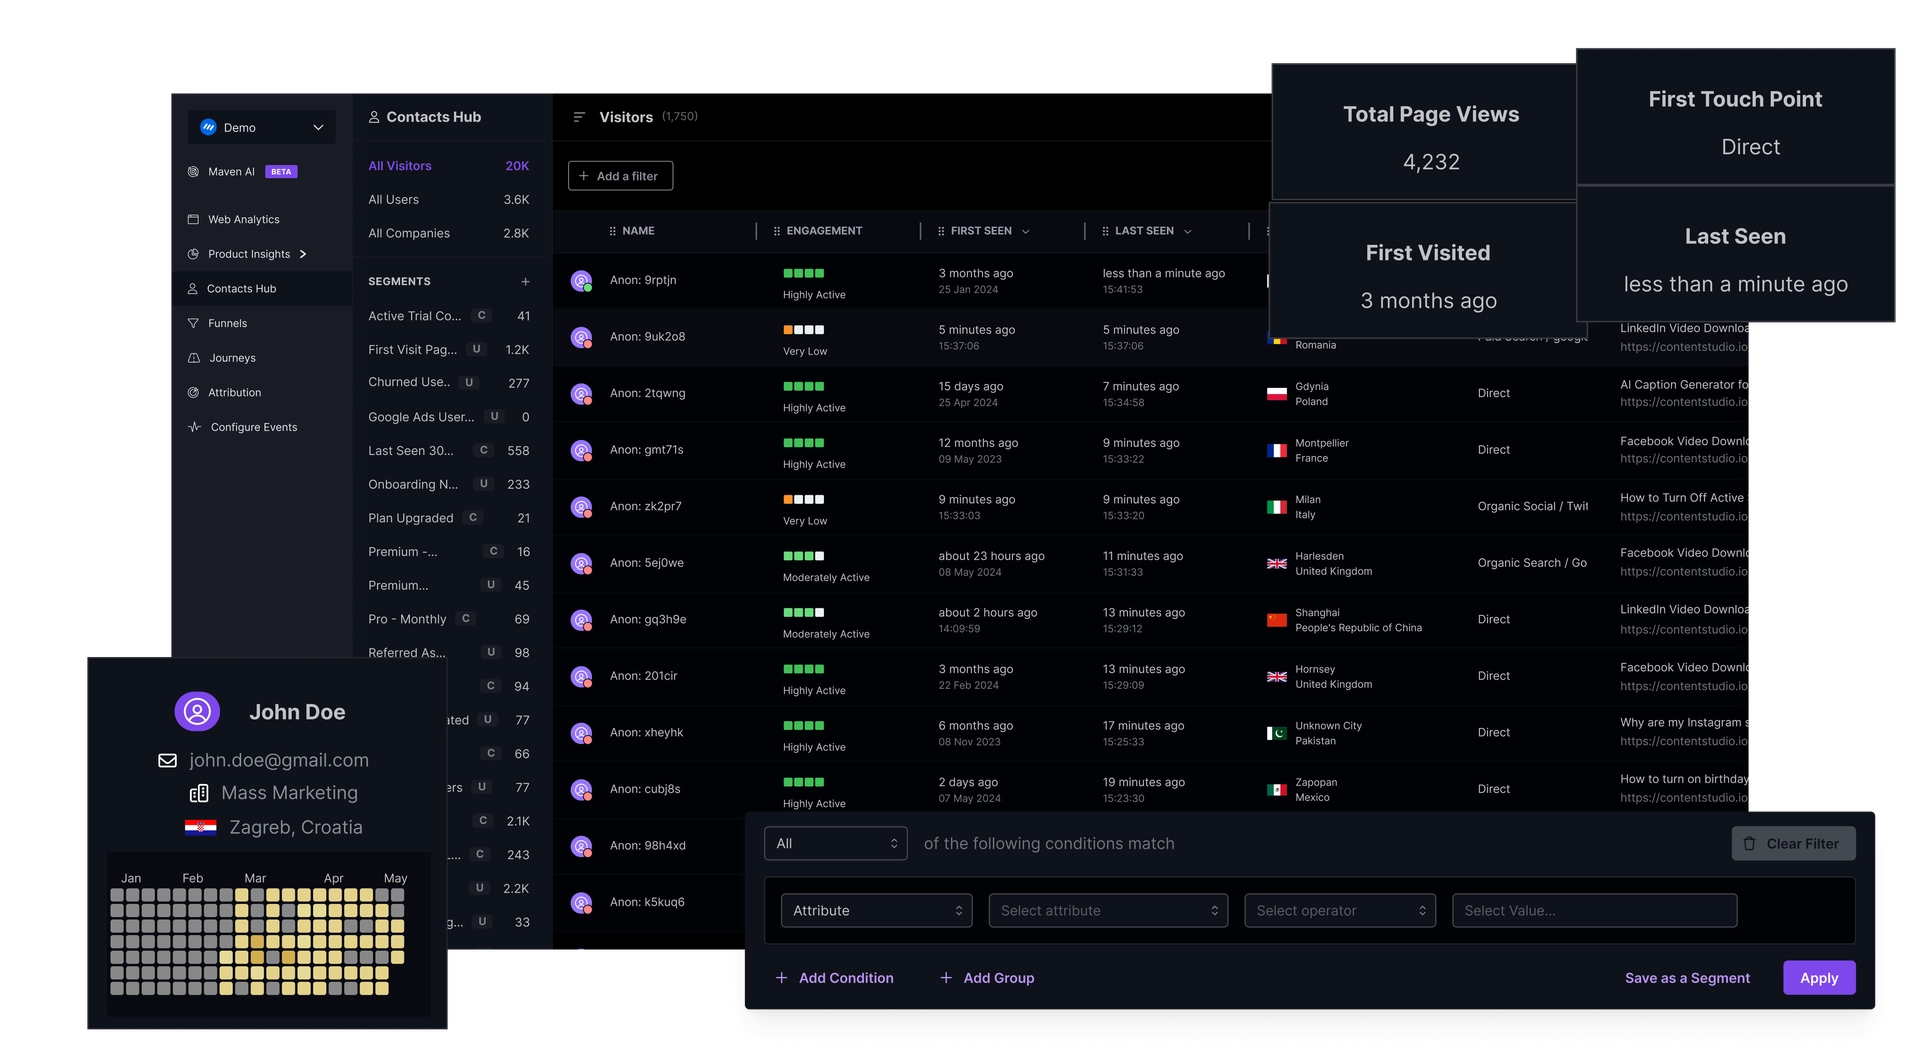
Usermaven’s Contacts Hub acts like a mini-CRM built into your analytics platform, giving you rich profiles for each user that interacts with your app, from first-time anonymous visitors to repeat users and the companies they belong to.
At its core, the Contacts Hub collects and organizes every touchpoint into unified profiles, including first and last-seen activity, user engagement levels, session history, UTM marketing data, device info, and more.
This empowers smarter segmentation, personalized messaging, and better retention strategies.
How much does Usermaven cost?
Usermaven uses tiered plans with usage-based pricing, meaning each plan includes a fixed feature set, while the final cost scales based on event volume. All plans come with a 14-day free trial (no credit card required). Here’s a quick breakdown of Usermaven pricing plans:
| Plan | Starting price | Best for | What’s included |
|---|---|---|---|
| Growth | $84/month | Small teams looking for basic marketing analytics insights | 3 users, 3 workspaces, 5 years data retention, web/product/e-commerce analytics, automatic tracking, data visualization, segments & cohorts, user & account profiles, email & Slack reports |
| Scale | $199/month | Growing companies need deeper acquisition, conversion, and revenue insights | Unlimited users, 5 workspaces, 7 years of data history, advanced attribution (channels, content, paid ads data), CRM & deals attribution, conversion paths, retention analysis, AI-powered insights, native integrations with Google, Meta & LinkedIn |
| Enterprise | Custom pricing | Organizations with advanced analytics, security, and compliance needs | Unlimited data history, custom workspaces, effortless data export, private cloud or on-premise deployment, white-glove onboarding, dedicated customer success manager, priority support |
What are the pros and cons of Usermaven?
Pricing and features only tell part of the story. The real test of any tool is how it feels to use on a day-to-day basis. Here’s my take on where Usermaven shines and where it can be a challenge.
Usermaven pros
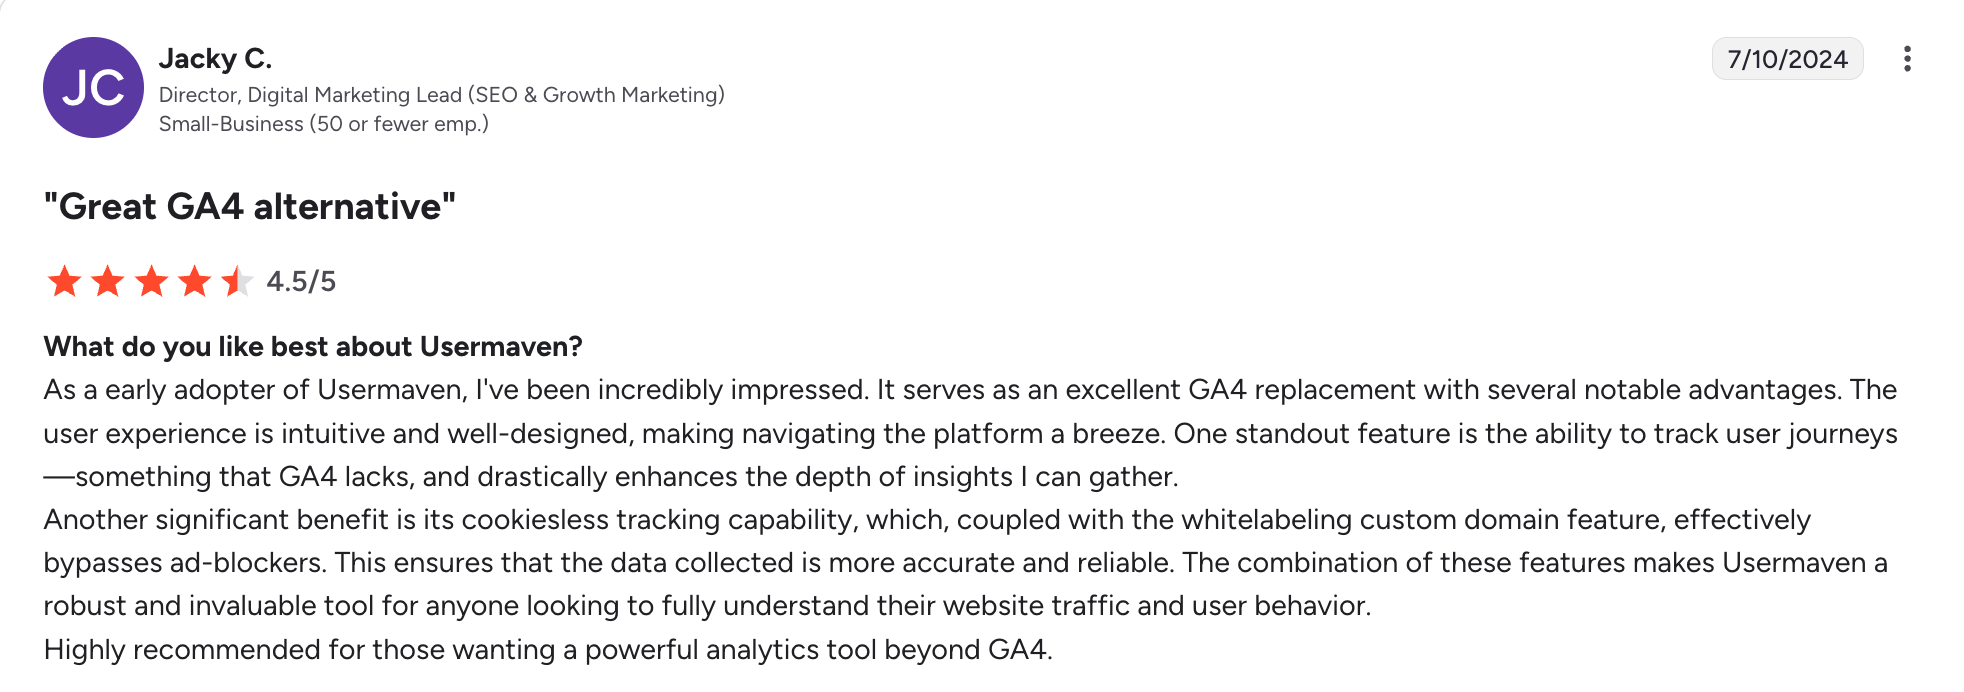
✅ Easy to set up and user-friendly UI: Users consistently highlight how quick it is to get started and how intuitive the dashboard feels compared with tools like GA4. Also, thanks to its autocapture feature, non-technical teams can track events without developer help.
✅ Product analytics tool + marketing attribution in one place: Usermaven gives you a single source of truth, eliminating data siloes and speeding up analysis. For example, you can connect acquisition channels directly to in-product user behavior to understand where most of your power users come from.
✅ Privacy-focused and cookieless tracking: Usermaven is designed with GDPR/CCPA compliance in mind and uses first-party, cookieless methods, so tracking isn’t blocked by ad blockers as often as with traditional analytics tools.
Usermaven cons
❌ No qualitative analytics: Usermaven focuses exclusively on quantitative data, meaning you can see what users are doing in your product, but not why they behave that way. There are no session replays to observe real user interactions or long-form surveys to ask them directly. As a result, teams are left guessing about the exact root causes behind drops in activation or churn, or must buy on additional tools.
❌ Lack of actionability: For SaaS companies, standalone analytics tools create an “Action Gap.” To reduce churn and drive revenue, you need a product growth platform that offers engagement tools to directly influence user behavior rather than just report on it. You will see the users leaving, but you will lack the tools to stop them in real-time. The delay between “seeing the data” and “shipping a fix” is where you lose revenue.
❌ Event-based pricing that penalizes success: As your product becomes stickier and users engage more deeply, your bills climb, whether your revenue grew or not.
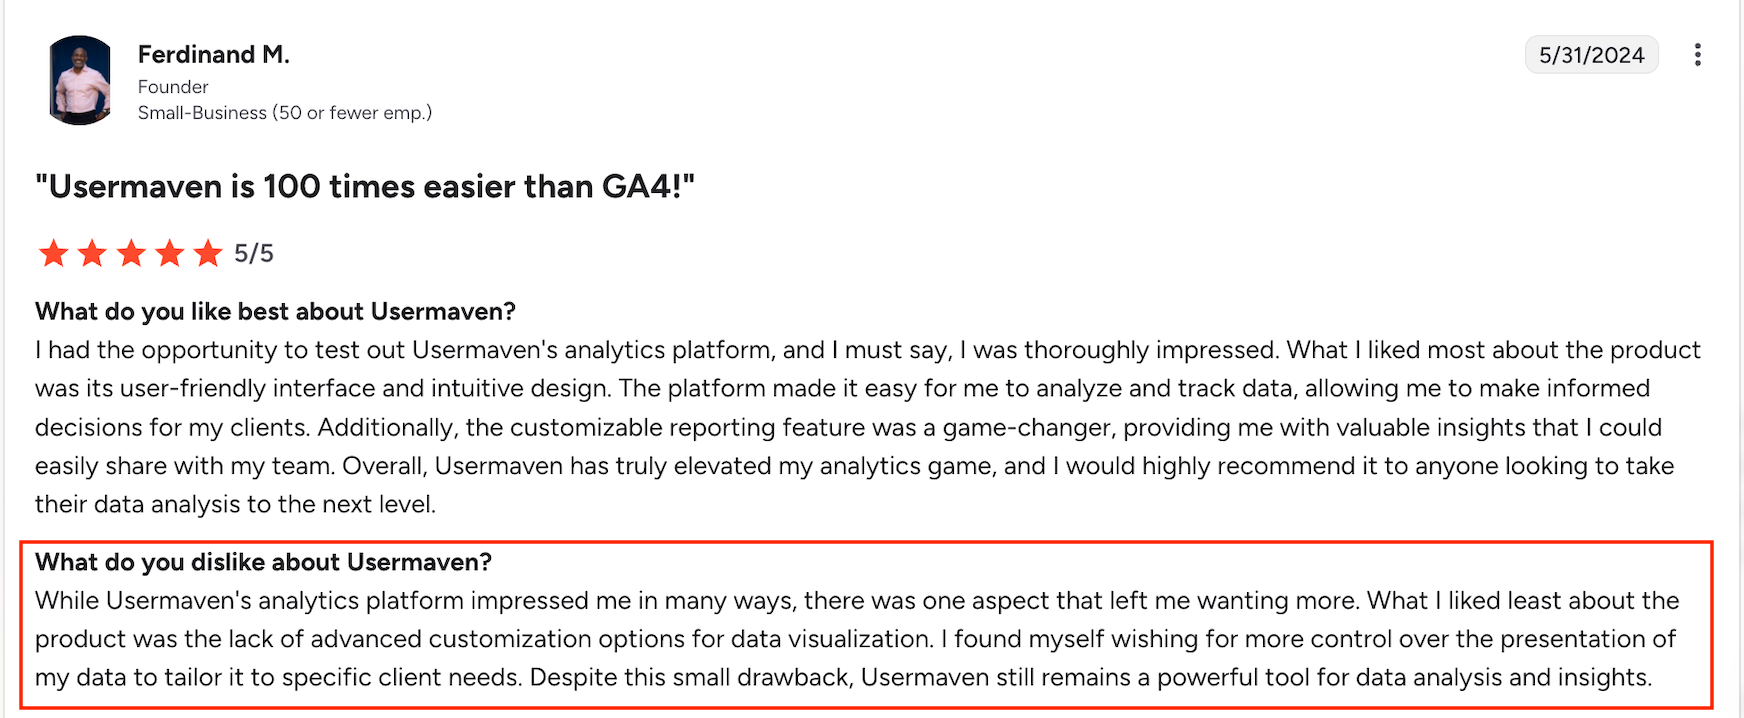
❌ Limited customization: Usermaven’s ready-made dashboards get you started quickly, but they don’t go very far. Compared to enterprise-grade analytics platforms, Usermaven offers limited control over how metrics, reports, and visualizations are configured.
Why Userpilot is a better alternative for agile PLG teams
Apart from website analytics and multi-touch attribution, Userpilot offers all the analytics reports as Usermaven, and then more. Apart from standard cohorts, paths, and funnels, Userpilot adds qualitative analytics tools and robust user engagement features for acting on insights. Here are some ways I think Userpilot is superior to Usermaven:
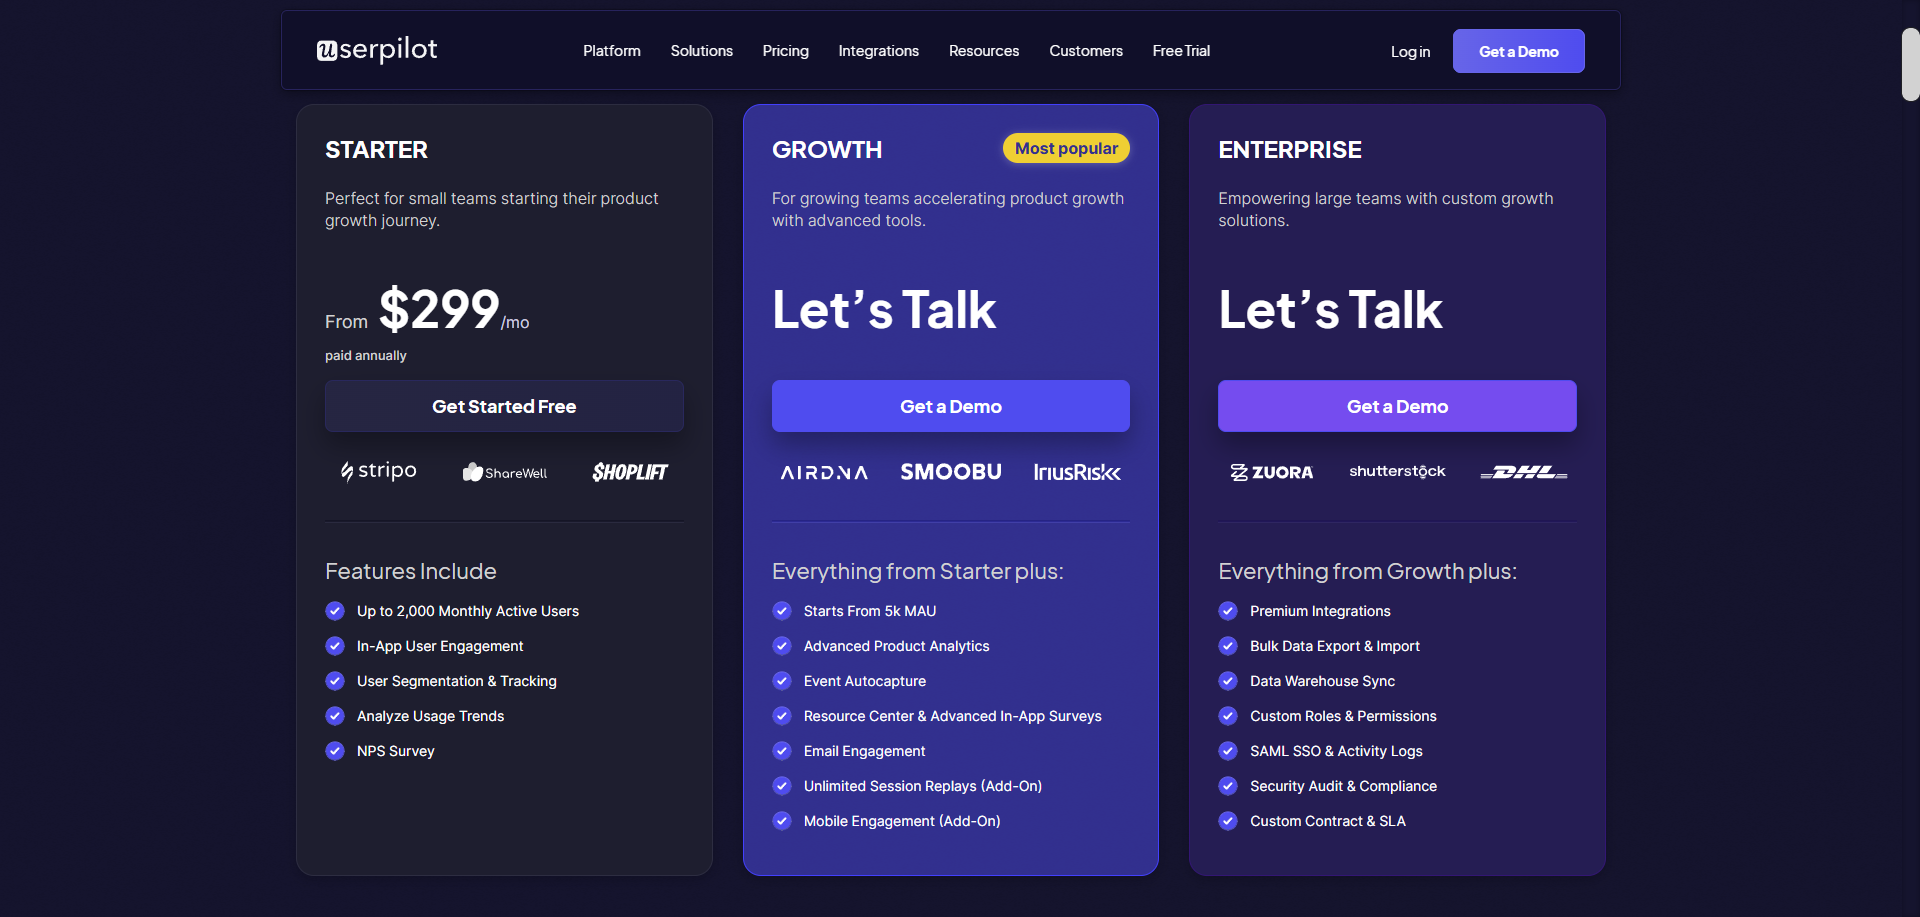
Predictable and scalable pricing
Costs are based on MAUs, not events. You are not penalized for building a highly engaging product or having power users.
Product managers run growth experiments without needing to check usage dashboards, and finance teams can model growth scenarios with greater accuracy.
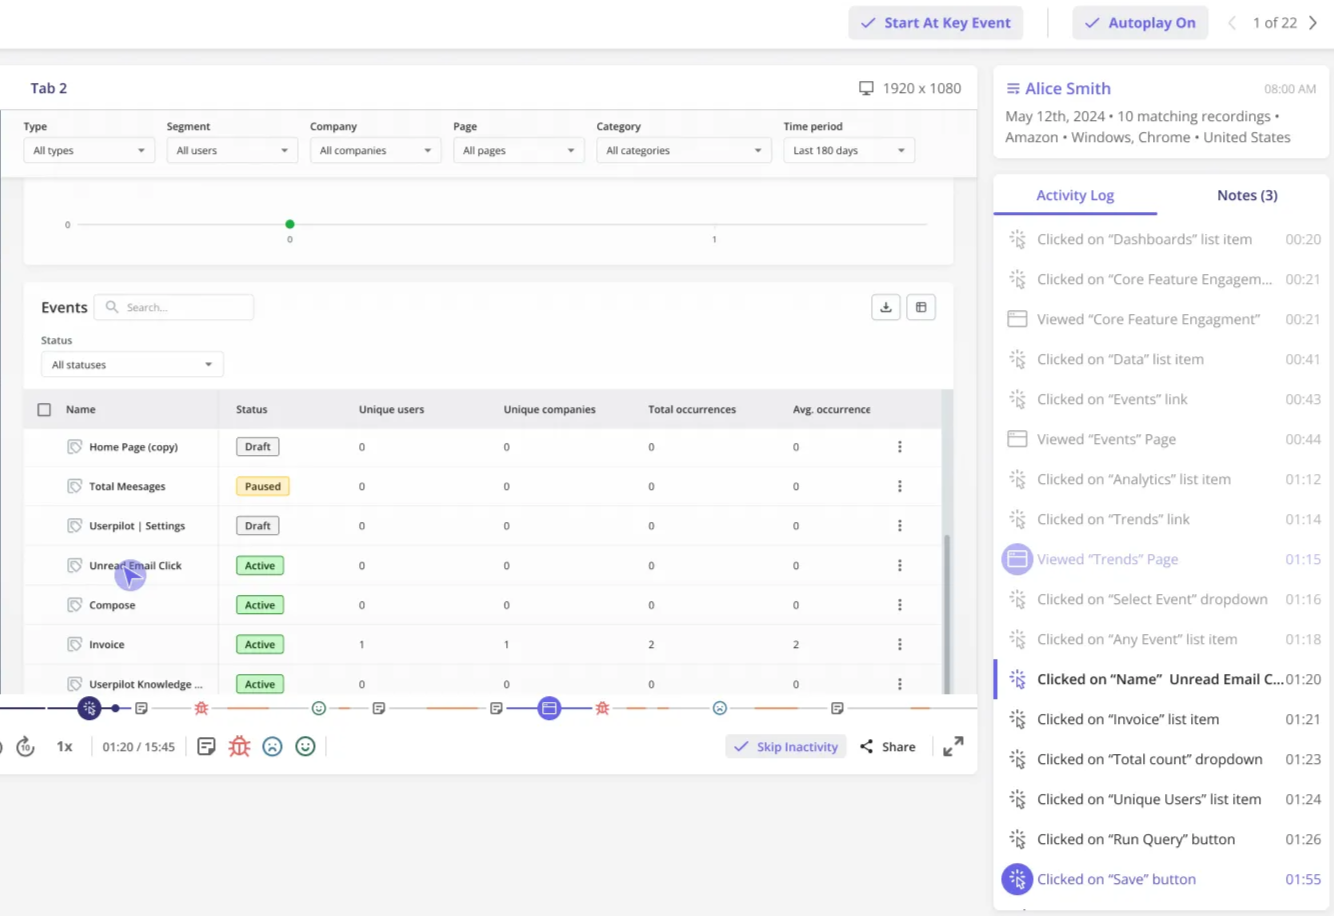
Session replays for uncovering root causes
With Userpilot’s session replays, product teams can move beyond surface-level metrics and see real user behavior unfold in context to answer important questions like “Where do users hesitate?” “What do they rage-click?
Session replays are tightly connected to Userpilot’s analytics. You can identify users who drop off at a specific funnel step, then jump straight into their session recordings to diagnose the issue. This dramatically shortens the feedback loop between insight and action.
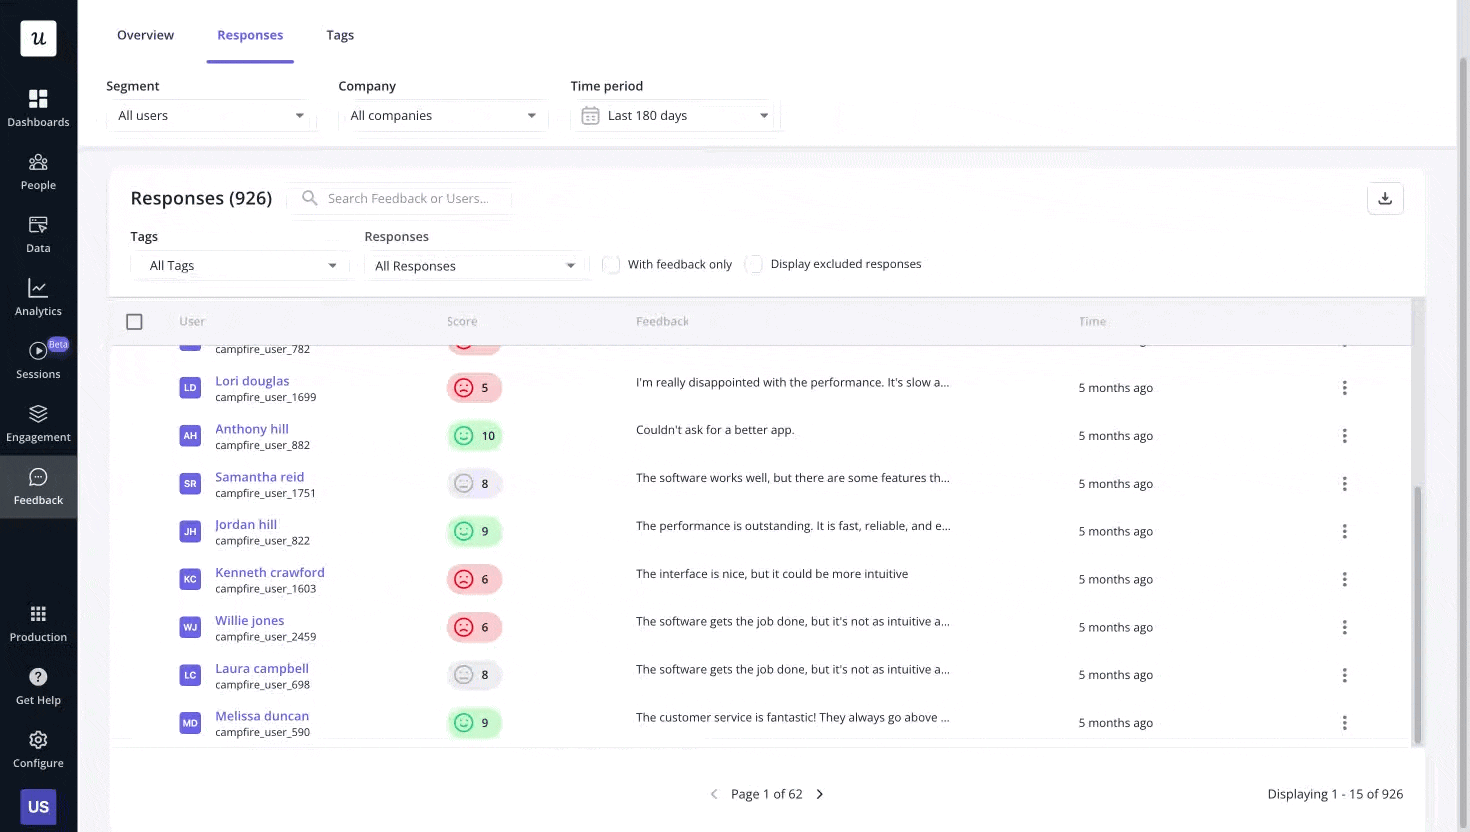
Integrated feedback tools for deeper insights
Userpilot enables teams to collect in-app feedback without buying separate tools like Hotjar or SurveyMonkey.
For example, you can send NPS surveys at key moments and instantly correlate scores with actual behavior. Are detractors struggling with a specific feature? Do promoters consistently adopt advanced functionality?
Moreover, you can tag qualitative responses to easily identify recurring patterns among different groups, making it easier to prioritize improvements.
Omnichannel engagement tools to close the action gap
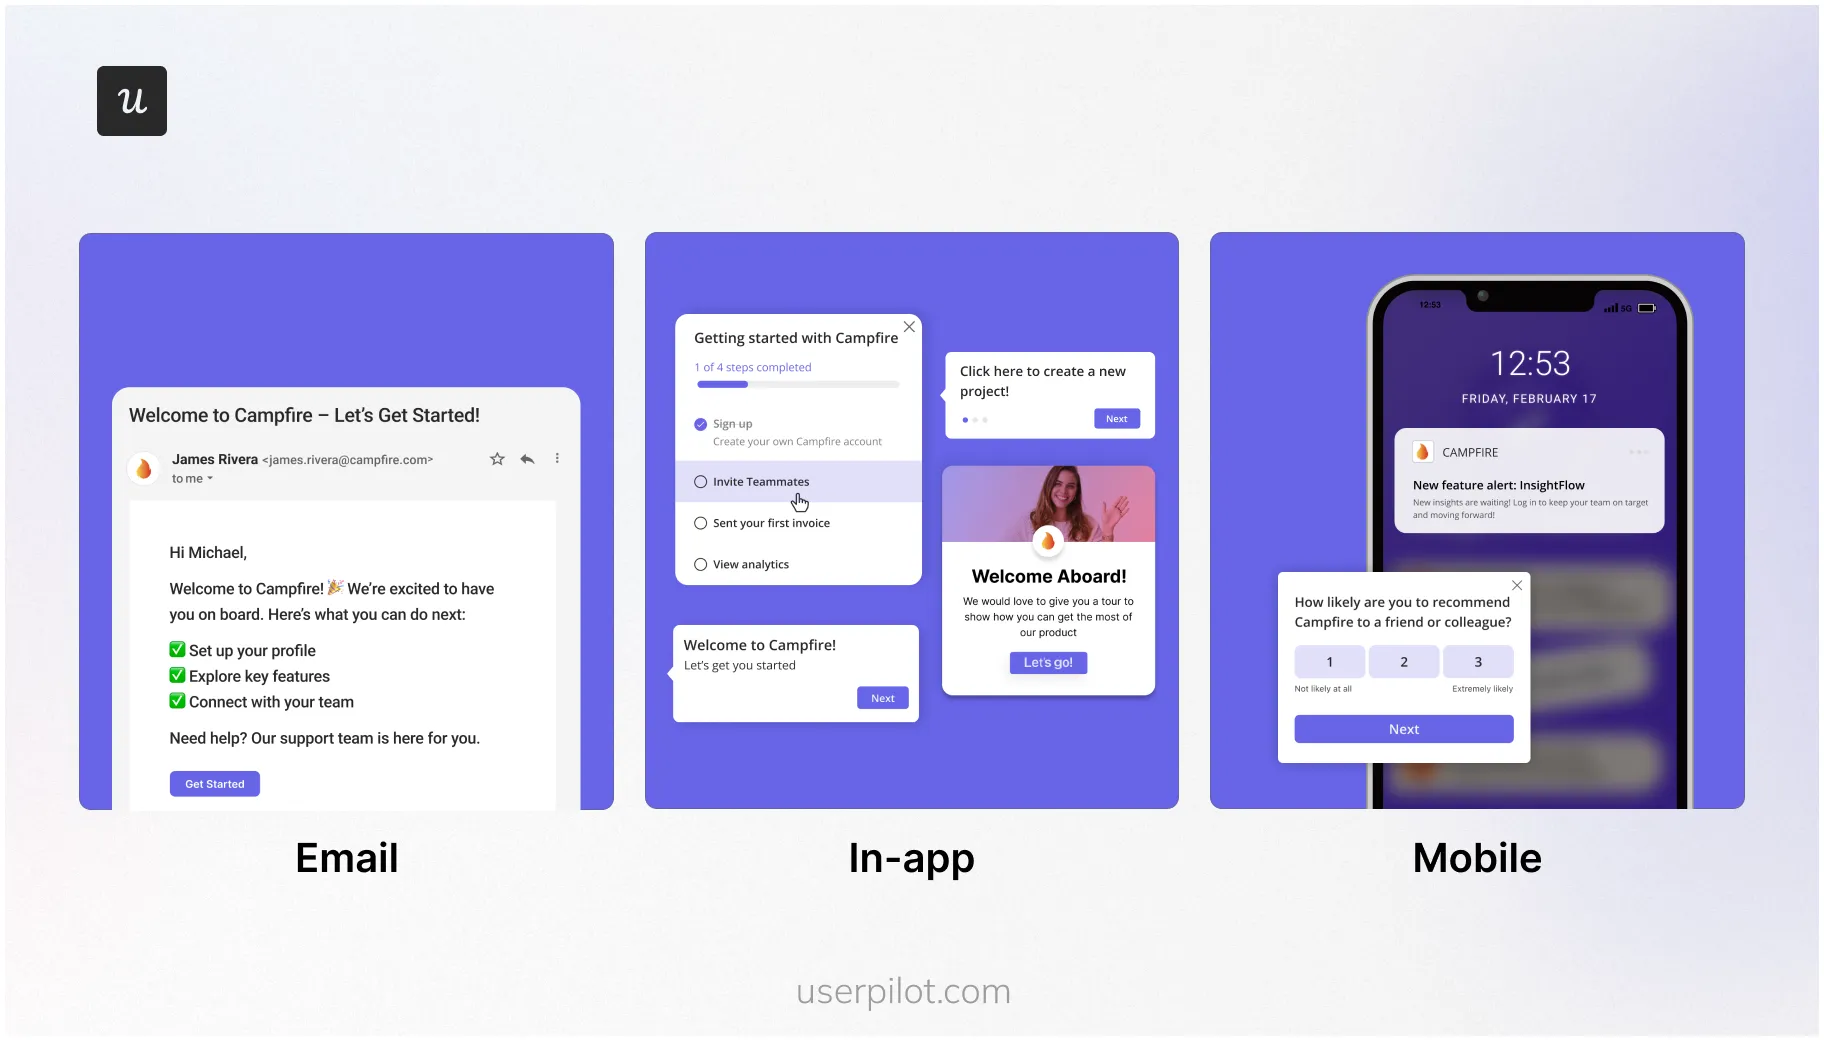
Userpilot empowers you to influence user behavior with data-backed strategies. If analytics reveal friction in onboarding, you can instantly deploy targeted guidance. No waiting, no handoffs, no extra tools. And the best part is these experiences are in synch and consistent across channels. These include:
- UI patterns: Create on-brand tooltips, modals, slideouts, banners, and checklists to provide users with guidance inside the app, drive feature discovery, and foster continuous engagement.
- Mobile flows: Userpilot supports native iOS and Android flows via its mobile SDK, enabling you to trigger carousels and slideouts to engage mobile users.
- Push notifications: Send behavior-based mobile push notifications to re-engage users outside the app, coordinated with in-app experiences as part of a single journey.
- Lifecycle emails: Send tailored lifecycle emails triggered by in-product behavior (e.g., onboarding progress, inactivity, milestones) to reinforce and extend in-app engagement.
Ready to stop just looking at charts and start fixing the metrics they represent? Then get a demo of Userpilot and see how a unified growth platform works in practice.
Userpilot strives to provide accurate information to help businesses determine the best solution for their particular needs. Due to the dynamic nature of the industry, the features offered by Userpilot and others often change over time. The statements made in this article are accurate to the best of Userpilot’s knowledge as of its publication/most recent update on December 28, 2025.
About the author