How to Create User Surveys That Get More Responses



User surveys are questionnaires you send to collect feedback on what users need, where they get stuck, and whether your product is actually delivering value.
The problem is that survey response rates are declining more over time. The UUK’sOffice for National Statistics (ONS) reported a continuous contraction in response rates from approximately 40% to 13%. The main reason is that users are fatigued by surveys. Even if you don’t send users too many surveys, they’re already receiving a lot from airlines, their doctor’s office, and their food delivery app before logging into your product.
This means that if you want to collect user feedback through surveys and close the feedback loop, you need to send enough surveys to gather high-quality data while minimizing response friction. For this, I’ll cover which survey types and questions work, how to minimize this friction, and whether synthetic users are a good alternative.

Why every user survey counts more than ever
As I mentioned, getting survey responses is becoming harder because companies are sending more and more surveys.
Fortune reported that Qualtrics now processes more than 3.5 billion customer and employee interactions a year, double the volume from 2023, and that’s before you count the surveys sent through every other platform. Brad Anderson, president of product and engineering at Qualtrics, put it plainly:
“Survey fatigue is real, and a lot of it comes down to the same brand hitting the same person over and over.”
The result is a data quality problem, not just a volume problem. Peter Fader, a Wharton marketing professor, told Fortune that survey overload skews responses toward the angriest and the happiest people, with almost no response from everyone in between. Priya Raghubir, a marketing professor at NYU, called it exactly what it is:
“You’re getting a very biased view, simply because there’s survey overload.”
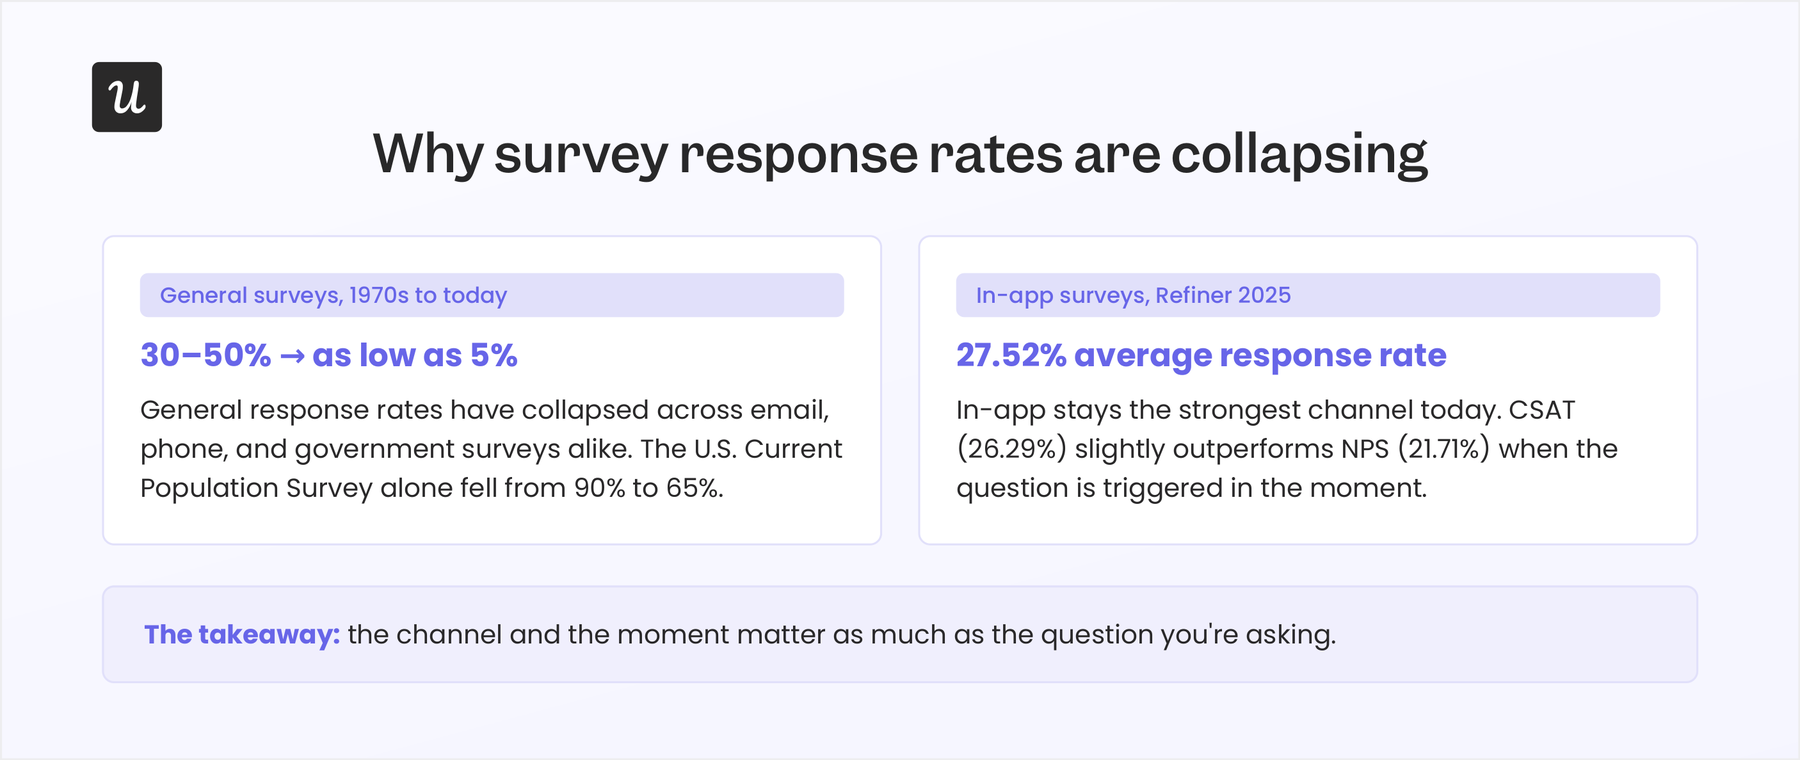
Lauren Leek shared in her newsletter the decline of general survey response rates, which sat between 30% and 50% in the 80s, and have now fallen as low as 5% today. However, Refiner’s 2025 benchmark report, based on more than 1,300 in-app surveys, found an average response rate of 27.52%, which isn’t the best but outperforms the average for general surveys.
Now, with fewer responses coming in, each one has to carry more decision-making weight than before. Vicki Morwitz (a professor at Columbia Business School) said in the Fortune article that companies increasingly have enough behavioral and interaction data to answer their own questions. This doesn’t mean surveys are obsolete, but that user surveys only earn their spot when they ask something your product analytics genuinely can’t answer.
In short, you must use surveys when there’s a clear purpose to them, including:
- Collecting data to create user profiles (with JTBDs, pain points, roles, desires, etc).
- Measuring users’ sentiments with your product and finding ways to improve adoption.
- Finding friction points in the user journey (e.g., the onboarding process) and fixing them so users can reach activation faster.
- Learning why users churn from your product and applying churn prevention strategies to stop the same problems happening again
- Incentivize satisfied users to leave reviews on G2, leave testimonials, or recommend your product.
Which user feedback strategies don’t work anymore?
There are survey strategies that many companies adopted for years as easy gateways to collecting feedback. But now, some of those strategies are becoming less relevant and hurting response rates.
Some of these include:
- Blasting NPS on a fixed schedule to your entire user base: Sending an in-app NPS survey every quarter to everyone (regardless of whether they logged in last week or last used the product six months ago) is a driver of survey fatigue. If a user hasn’t engaged enough with your product to form an opinion, the survey is likely to be ignored.
- Unsegmented email surveys: Getting your emails to land in your users’ inboxes is also becoming harder, not just surveys. KL Communications documented a decline in inbox placement rates for high-volume emails, from roughly 50% to 28% between Q1 2024 and Q1 2025, driven by tighter Gmail and Yahoo filtering rules.
- Purposeless surveys: Many teams developed the habit of sending just any survey to check the box. Now, those surveys that serve no particular purpose add friction to your product.
- Multiple-question surveys: Mixing a rating scale, three multiple-choice questions, and two open-ended survey questions into a single form multiplies the cognitive load and tanks completion rates.
- Time-based triggers: Such as sending a survey 30 days after signup, regardless of what the user has done, produces a weaker signal than event-based ones tied to a completed or abandoned action. This might still be useful at times, but its value is diminishing as it becomes harder to achieve good response rates.
So what are the survey types to target in 2026?
That said, the best survey types today are those with a specific purpose (targeted questions) rather than just gathering random opinions. These are the survey types I’d still recommend:
| Survey type | What it’s for | Question example |
|---|---|---|
| Welcome / profiling survey | Segmenting new users by role and job to be done at signup | “”What are you hoping to get done with [product] this month?”” |
| Product-Market Fit (Sean Ellis) survey | Measuring how essential the product has become to committed users | “”How would you feel if you could no longer use [product]?”” |
| CSAT | Tracking satisfaction at a specific touchpoint, like support or onboarding | “How satisfied were you with [specific interaction]?” |
| CES | Measuring how much effort a task took, right after the user attempts it | “”Product] made it easy to complete this task.”” (agree/disagree scale) |
| NPS | Tracking loyalty among users who’ve had enough time to form a real opinion | “”How likely are you to recommend [product] to a colleague?”” |
| Exit/cancellation survey | Capturing the real reason a user is leaving, while there’s still time to respond | “What’s the main reason you’re canceling today?” |
| UX research survey | Understanding how users think about a specific feature or flow before you redesign it | “Walk me through the last time you tried to [complete task]. What happened first?” |
Note: If you’re running usability testing as a supplement to survey data, the sample-size math differs from what most teams assume. Aim for 5 to 10 participants for qualitative usability testing, since behavior patterns repeat quickly in small samples. But if you need statistically meaningful quantitative data from a larger survey, budget for at least 40 respondents before you trust the results.
How to get more responses for your user surveys
The point of collecting feedback is to act on it. Yet, Zonka Feedback’s State of Feedback Analytics research found that 93% of customer feedback never gets formally analyzed, and 87% of teams still process it manually.
As I said, you need enough user surveys to gather actionable insights, with as little friction as possible to incentivize responses. Here are some of my best tips for getting more, better responses:
Match the question type to the decision
Design your surveys based on the kind of data your team needs right now.
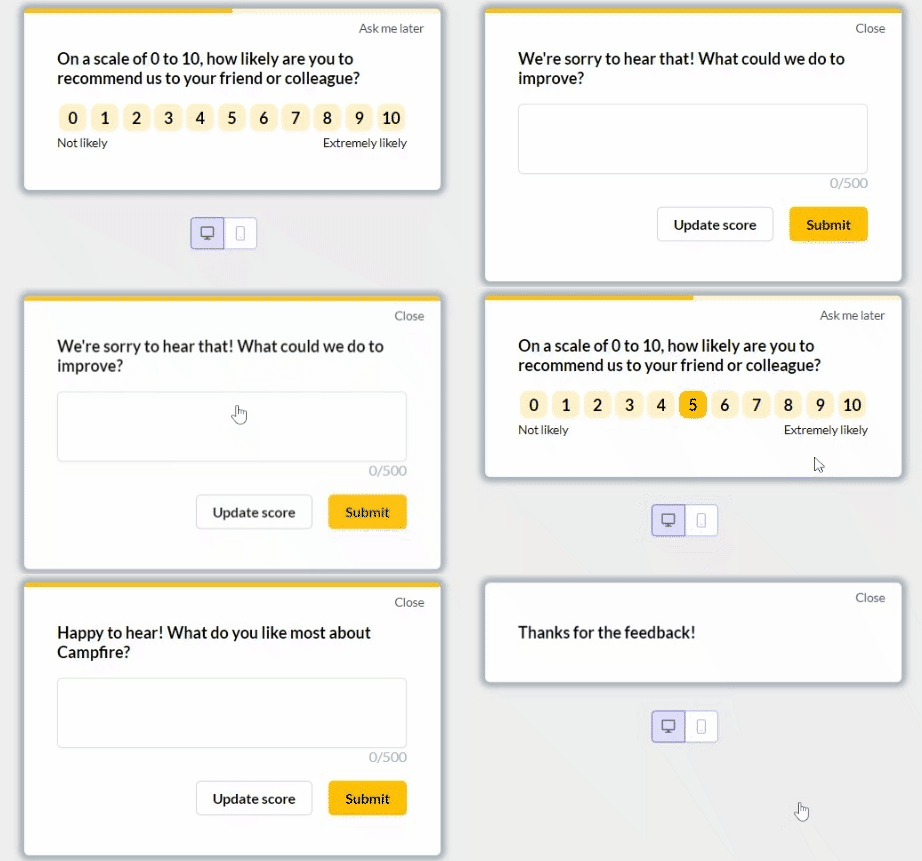
For instance, rating scales and multiple-choice questions give you quantitative data you can trend over time, while open-ended questions give you the qualitative data that explains the “why” behind a behavior. I recommend picking one primary type per survey rather than asking for both, since stacking question types increases the cognitive load on the respondent.
Trigger surveys in context
Good surveys ask about specific aspects of the user experience. And for better responses, they must appear right after the user has gone through a related experience. It could be right after someone completes a workflow, hits a paywall, or abandons a form halfway through, etc.
Time-based triggers, as I mentioned, yield poorer data because the survey is either too superficial or too disconnected from the experience. Also, users are less likely to respond to those since there’s no sense of urgency and they’re too easy to skip.
Target meaningful user segments
You should show your surveys to users who are more ready to answer them.
For instance:
- Sending a feature-adoption survey only to users who’ve actually touched that feature using behavioral data.
- Showing a welcome survey in front of brand-new signups
- Triggering a churn survey to users showing disengagement signals.
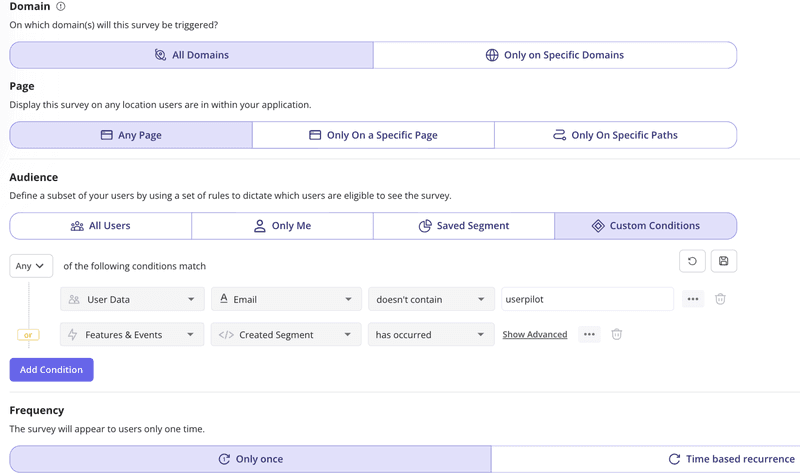
I highly recommend segmenting users based on specific behaviors, like “used feature X at least twice in the last 14 days” or “on an enterprise plan and hasn’t logged in for 10 days.” This usually brings more insights into the product experience that point to a solution.
Add one optional follow-up question
This sounds counterintuitive, since adding more questions often increases response friction.
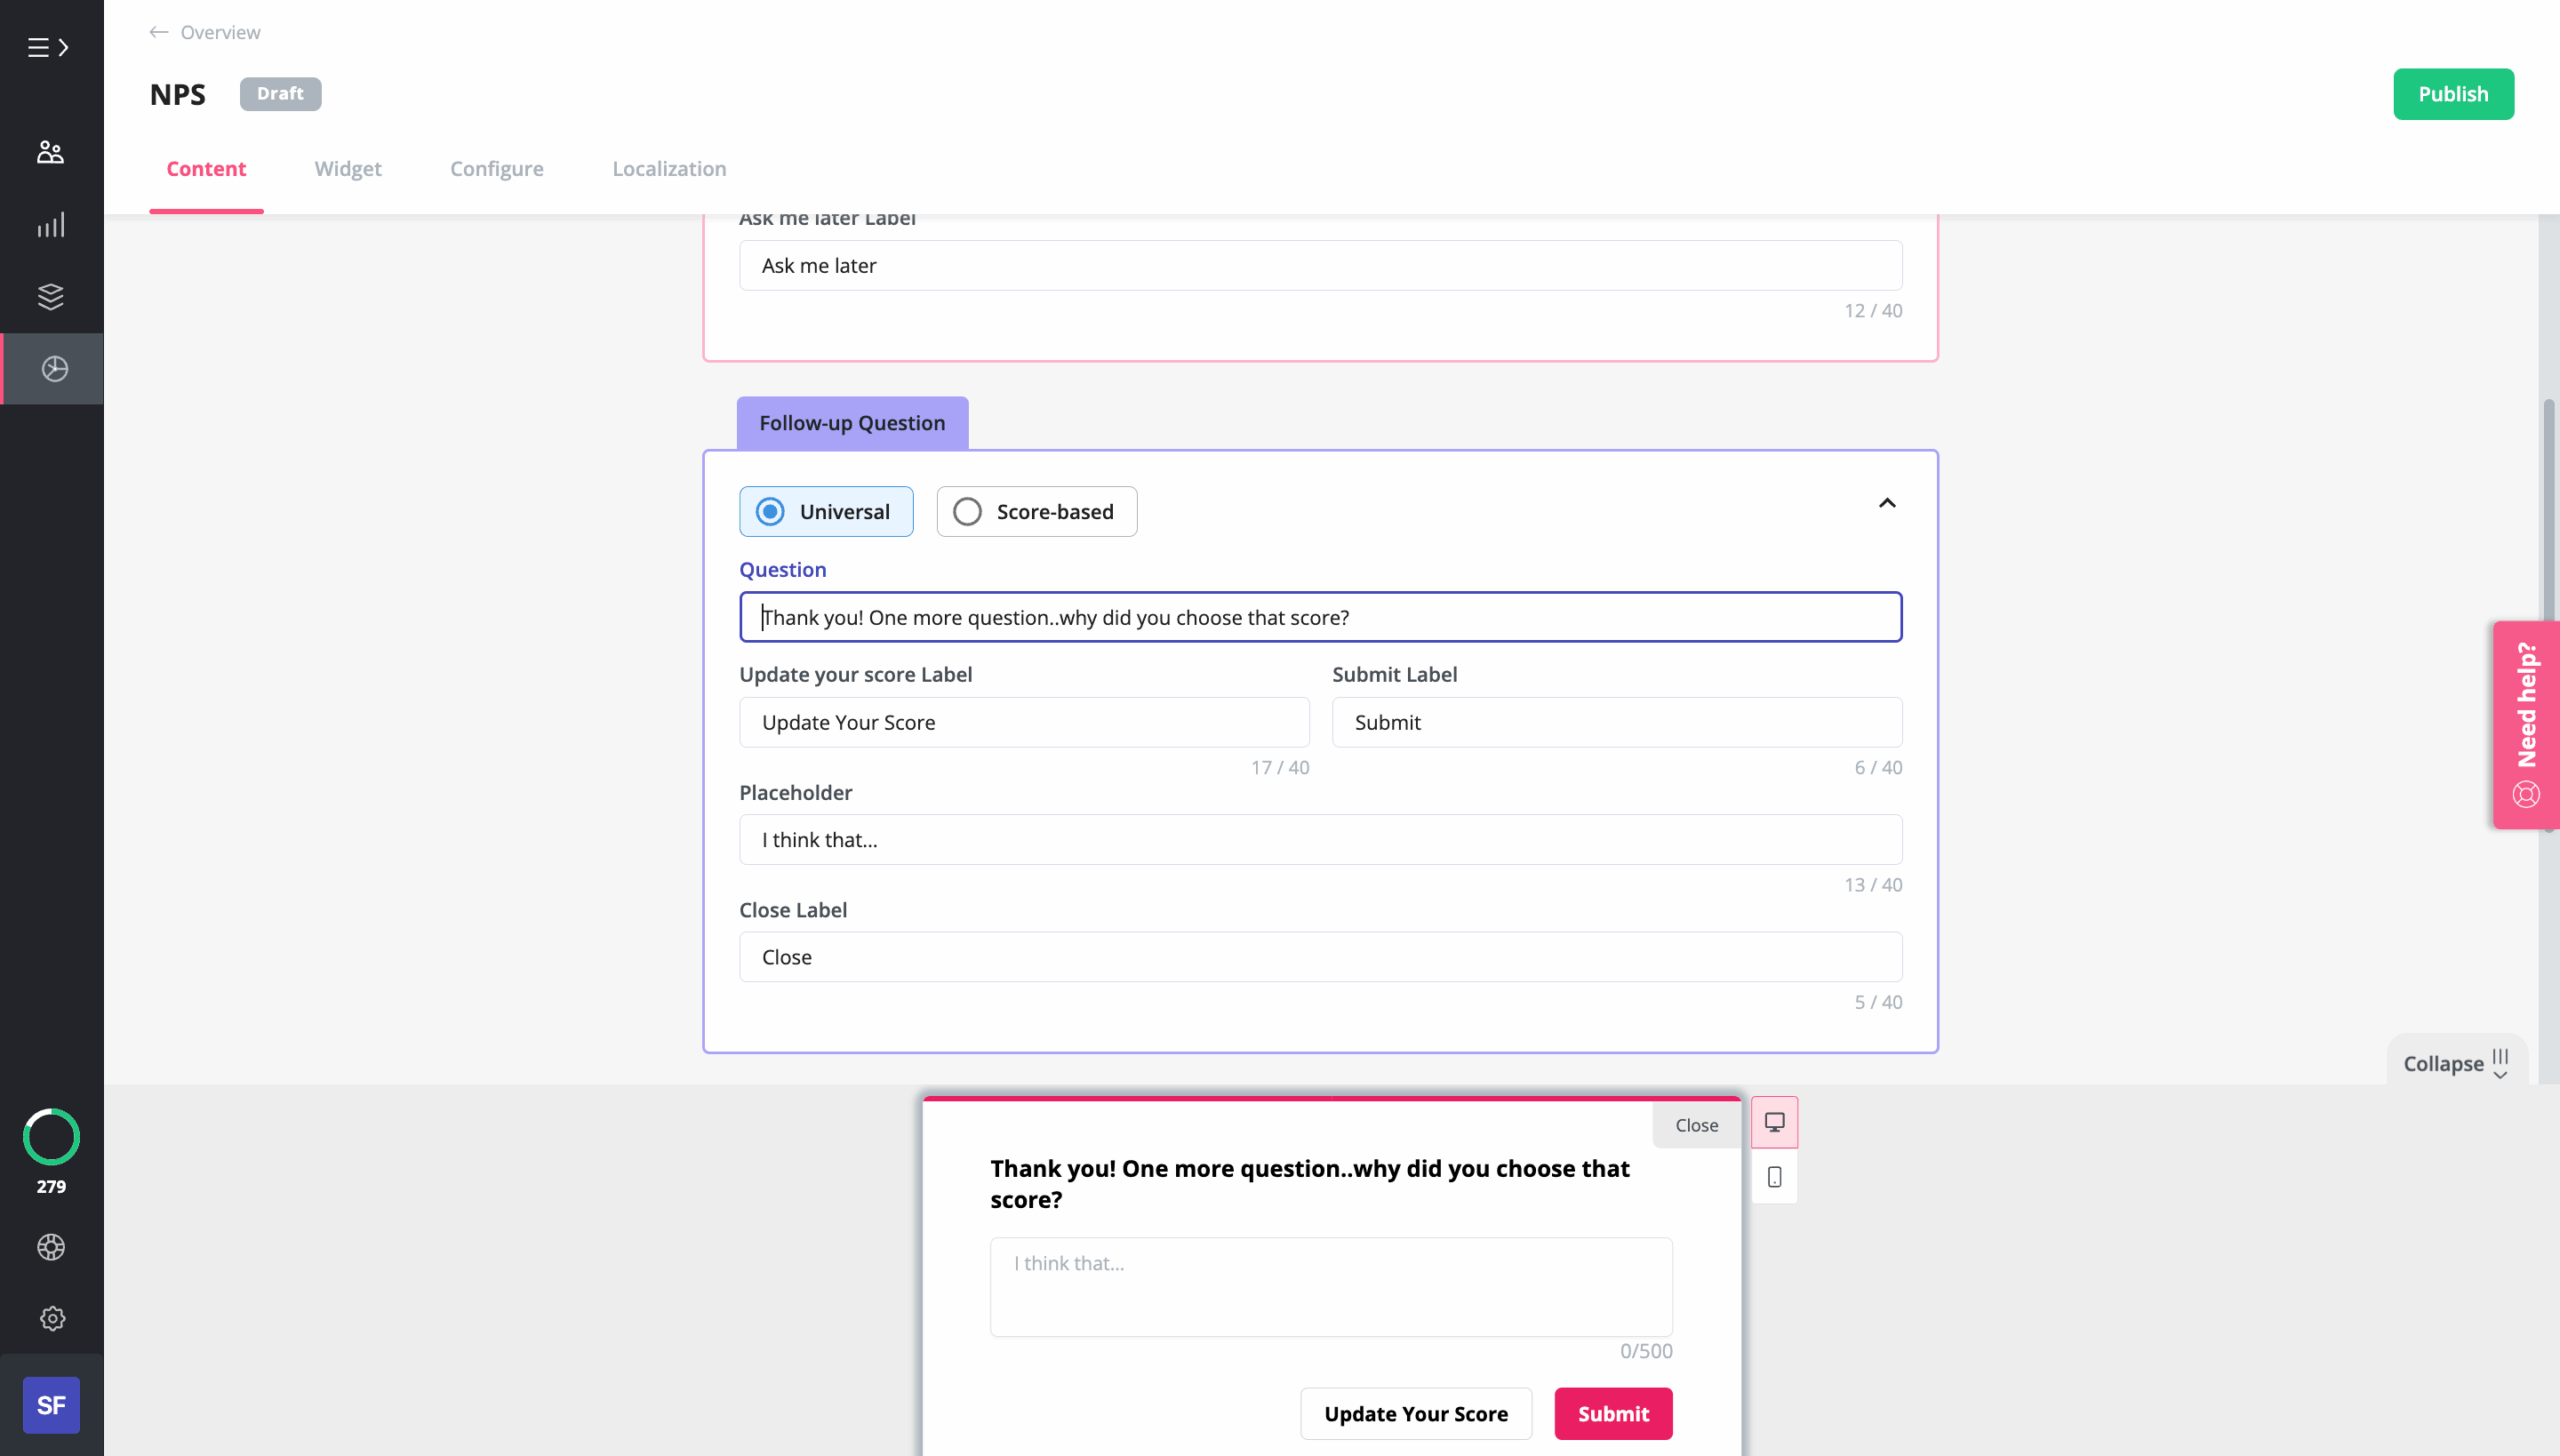
However, a single open-ended follow-up after a rating-scale response turns a number into a reason without forcing every respondent to write an essay. It might take more effort, but the feedback you can get from it is as important as the quantitative data.
For this, I recommend making it optional and easy to skip; this minimizes friction by not forcing the user to write something if they don’t want to. You can also trigger different follow-ups based on the initial rating, like a low CSAT score or a low NPS response.
Avoid misleading survey questions
Another key aspect is the survey questions. They must be specific, neutral, and easy to answer. Anything different will skew your results.
So if you’re using AI to write survey questions and deciding which ones to send, pay close attention to the types of questions you should avoid. Such as:
- Leading questions: Which influence respondents to answer positively. E.g., “”How great was your experience with this feature?”” pushes users toward a positive response before they’ve evaluated their actual feelings.
- Double-barrelled questions: They combine two questions into one. E.g., “”How was the speed and accuracy of your search results?”” produces one response for two entirely separate dimensions of quality.
- Loaded questions: These questions imply what the “correct” answer is before the user responds. E.g., “Is a new user, did you find onboarding easy?” implies that the expected answer is yes.
- Jargon-heavy questions: Basically, any question that requires any technical or insider knowledge of your product. E.g., “How would you rate the performance of our CDN?” is meaningless to most users.
- Vague questions: Questions that are too broad to lead to any valuable insight. E.g., “How satisfied are you with Userpilot?” has nothing to do with what the user just did, so the answers won’t reflect anything about specific features or experiences.
Close the loop, every time
Today, you should never send user surveys without the intention of closing the feedback loop. It will just make it more likely that you’ll never analyze the feedback or make meaningful decisions based on it.
The feedback loop has five steps: collect feedback, analyze it, acknowledge it, act on it, and tell users what changed. As I mentioned earlier, most teams don’t even analyze their survey data, so they don’t act on it or communicate with users.
I highly recommend emailing users who responded negatively to address their issues personally. Sometimes, I binge through the negative open-text responses to spot common pain points, which lets me have a more detailed conversation with users and arrive at a potential solution.
Sometimes the survey data alone is enough for acting (especially when the results shift drastically after a product change). So, if reaching out to users personally isn’t possible for you, you can also close the loop by shipping a meaningful change and communicating it to the users who participated, making them feel heard.
💡 How to build this in Userpilot
To implement most of the tips I explained above, sending simple surveys manually is barely worth the time. And to implement in-app user surveys, you’d usually need help from a dev.
So, I highly recommend looking for a dedicated product feedback tool. They allow PMs and product designers to configure, target, and launch surveys directly through a visual interface, with no sprint ticket required.
This is how the process would usually look:
- Create a survey and pick your question types: One question per survey, tied to a single, specific moment or interaction. I recommend using a rating scale or multiple-choice question for the quantitative data you want to trend, and reserve open-ended fields for the one follow-up you actually plan to read.
- Connect it to a specific event trigger: Tie the survey to a completed action, a specific page, or a milestone. Common event triggers include completing a user onboarding checklist, submitting a support ticket, activating a feature for the first time, or finishing a checkout.
- Define your audience with segmentation: Decide exactly which users should see this survey, based on plan, feature usage, or lifecycle stage. Add an exclusion condition for anyone who has seen any survey in the past 30 days.
- Style it to feel native. Match your product’s colors, fonts, and tone with the survey’s design so it looks integrated within the product.
- Monitor more than just response volumes and averages: Once the survey is running, track how the proportion of positive, neutral, and negative responses changes over time. You can cross-reference negative responses with session replays or product analytics to validate that a problem exists, find an effective solution, and implement it.
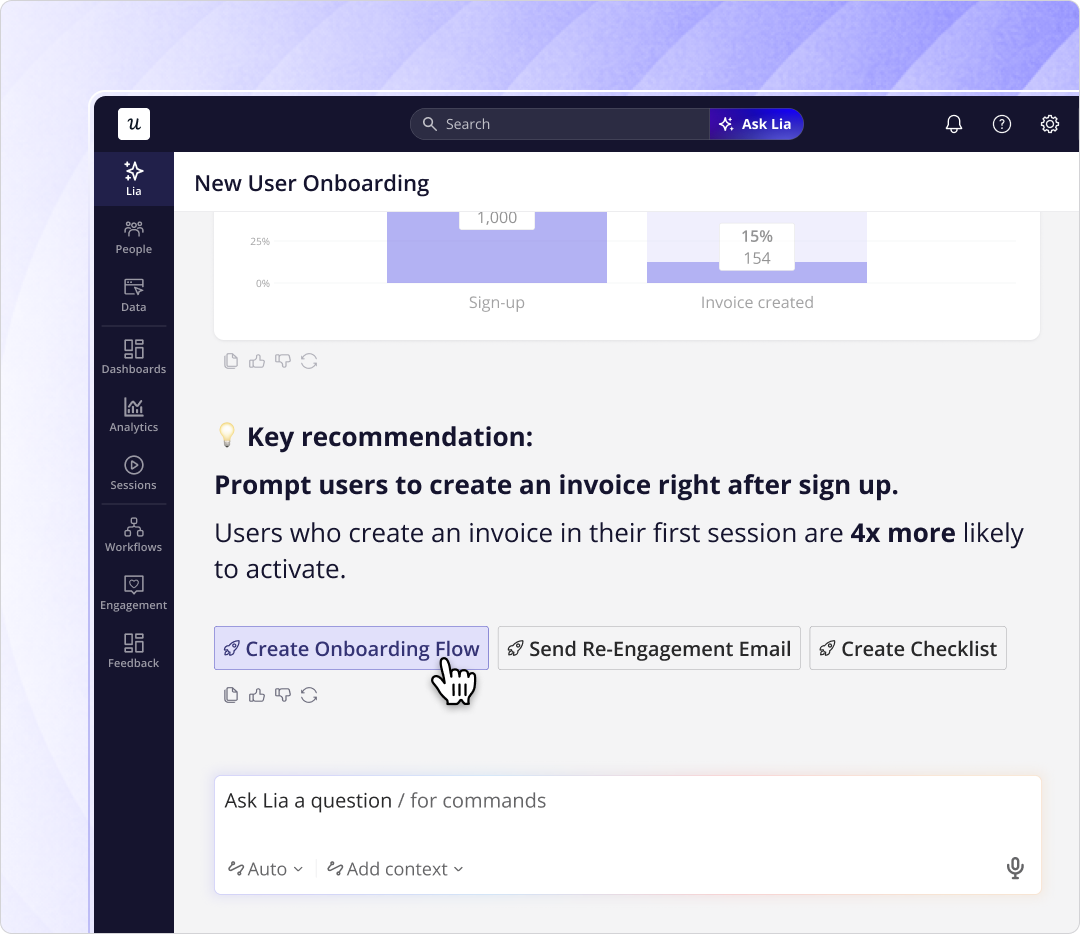
Most survey tools offer a no-code builder, so my advice is to pay attention to how precisely you can segment users and how easily responses connect to the rest of your product data. In Userpilot, specifically, behavioral segments are reusable across surveys, in-app flows, and CS workflows, so you can define a segment once and target every future survey against it instead of rebuilding the logic each time. Also, Lia (our AI agent) can flag when a specific segment’s CSAT scores are dropping alongside usage patterns, giving you a chance to address a problem before it turns into churn.
Are synthetic users worth trying as a replacement for user surveys?
For context, synthetic users are AI-generated personas that answer interview and survey questions as if they were real people, they’ve gone from a niche experiment to a genuine industry debate in about eighteen months.
The case for trying them is real. Qualtrics reported that 94% of senior marketing and insights leaders say AI already gives them a competitive advantage, and 95% say they’re using or planning to use synthetic data within 12 months to fill data gaps and simulate audience segments. Their own fine-tuned model, tested against Dollar Shave Club and GGabb’s real customer data, produced directionally similar results at a fraction of the cost and turnaround time, according to marketing leaders at both companies.
However, Maria Rosala and Kate Moran at Nielsen Norman Group tested synthetic users against interview transcripts across three studies. They found a consistent gap: synthetic respondents were more agreeable, more idealized, and far less specific than the humans they were supposed to represent.
In one comparison, a real user admitted to dropping out of an online course after three of seven modules because a new job ate their time. The synthetic version of that same user claimed to have completed every module and described how each one “broadened my knowledge and skill set,” which is the kind of overconfident, generic answer that sinks a product decision if you don’t catch it.
Even Hugo Alves (co-founder of the company literally named Synthetic Users) doesn’t pretend the tool replaces real people:
“You’re never gonna stop talking to real people, and you shouldn’t. There are some decisions that you shouldn’t even go to synthetic users for. You should just go to humans.”
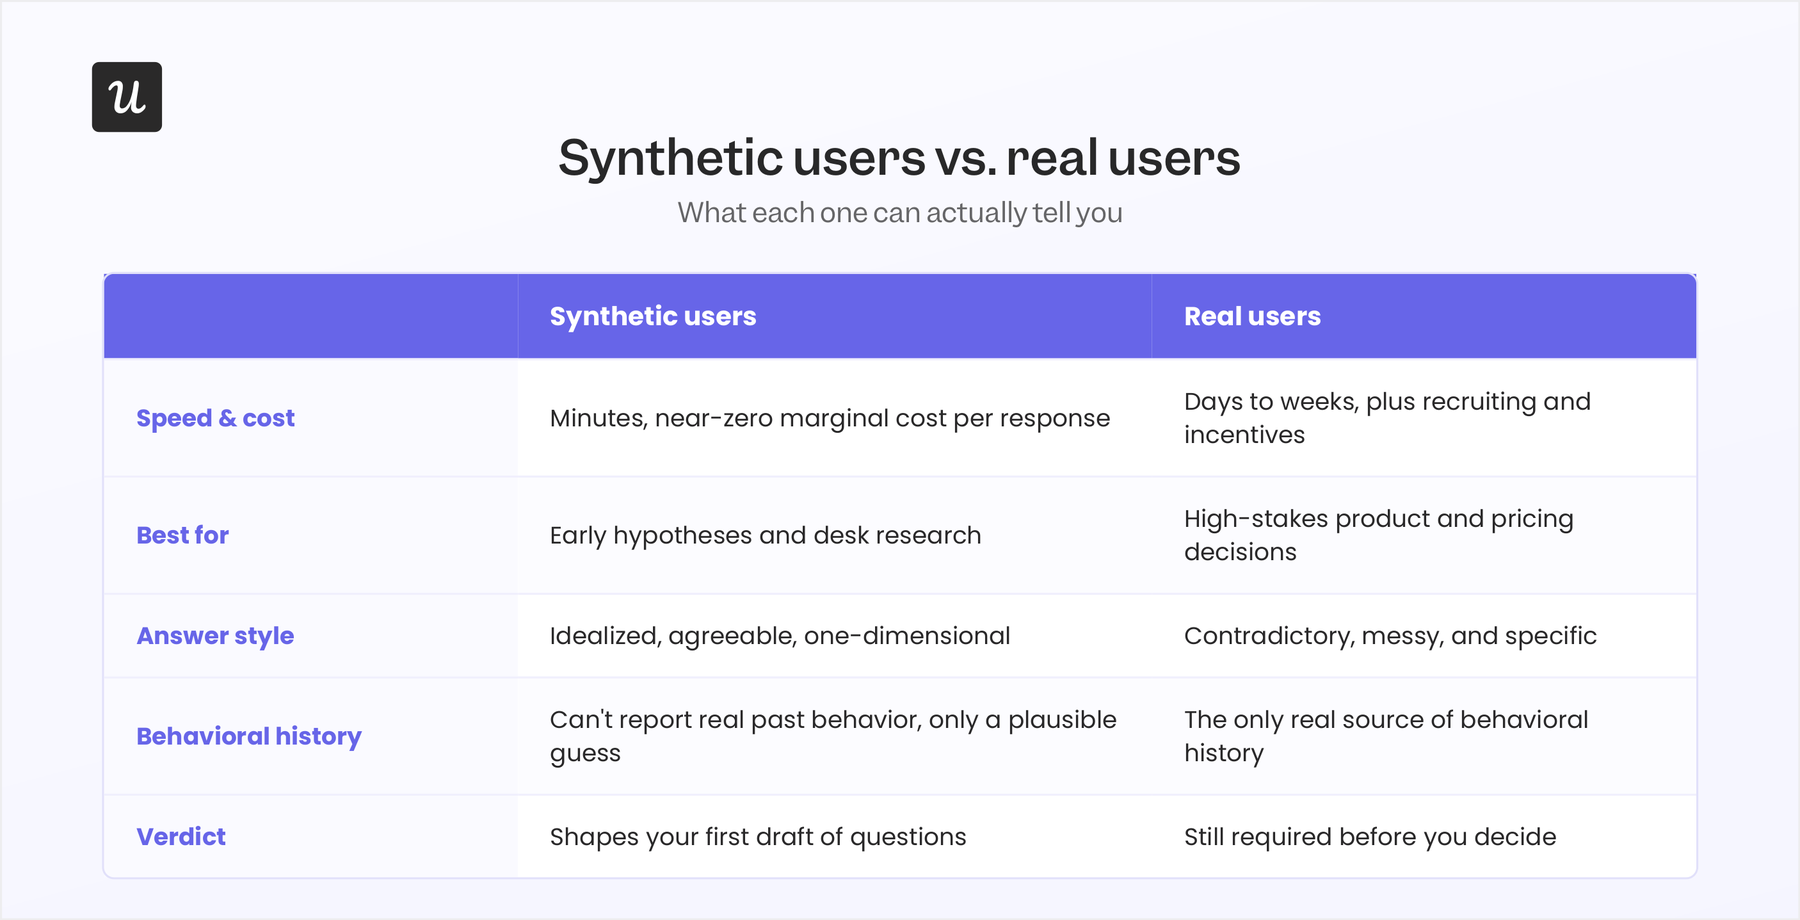
In my opinion, synthetic users are a reasonable stand-in when there’s genuinely no other option, like exploring a totally new market segment before you’ve recruited a single real customer there. They’re a poor option for high-impact decisions and won’t catch the messy, often contradictory responses from real users.
Get better response rates with Userpilot’s targeted in-app surveys!
User surveys in 2026 aren’t dead; they need to be more efficient. This means matching the survey type with the data you need, keeping questions more specific, targeting by real behavior, and closing the loop.
If you want to see how targeting, triggers, and AI-assisted analysis work together in one place, book a Userpilot demo, and we’ll walk you through the survey builder.
About the author