Survey Analytics: Step-By-Step Process for Analyzing Data (+Best Tools)
Want to truly connect with your customers and understand their needs and pain points?
Then, it’s high time you start using survey analytics.
Instead of shooting arrows in the dark, you can collect feedback directly from customers and act on it using this tactic.
How are you currently handling survey analytics?
Choose the option that best describes your current process.
What’s your biggest challenge with survey analysis?
Pinpoint the primary bottleneck in your workflow.
How crucial is integrating survey data with product analytics?
Consider how this would impact your decision-making.
Unlock actionable insights from your survey analytics.
Stop guessing and start making data-driven decisions. Userpilot combines powerful survey analytics with product analytics to show you the ‘why’ behind user actions. See how it works.
Try Userpilot Now
See Why 1,000+ Teams Choose Userpilot

What is survey analytics?
Survey analytics is the process through which you can understand customer feedback from surveys to gain actionable insights and find improvement opportunities.
When you successfully harness user survey insights from user feedback, you can build data-driven business strategies and continuously drive customer value. This can help drive increased customer satisfaction and retention.
Types of survey data to analyze
Surveys help you collect multiple types of data when you ask the right set of specific questions. Here are five major types of survey data:
Quantitative data
Quantitative data, called numerical data, makes it easy to analyze customer feedback and spot trends and patterns. This enables you to get rich data-driven results that can be compared across time periods or user segments.
You can use Userpilot to gather quantitative data from close-ended questions like the one below. Based on the statistical data, you can easily analyze and measure data changes over time.

Qualitative data
Using qualitative data is crucial because it includes important details that quantitative data can’t provide.
But what exactly is qualitative data? It’s non-numerical data, such as text, audio, etc., that you collect from users. But here’s the thing—this data is usually unstructured, and that makes it challenging to measure it compared to quantitative data.
However, it’s still possible to analyze this data to draw key insights that you could miss out on if you solely rely on quantitative data.
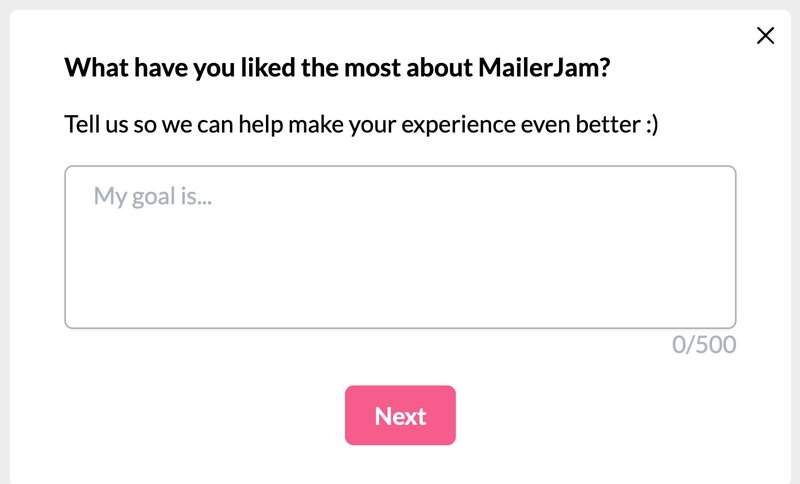
You can collect qualitative feedback from open-ended survey questions. For instance, these could be follow-up questions in ranking/score-based surveys like the Net Promoter Score (NPS) surveys, asking for detailed feedback.
On the other hand, you also have the option to create a single qualitative question in a survey, like the survey shown below.
Categorical data
Categorical data is data that doesn’t have any numerical value and can’t be called qualitative data as well. However, you could use it to gather feedback from your users by providing them with specific options.
For example, you can ask users to choose between different scenarios to identify their main use case. You can even provide an option like “Other” and have them enter the relevant response themselves.
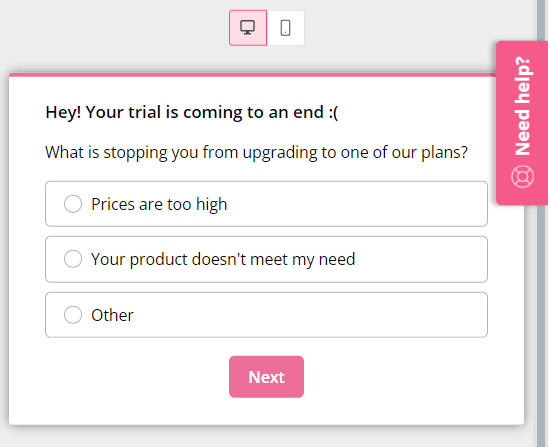
With the right categorical questions for surveys, you get discrete data that can be grouped into meaningful information, such as company sizes, user roles, most useful product features, etc.
Ordinal data
This type of data is used primarily to group varied data into straightforward, ordered groups. Additionally, the options that are provided in these surveys are arranged hierarchically based on their levels of importance.
You can give users the ability to rank the options in the survey relative to each other. It helps you figure out what users find more important among the options you’ve given. For example, you can use ordinal scale questions to ask people to rate or rank three product features through a feedback survey.
Scalar data
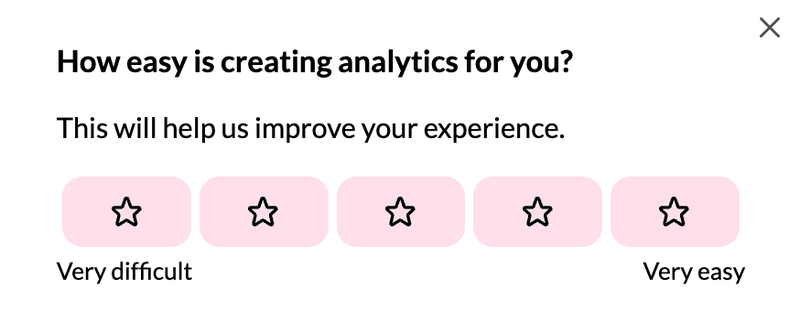
As the name suggests, this type of data is collected from surveys where you have a particular scale of measurement. For instance, you could have a question about the ease of use of your product and have users choose between a scale of 1 and 10.
The scalar data can be used to capture customers’ sentiments to help you understand if any changes to your approach are needed.
The key here is that the scale you use must have a consistent distance between each point and should be measurable. For instance, in the rating question below, on a scale from very difficult (1 star) to very easy (5 stars), has an equal difference of 1 between the intervals.
Step-by-step process on how to analyze survey results
If you’re wondering how to analyze survey data, use the following steps to get started:
1. Trigger surveys at different customer touchpoints
Before you start analyzing survey data points, you need to collect detailed and meaningful customer feedback. The key is to identify crucial touchpoints where it makes sense to launch in-app surveys.
For instance, you can trigger a welcome survey when a user logs into your product for the first time. Similarly, you can launch relevant surveys after a user completes an onboarding flow or makes their first purchase. You can easily identify these touchpoints using path analysis.
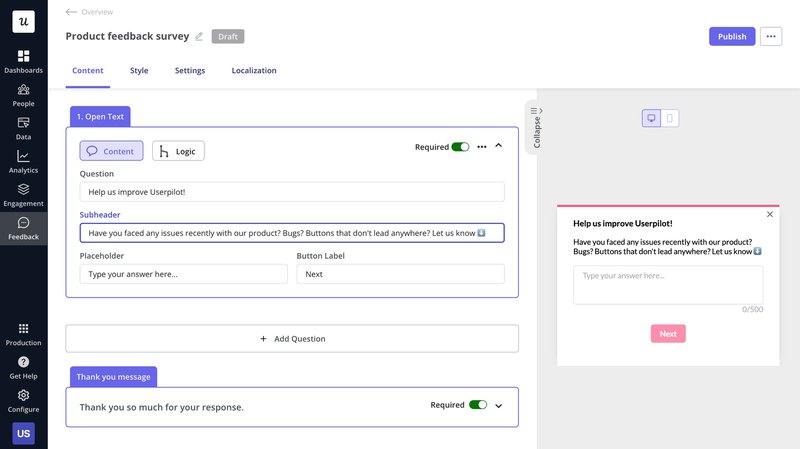
You should ask a variety of survey questions at each step to get the most in-depth feedback. Besides active surveys, which prompt users to submit feedback, you can also use passive feedback options.
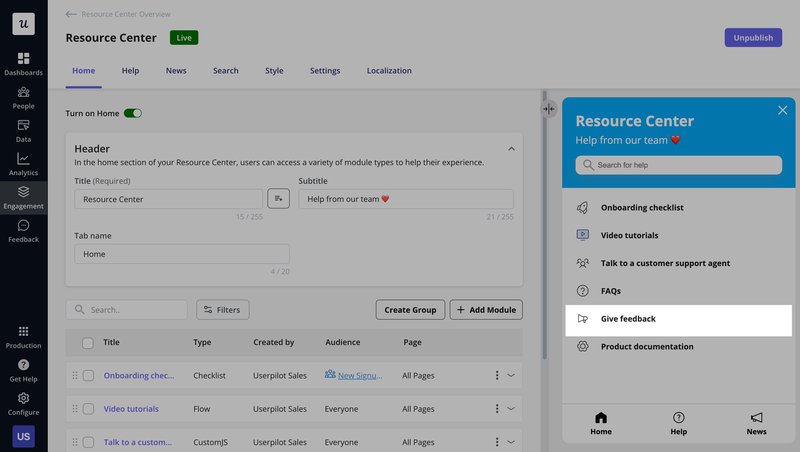
Passive feedback helps you collect feedback from users without disrupting their experience. For instance, you can add a “Give Feedback” option to the in-app help center, like below:
2. Use a survey analytics dashboard to visualize data
The best way to analyze survey data is to use an analytics dashboard. With one, visualizing and reporting survey results becomes straightforward.
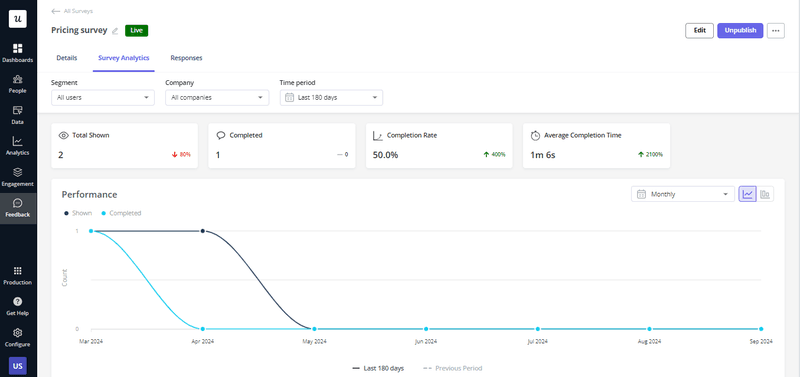
The survey analytics dashboard in Userpilot gives insights into survey performance metrics, including dismiss rate, completion rate, time-to-completion, etc. What makes it even better is that you can visualize survey responses in the form of charts and graphs.
The image below shows an NPS dashboard that displays the NPS survey data, NPS average score, NPS score charts, etc.
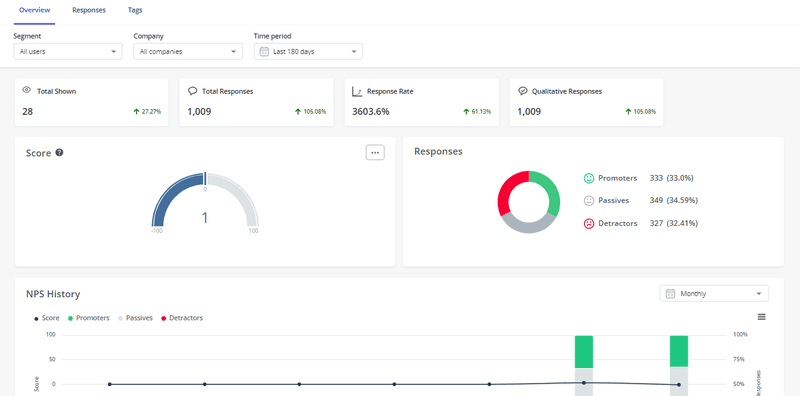
If you notice a reduction in NPS scores among a particular user segment, you can create targeted re-engagement strategies to improve their user experience.
3. Tag survey responses to identify trends
Tagging survey responses is very effective for gathering insights from qualitative data. Survey response tags let you categorize this data and identify customer pain points from it.
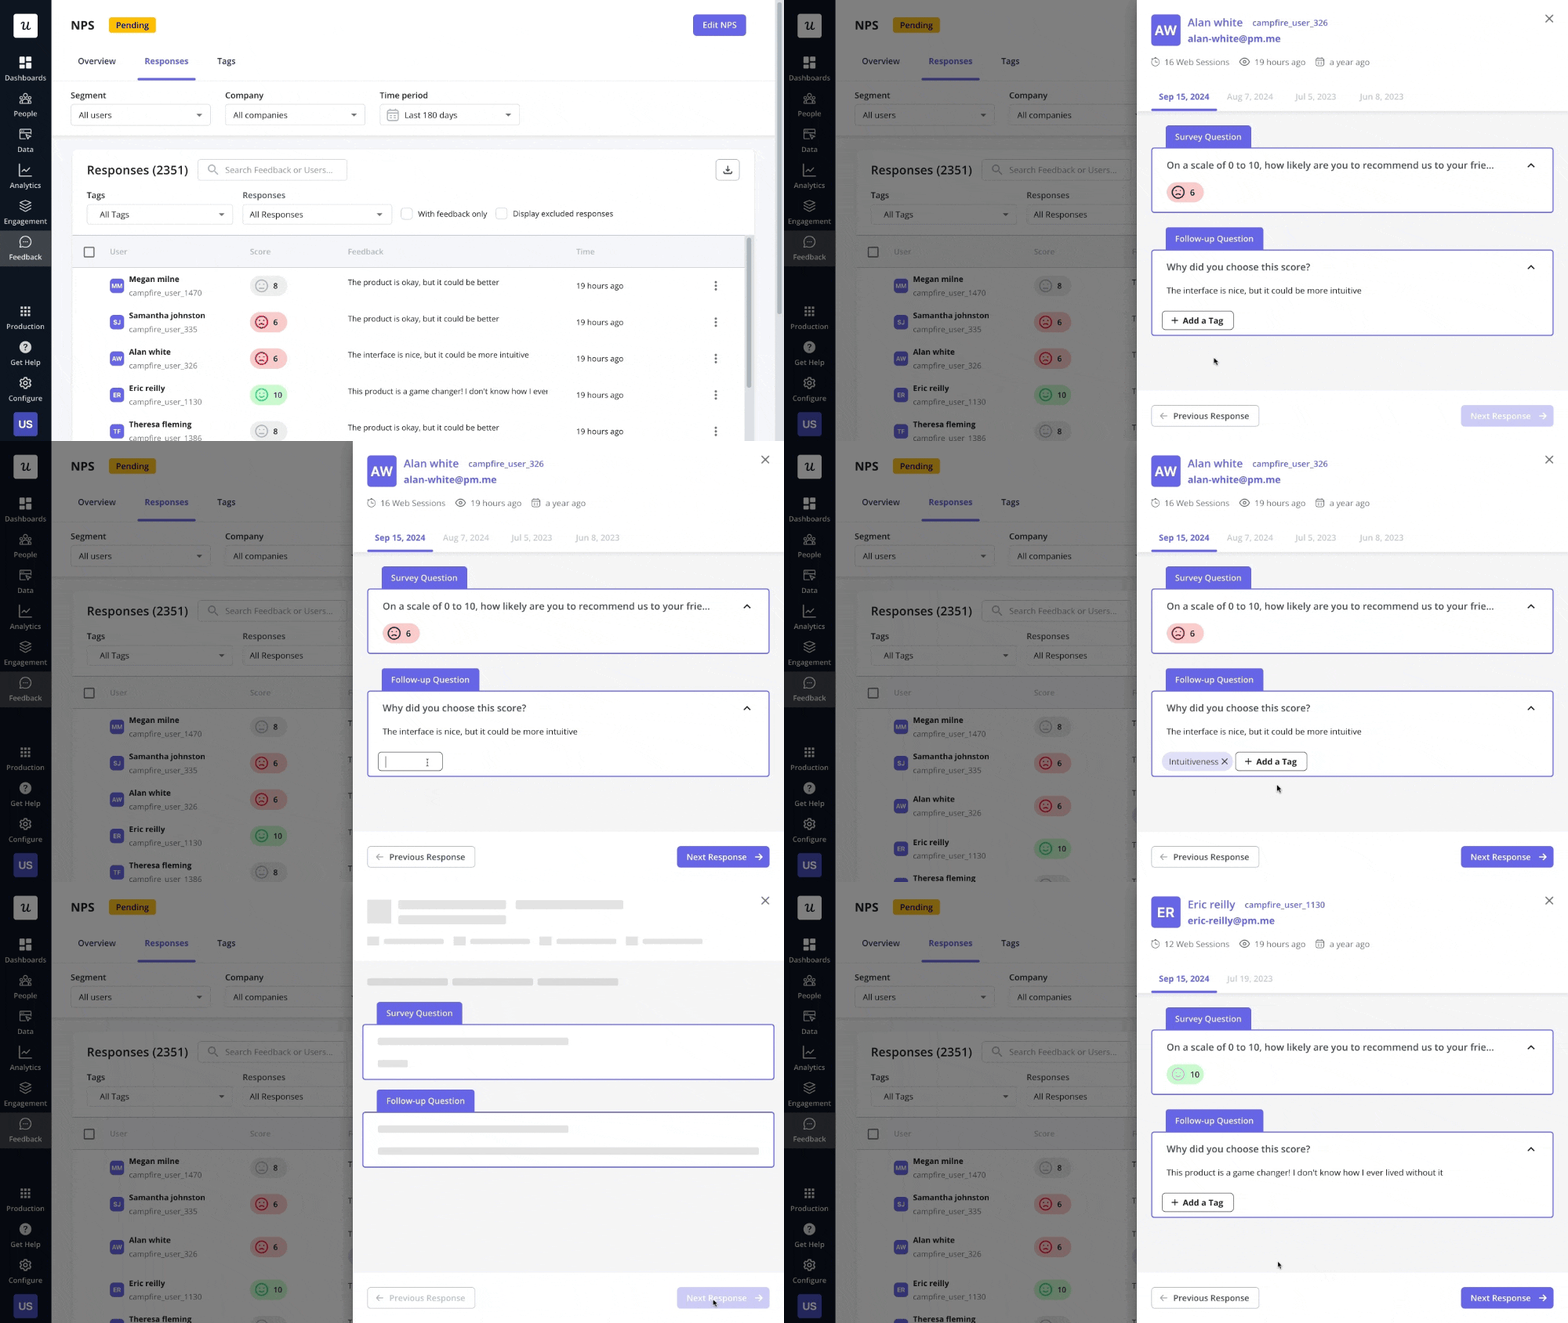
The image below shows the responses collected from NPS response tags. You can add a qualitative follow-up question in NPS surveys to further dive into the reasons behind a user’s rating.
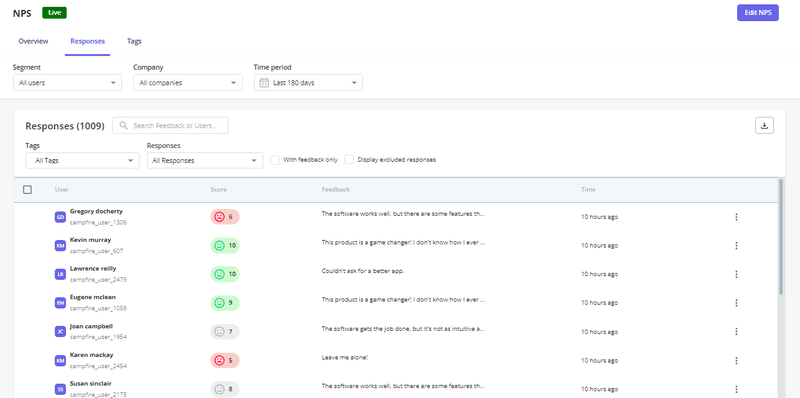
Tagging these responses helps you organize the feedback into categories like usability, customer support, performance, pricing, and more. You can then look at the NPS scores of each category to understand how users feel about them.
When a category has a higher percentage of detractors than promoters, it could mean that there are serious issues that need to be resolved.
4. Conduct a statistical analysis for an in-depth assessment
Statistical analysis is an umbrella term for various mathematical methods to quantify and interpret customer feedback data. These methods help you identify patterns and seasonal trends in survey responses, enabling you to make data-driven decisions to improve your product and drive customer satisfaction.
The most commonly used statistical analytics methods include:
- Regression analysis – It evaluates the relationship between a dependent variable and one or more independent variables.
- T-test – It compares the means of two groups to understand how product development decisions impact user sentiment.
- ANOVA (Analysis of Variance) – This compares the means of three or more data sets and can be used to analyze survey responses from different user segments.
5. Act on the insights from survey data analysis
Knowing how to analyze data from a survey isn’t enough. You also have to derive actionable insights from the analysis and identify the necessary areas of improvement.
Let’s say most users rate the onboarding experience poorly and mention that it’s too complex. You can use this information to cut down the number of steps in the onboarding flow and walk users through the most essential features first.
Similarly, survey insights might indicate that users can’t understand how a specific feature/tool works. Implementing a step-by-step walkthrough can help improve feature adoption.
The best tools to analyze survey data for actionable insights
Analyzing survey data becomes a cakewalk when you use the right tools to collect and process customer feedback.
If you want to use survey insights to improve your product and skyrocket user satisfaction, the following tools will come in handy:
Userpilot
Userpilot is an all-in-one product growth platform that offers several features to gather and analyze user feedback. With it, you can build in-app onboarding flows, launch different types of surveys, and monitor user behavior.
When it comes to survey analytics, the most useful features include:
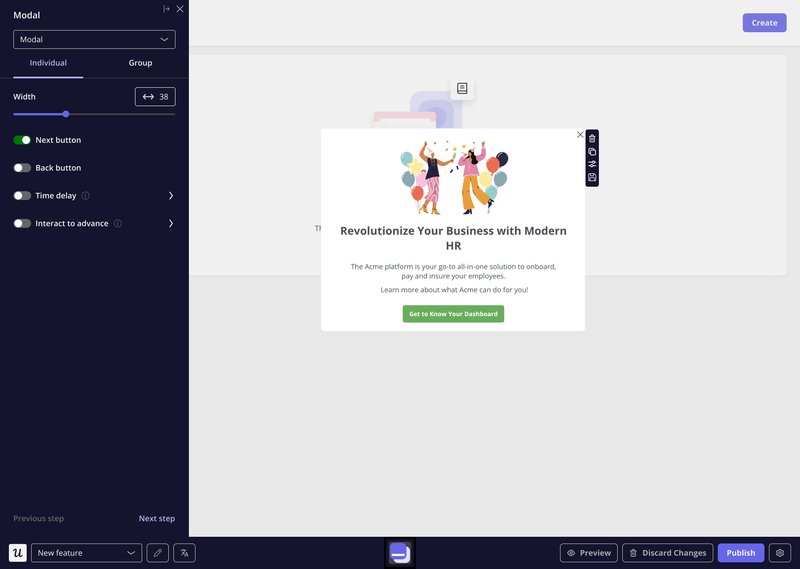
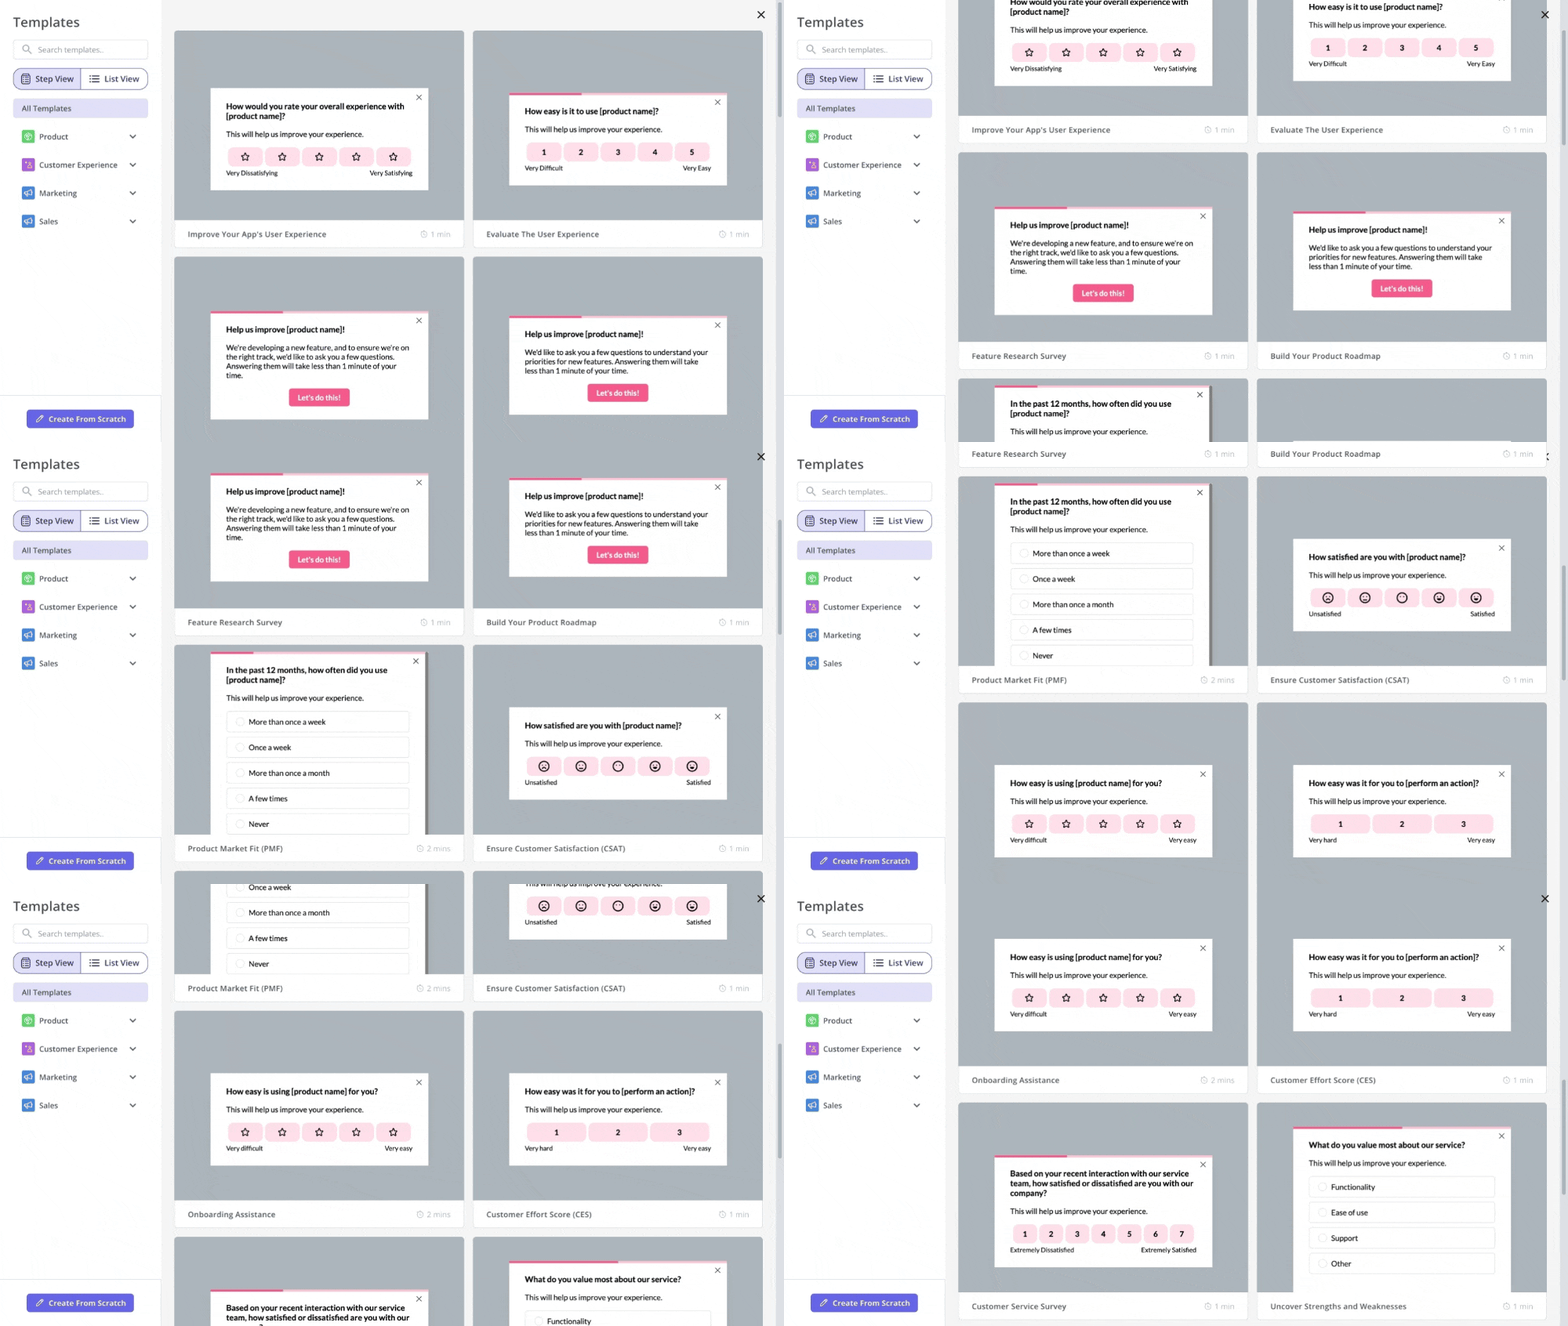
- No-code survey builder – You can choose from a variety of pre-designed survey templates and customize them. You also have the option to design surveys from scratch without writing a single line of code.
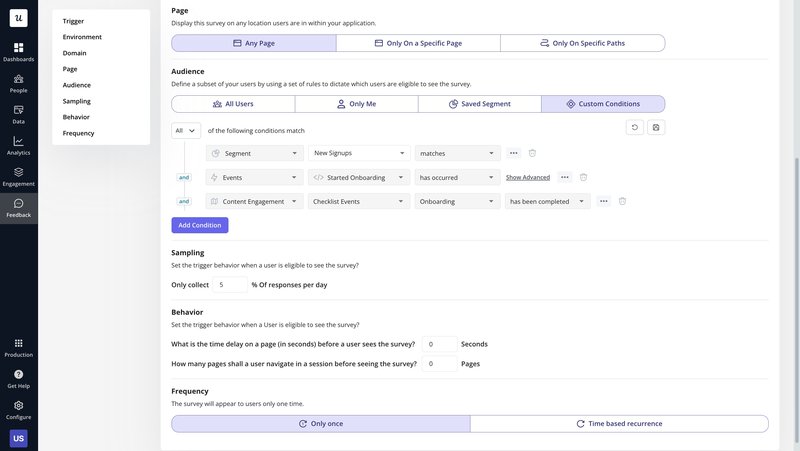
- Advanced survey targeting – You can trigger surveys for specific user segments or after certain events, such as when a user tries a new feature or visits a specific page.
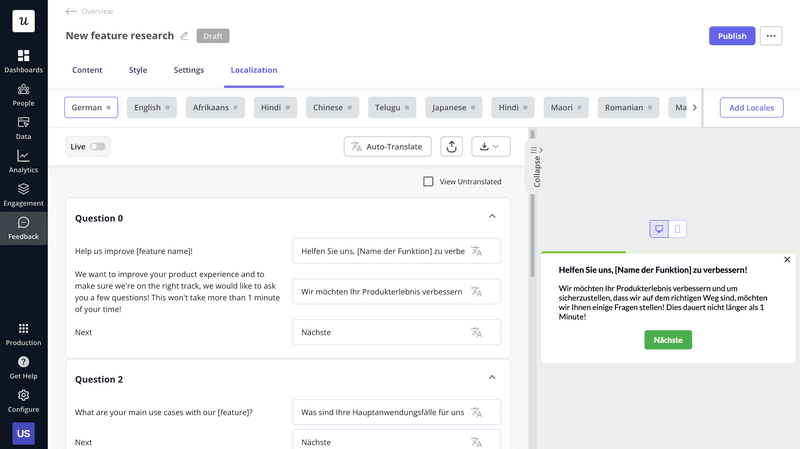
- Survey localization – It’s possible to create surveys in your audience’s native language. This helps increase response rates and ensures that you have a large and unbiased response group to analyze.
- Survey analytics – Userpilot offers a visual dashboard that shows key metrics like completion rate and average completion time. For instance, the NPS dashboard offers insights into the average NPS score, score charts, and more.
- Response tagging – With Userpilot, you can group responses with similar patterns and make the analysis process faster and simpler.
Crunch.io
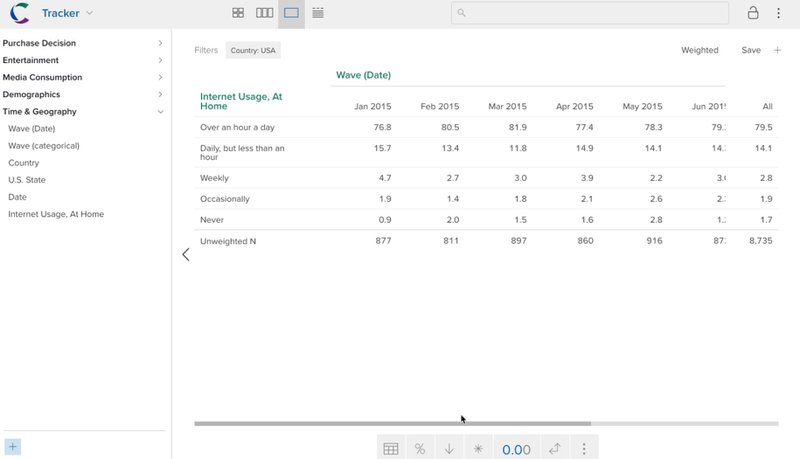
Crunch.io is a cloud-based survey data management platform that lets you integrate multiple survey sources and analyze current and historical data. With it, you can even create dashboards and filter survey data without writing any code.
Key features include:
- A drag-and-drop interface that makes it easy to build analytics dashboards and monitor key metrics.
- The ability to integrate multiple data sources and search across all datasets.
- Survey data handling, including weighting, stats testing, and multiple response questions.
- A proprietary columnar database that ensures sub-second response times.
Survicate
Survicate is a customer survey solution that lets you collect feedback at various points in the user journey. It enables you to run surveys on various channels, including your app and website. Creating email and link-based surveys is also possible.
When it comes to survey analytics, Survicate offers the following features:
- Pre-built survey templates and advanced targeting.
- Automated feedback collection with recurring surveys.
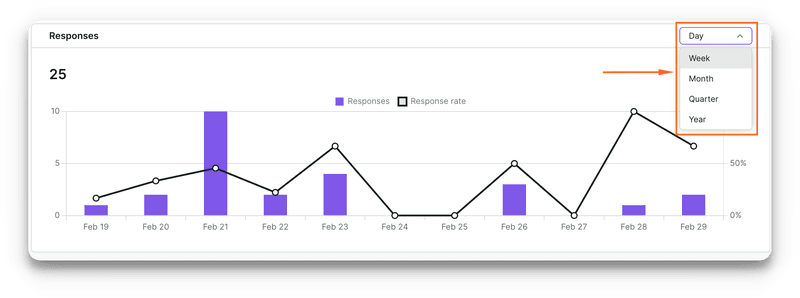
- Analytics dashboard and AI-powered insights (beta).
- Integration with CRM platforms and analytics tools.
Conclusion
Survey analytics can help you dive deep into your users’ minds and understand what you’re getting right and what needs changing. With a combination of qualitative, quantitative, scalar, and ordinal data, you can gather insights and make your product more user-friendly.
Userpilot allows you to create and send in-app surveys and analyze responses thoroughly to get product growth insights. Want to see how it can help your brand? Get a Userpilot demo and see how surveys can transform your business.


