Try Userpilot Now
See Why 1,000+ Teams Choose Userpilot

What is business analytics?
Business analytics is the process of using statistical methods and techniques to interpret business data.
The insights from this process can help companies identify trends, patterns, and areas for improvement—ultimately helping them optimize operations, increase efficiency, and achieve their business goals.
Business analytics vs business intelligence vs data science
Although these terms are sometimes used interchangeably, they differ in focus and approach.
Business intelligence uses descriptive analytics to interpret historical data, helping you understand what has happened and why.
Business analytics builds on the foundation of business intelligence. Instead of just summarizing past data points, it attempts to make educated predictions about what might happen in the future.
And finally, data science focuses on using algorithms and statistical models to turn raw data into conclusions.
How does business analytics primarily differ from standard business intelligence (BI)?
Which type of analytics goes beyond predicting outcomes to recommend specific actions?
How can SaaS companies best use business analytics to increase revenue?
Unlock the power of business analytics with Userpilot.
Go from raw data to revenue-generating insights with our AI-powered analytics suite.
Types of business analytics
Business analysts use various methods to interpret data and guide decision-making. Each method has its specific focus, insights, and application:
- Descriptive analytics summarizes past data to understand what happened. It uses data aggregation and data mining techniques to provide insights into historical performance and trends, often through reports and dashboards.
- Diagnostic analytics aims to determine why something happened. It delves deeper into the data to find the causes of past outcomes by using techniques such as drill-down, data discovery, and correlation analysis.
- Predictive analytics uses historical data to predict future outcomes. Using statistical modeling and machine learning techniques, businesses can identify patterns and anticipate trends, helping them to plan effectively and stay ahead of changes.
- Prescriptive analytics goes beyond predicting scenarios and recommends actions to achieve desired results. For example, after identifying that a recent product update caused the drop in active users, prescriptive analytics can recommend potential solutions to the issue, such as rolling back the update, releasing a hotfix, or providing additional user support.
What are the use cases of business analytics?
Wondering how business analytics can actually help your SaaS?
Here are just four of the use cases:
Evaluate the effectiveness of marketing campaigns
With business analytics, you can analyze acquisition costs across various channels and marketing strategies to determine the effectiveness of each approach.
By understanding which channels drive the most conversions, you can better allocate resources and focus on the most successful tactics.
Identify opportunities for upselling
Business analytics uses historical data such as subscription history, product usage, customer feedback, and support interactions to identify the right customers and the right time for upselling.
This helps ensure that the customer will actually benefit from the update, thus it’s more likely they’ll convert.
For example, after collecting customer data, businesses can create a segment of customers who consistently exceed their usage limits.
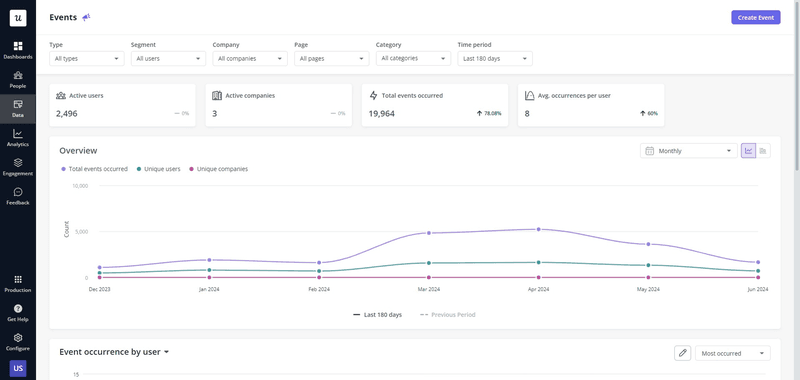
Then, they can trigger an upgrade message for them, offering a premium plan.
Enhance financial planning
Business analytics provides insights into revenue trends, cash flow patterns, and expense management, enabling more accurate forecasting and budgeting.
By analyzing historical financial data and identifying seasonal patterns or emerging trends, you can make informed business decisions about resource allocation, investment opportunities, and cost-cutting measures.
For instance, if analytics indicate a predictable increase in customer acquisition during a specific period, you can plan for additional marketing spend to capitalize on this trend.
Successful business analytics examples from leading brands
Let’s explore a few examples that illustrate how data-driven insights can transform SaaS products.
ClearCalcs
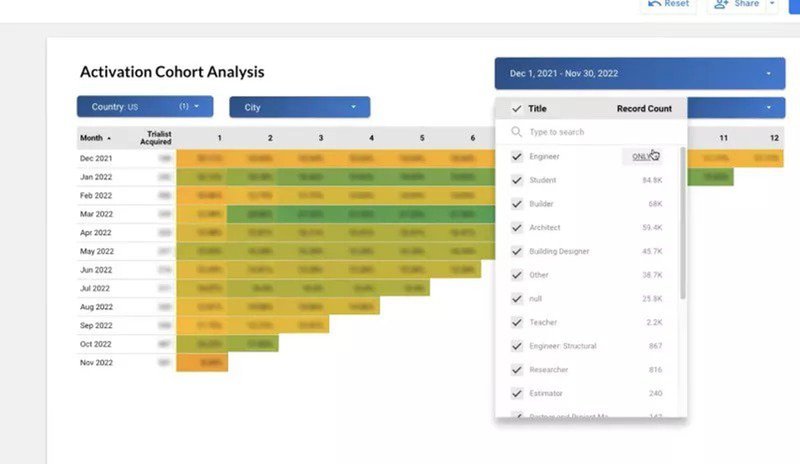
ClearCalcs, a structural design software, recognized that a significant portion of its potential user base wasn’t fully engaging with the platform. By utilizing business analytics and cohort analysis, it pinpointed the precise stage where users were dropping off during onboarding.
Armed with this knowledge, ClearCalcs leveraged Userpilot to create personalized onboarding flows that addressed specific user needs, resulting in a notable increase in user activation rates.
This strategic use of data allowed ClearCalcs to proactively guide new users toward value, ensuring a smoother and more successful initial experience.
Cuvama
Cuvama, a value selling tool for sales teams, employed a combination of business intelligence, and data analytics to enhance their users’ interactions.
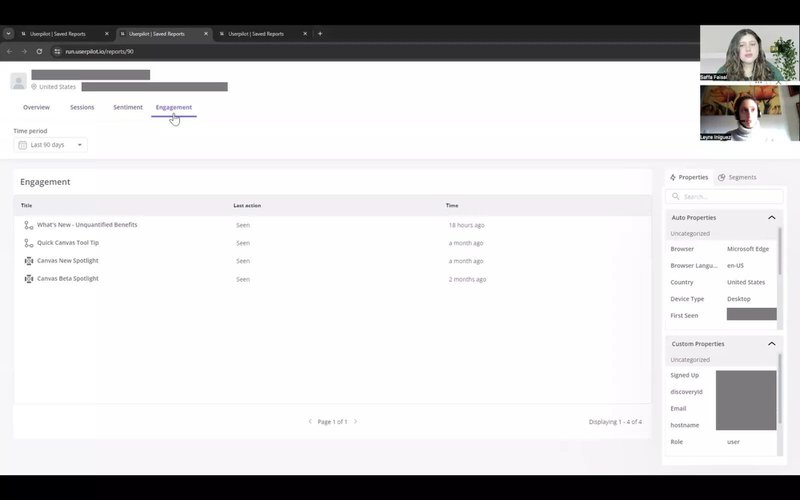
Through path analysis, they detected an error message that was hindering a subset of users.
By utilizing Userpilot’s user profile feature, Cuvama was able to identify and directly connect with the affected individuals, promptly address the error, and improve the overall user experience.
DocuSign
DocuSign is a leading platform for digital transaction management and electronic signatures. To boost its freemium-to-paid conversion rates, the employed business analytics to identify which premium features would most effectively drive upgrades.
By providing free users with access to select premium features and using funnel analytics to track their usage, DocuSign achieved a 5% improvement in conversions.
Best business analytics tools for SaaS
Here are some of the leading business analytics tools that can transform your SaaS business.
Userpilot – best business analytics tool for self-serve analytics
Userpilot is a comprehensive product growth platform designed to help SaaS businesses optimize user engagement and drive product growth.
Through its robust analytics capabilities, Userpilot provides actionable insights into user behavior, enabling data-driven decisions that fuel growth.
Here’s an overview of Userpilot’s analytics features:
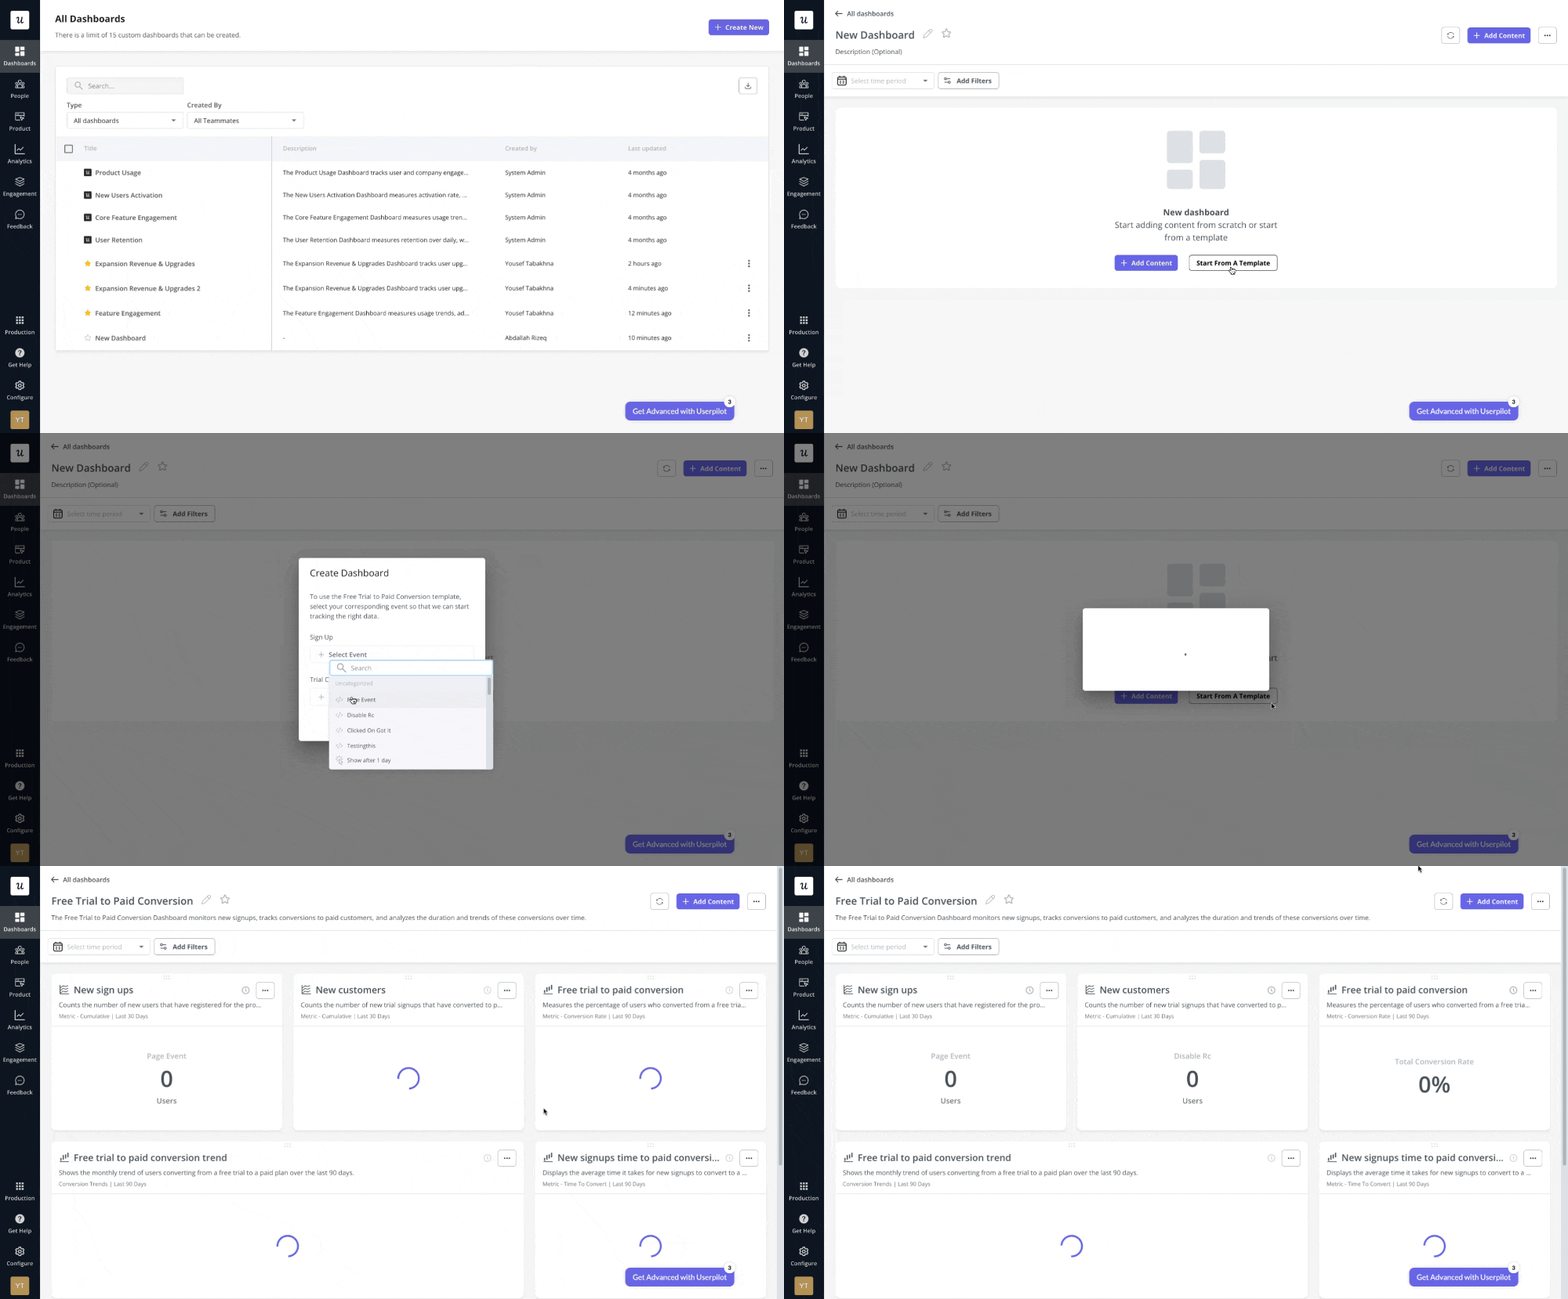
- Custom analytics dashboards: Userpilot empowers you to build fully customizable dashboards that display the most relevant metrics for your SaaS product. You can monitor KPIs like user activation, feature adoption, retention, and revenue growth in real-time.
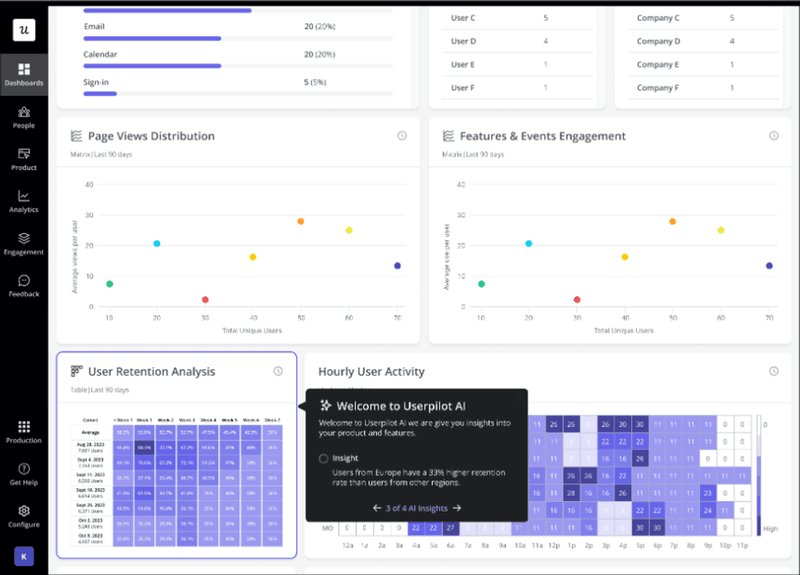
- AI analytics: This feature helps you make sense of the collected data and spot patterns that may not be immediately obvious through manual analysis. You get AI-driven summaries and actionable insights that can help you improve your strategy.
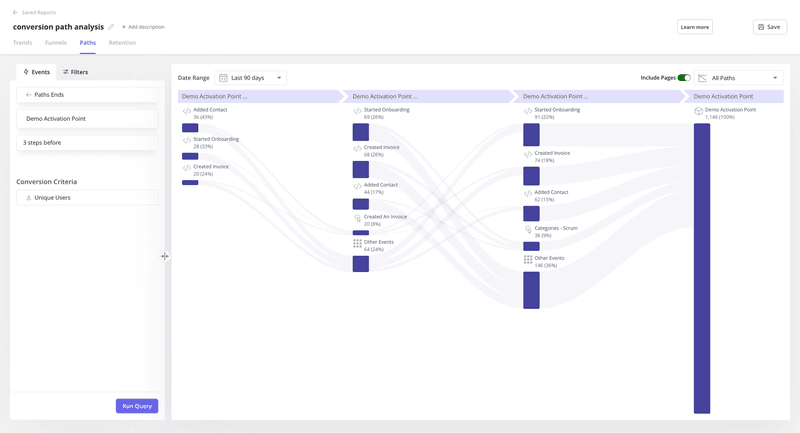
- Analytics reports: Userpilot offers comprehensive analytics reports, including trend reports, funnel reports, path reports, and retention tables. These reports provide actionable insights into user behavior and product interaction. For instance, you can use path analysis reports to see the sequence of steps users take to achieve goals and the percentage of users that move to each next step.
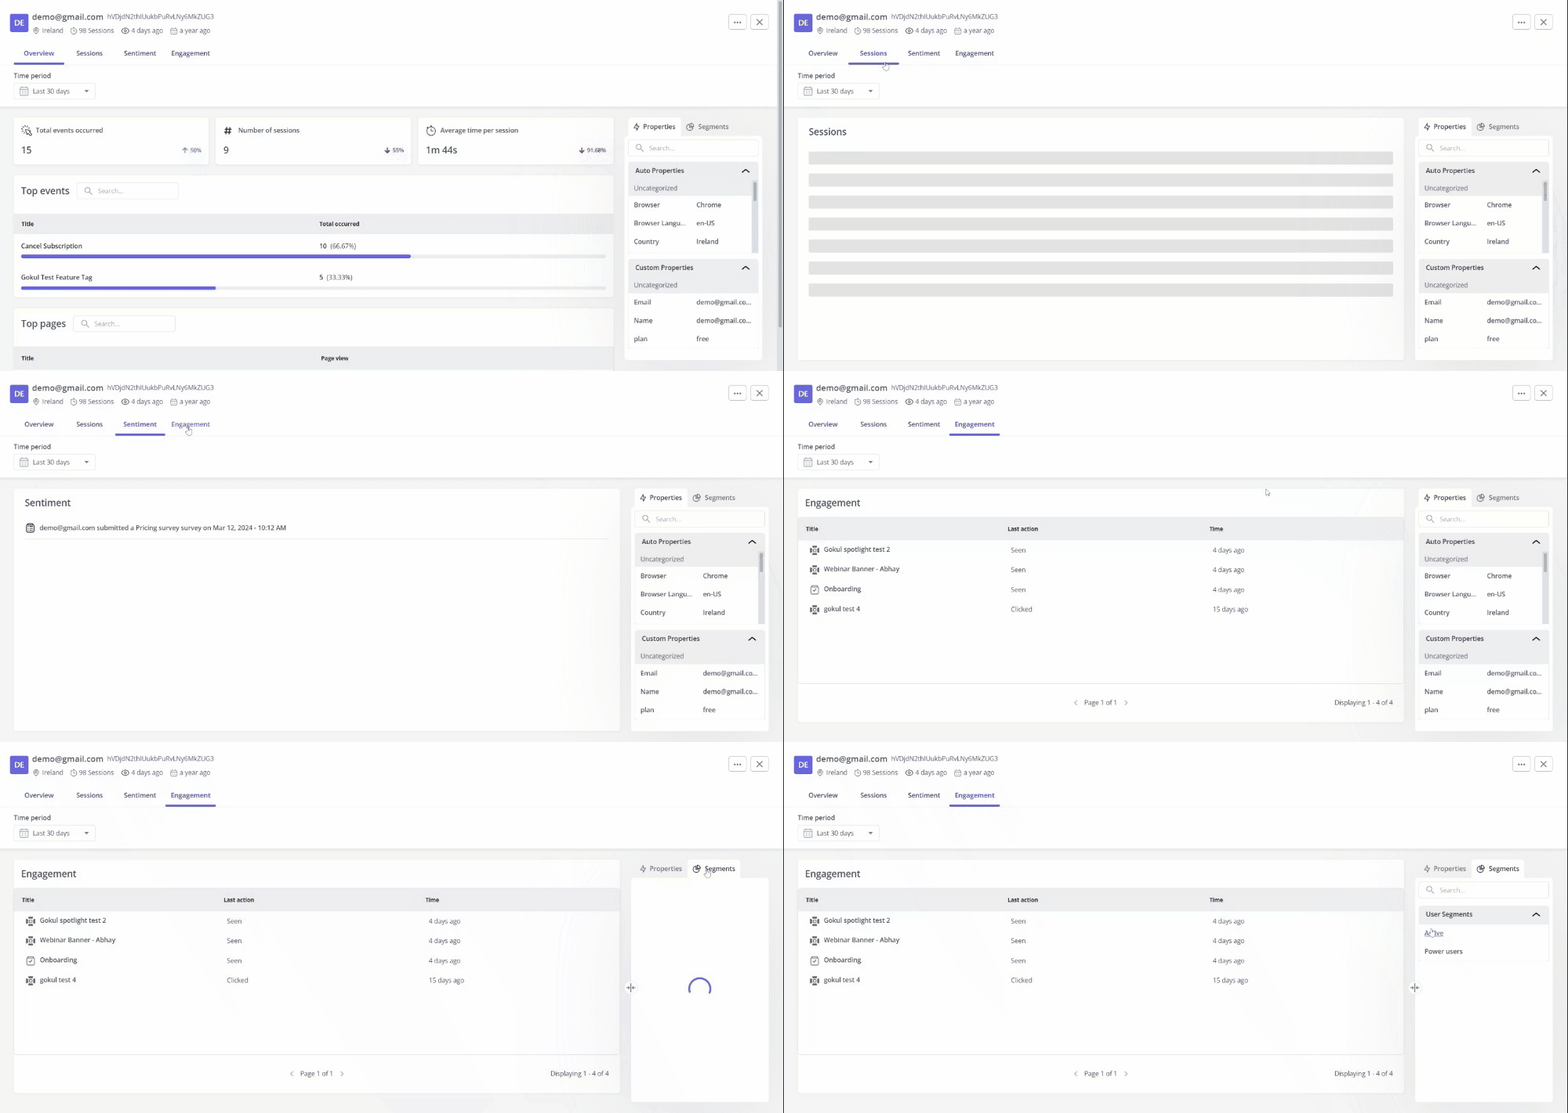
- User/company profiles: Userpilot’s user and company profiles feature allows you to view detailed information about individual profiles and conduct very granular analysis. This includes data such as user attributes, behavior, survey responses, and interaction history.
- Analytics integration capabilities: Userpilot seamlessly integrates with various third-party analytics platforms, such as Google Analytics, Mixpanel, Amplitude, and Segment. This integration allows you to consolidate data from different sources and gain a more complete picture of user behavior across multiple platforms.
Tableau – best business analytics tool for data visualization
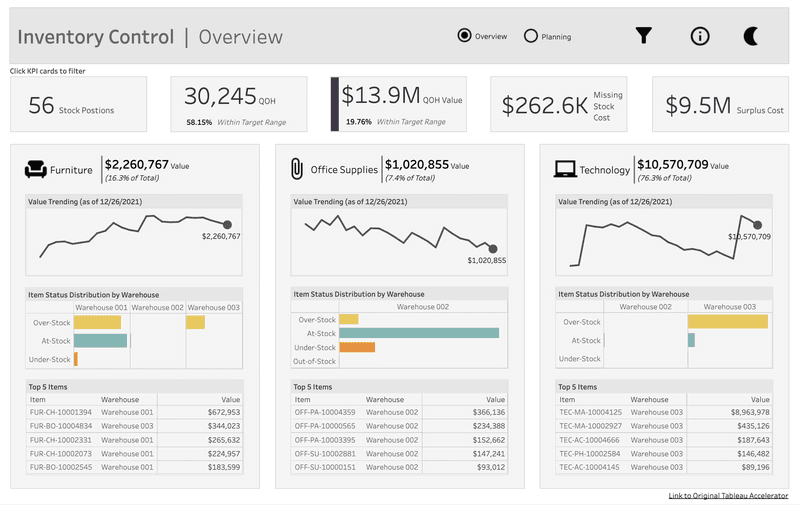
Tableau is a leading business intelligence platform designed to transform raw data into actionable insights through interactive, easy-to-use visualizations.
Relevant business analytics features include:
- Visual analytics: Tableau’s core strength is its powerful visualization capabilities. You can create a wide range of charts, graphs, and maps to explore data and uncover trends. The platform also offers advanced visualization techniques like treemaps and scatter plots to reveal complex relationships within data.
- Natural Language Processing (NLP): The platform incorporates NLP capabilities through its “Ask Data” feature, allowing you to ask questions about your data in plain language and receive relevant visualizations and insights.
- Data blending: Tableau allows you to combine data from multiple sources, whether they are live or in-memory, to create a comprehensive view of your most important data. This is particularly useful for organizations that need to integrate data from various departments or systems, such as CRM software, spreadsheets, and databases.
SAP business analytics – best data analysis tool for large volumes of data
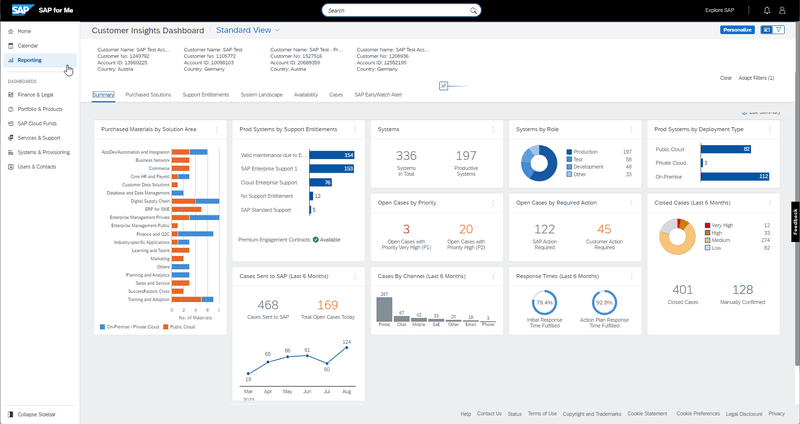
SAP is a comprehensive suite of tools designed to handle advanced data analysis and statistical modeling.
Relevant business analytics features:
- Data Management: SAP provides a robust platform for data integration, cleansing, and preparation. It supports various data sources, including databases, spreadsheets, and cloud-based platforms.
- Machine learning: The platform offers a comprehensive suite of machine learning algorithms for tasks like classification, clustering, and regression. It also provides tools for model building, validation, and deployment.
- Visual analytics: SAP allows you to create interactive reports and dashboards that can be easily shared across the organization. This feature combines the power of advanced analytics with the ease of visual data exploration, making it accessible to users of all skill levels.
Conclusion
From enhancing financial planning to optimizing in-app engagement, there are various impactful use cases for business analytics.
Ready to begin with business analytics? Book a demo with the Userpilot team and our team will walk you through the process of collecting and analyzing customer data to inform product strategies.


