Mixpanel vs Amplitude: Insights for Making Better Decisions


If you’re choosing between Mixpanel and Amplitude, you already know you need event-based product analytics. The harder question is what you need beyond that.
Both track funnels, retention, cohorts, and user flows. But they’ve made different bets from there.
Amplitude expanded into a broader digital growth platform, with predictive cohorts that score users by likelihood to activate, retain, or churn, plus native A/B testing and feature flagging. Getting full value usually requires a dedicated analyst to manage schemas and taxonomies, and the pricing matches that enterprise’s positioning.
Mixpanel bets on speed. Easy setup, intuitive dashboards, no SQL required. But it doesn’t have native experimentation nor predictive analytics.
In this article, I break down both tools across features, pricing, and integrations to help you figure out which fits your team. And if neither is quite right, I’ve got you covered with some solid alternatives.

Mixpanel vs Amplitude: Who should use which?
To make this simple, I looked at how teams use the two tools based on G2 reviews, product docs, data models, and their most mentioned use cases. So here’s how to choose:
Choose Mixpanel if:
- You want fast, self-serve analytics without relying on a data team.
- You’re a startup or growth-stage SaaS team that needs quick answers without complex setup.
- You care about building funnels and segmenting active users, but provided there’s quick iteration.
- You prefer a tool that’s easy to learn and highly interactive.
- You need account-level (B2B) analytics or feature flags tied directly to usage.
Put simply, Mixpanel is a good fit for speed. No getting stuck in infrastructure.
Choose Amplitude if:
- You need a comprehensive platform beyond analytics.
- You’re a mid-market or enterprise team with more complex data needs.
- You want to combine analytics, experimentation, and in-app engagement in one tool.
- You rely on advanced cohorting, predictive insights, or CDP capabilities.
- You have the resources to handle a steeper learning curve and setup.
In short, Amplitude is for depth. It’s a better fit when your team needs advanced analysis and is willing to trade speed for power and scale.
In case you’re more into feature management/comparison, below is a quick head-to-head:
| Feature | Mixpanel | Amplitude |
|---|---|---|
| Ease of setup | Quick and simple to set up. Ideal for teams that want fast access to insights without heavy configuration. | Requires detailed setup with event schemas and governance rules before teams can start tracking data effectively. |
| Behavioral analytics depth | Strong event tracking and funnels, though better suited for surface-to-mid-level analysis. | Built for depth. Supports advanced journey mapping, retention, and correlation analysis. |
| Segmentation & cohorts | Robust segmentation and dynamic cohorts for quick insights on user behavior. | Advanced segmentation with flexible filters, real-time updates, and cross-platform data. |
| Predictive & machine learning insights | ❌ Limited predictive modeling. Mostly focused on descriptive analytics. | ✅ Includes predictive tools like Personas and Compass to identify behaviors linked to retention or conversion. |
| Experimentation tools | Requires integration with third-party tools for A/B testing. | Native experimentation and feature flagging suite for data-driven testing. |
| Data governance & quality | Minimal governance. Relies on accurate event setup but offers less control afterward. | Strong governance framework with schema enforcement, naming consistency, and permission control. |
| In-app engagement tools | 🚫 Does not include native in-app guidance or surveys for SaaS. Requires third-party tools for onboarding or feedback. | ✅ Includes Guides and Surveys (tooltips, banners, checklists, and NPS), but only available on paid plans. |
| Dashboard & visualization | Simple drag-and-drop dashboard builder, great for storytelling and sharing reports. | More structured but less customizable. Requires adapting reports to platform templates. |
What are Mixpanel’s key features?
- Self-service analytics: Mixpanel is built for accessibility. Its intuitive drag-and-drop interface makes it easy for anyone on your team to explore data points, understand user behavior, generate reports, and gain deeper insights into patterns across the customer journey. And as such, it saves PMs a lot of time and effort.
- Powerful segmentation and cohort analysis: Mixpanel’s user segmentation engine lets you drill down to granular levels by grouping behavior by user properties such as geography, plan type, device, or any custom event attribute. You’ll “see what users are doing step by step…and the dashboard updates on its own.” Advanced teams can also leverage lookup tables to merge external data for more refined segmentation and cohort analysis.
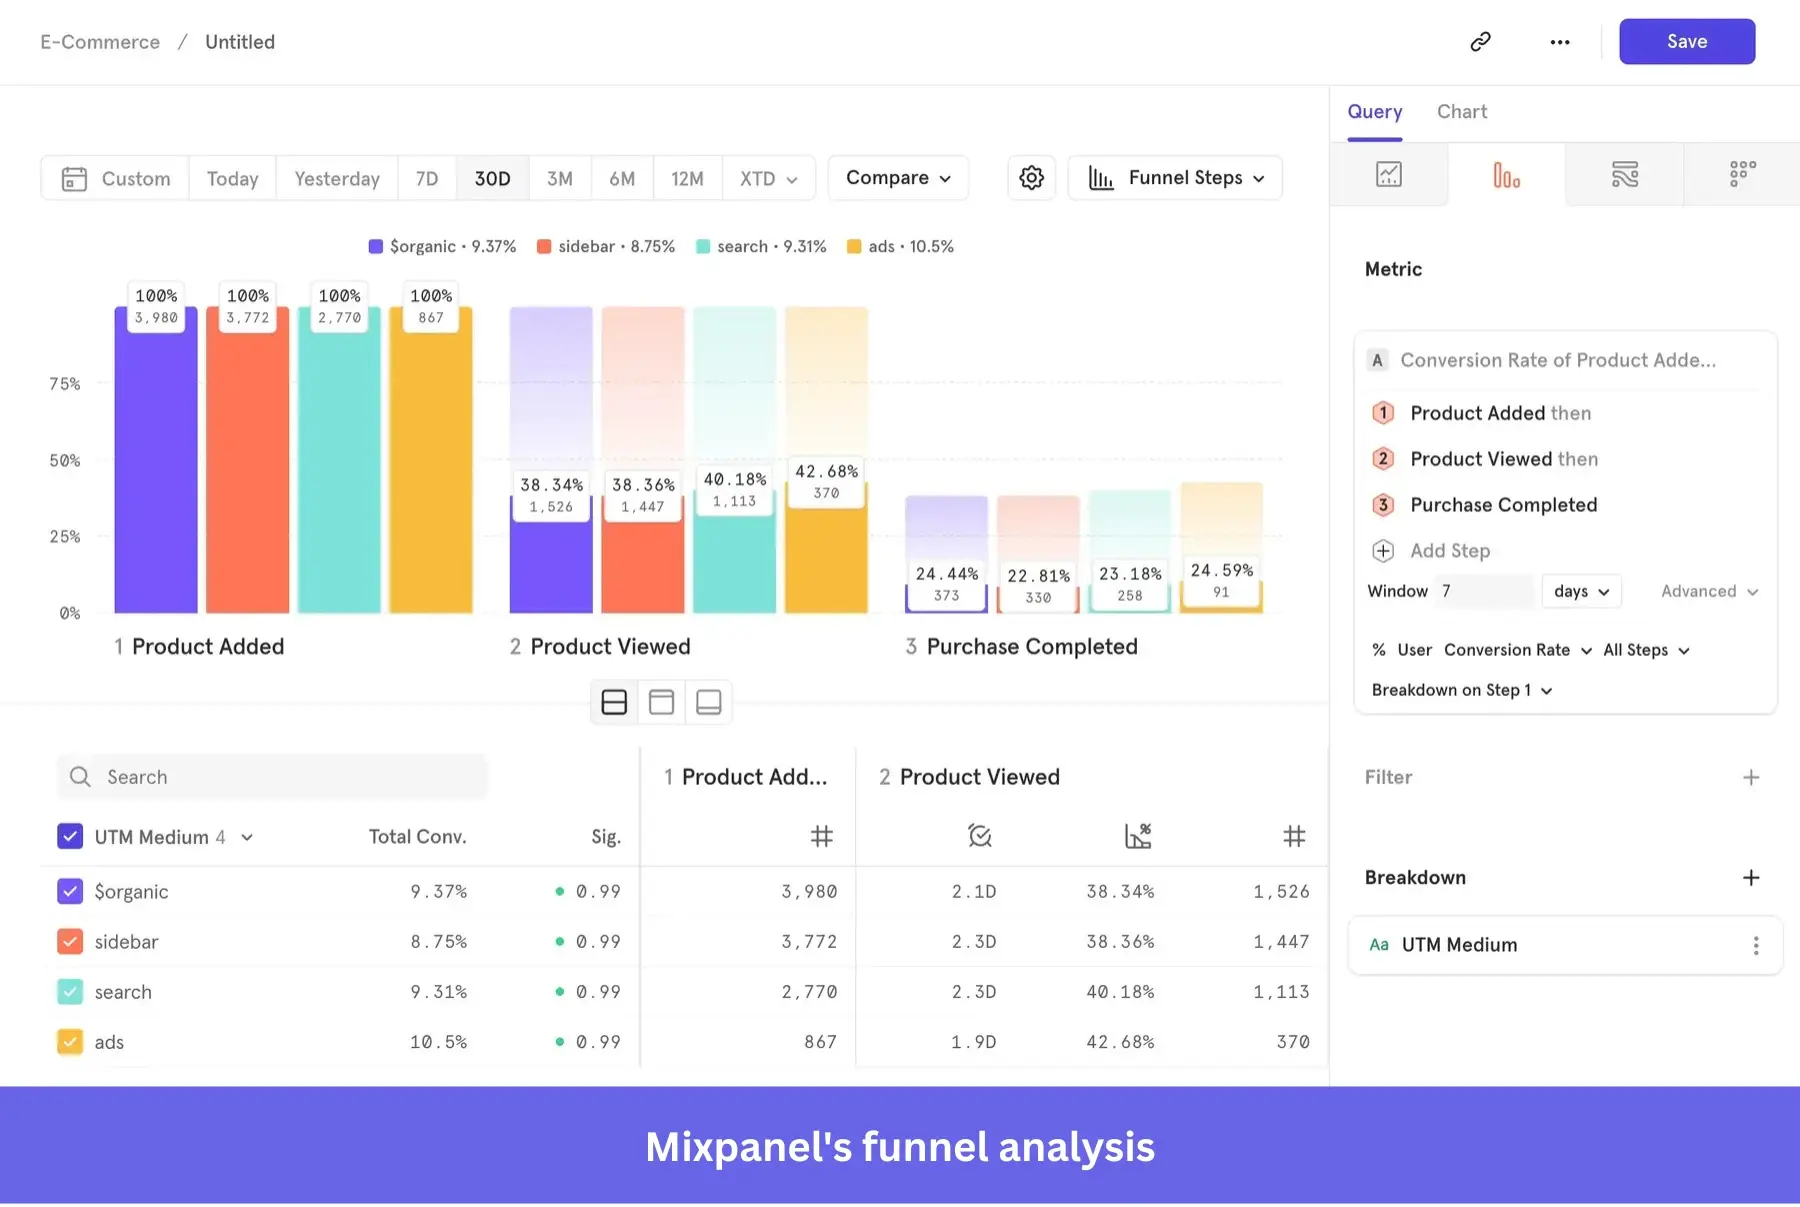
- Funnel and retention insights: In my experience, one of Mixpanel’s core strengths is its funnel and user retention tools. These features allow you to visualize the user journey from signup to conversion, pinpoint friction points, and analyze historical data to identify behavioral trends over time. Users like how it “measures the effectiveness of lifecycle marketing journeys from owned channels, paid, and direct.“
- Flexible data Integrations and SDKs: Mixpanel’s SDKs are lightweight and easy to implement across major platforms, including JavaScript, iOS, Android, and React Native. It also integrates with data warehouses, such as Snowflake, as well as marketing tools like HubSpot and Braze. This flexibility ensures that Mixpanel fits smoothly into an existing tech stack, improving product-marketing efforts in the process.
Are there any notable cons of Mixpanel?
Despite its analytical power, Mixpanel has several downsides that can slow down your product development cycle and limit your ability to act swiftly on insights.
- High setup overhead for advanced tracking: While Mixpanel is easy to start with, scaling beyond basic dashboards often requires deep event instrumentation and ongoing developer involvement. Because the platform assumes technical expertise for this level of setup, the available help resources often fall short, leaving non-technical users/teams to rely on trial and error or peer support.
“I struggle with certain aspects of Mixpanel, even after two and a half years of usage, due to insufficient onboarding. The ability to create different user groups, like those involving cohort builders for users who signed up 30 or 60 days ago, presents a challenge. The onboarding experience was not comprehensive enough to cover these more complex functionalities. For parts where I received a proper onboarding by my peers, I manage fine, but without proper instruction, usability can be tricky.” Fiete V. on G2
- Unpredictable and expensive event-based pricing: Mixpanel’s pricing model is tied directly to the number of events tracked. For SaaS companies with growing user bases, costs can rise quickly and unpredictably, making it difficult to forecast analytics budgets or justify tracking additional events.
“It is a costly tool. A lot of events needs to be passed which leads to very high cost quota.” – Verified review on G2
- Lack of native qualitative or user engagement tools: Mixpanel focuses heavily on quantitative data but offers limited options for capturing qualitative insights. Without built-in tools for in-app surveys, onboarding flows, or contextual feedback, teams often need to rely on other tools to complete the picture. This creates a fragmented workflow and makes it harder to connect insights to direct in-product action.
What are Amplitude’s key features?
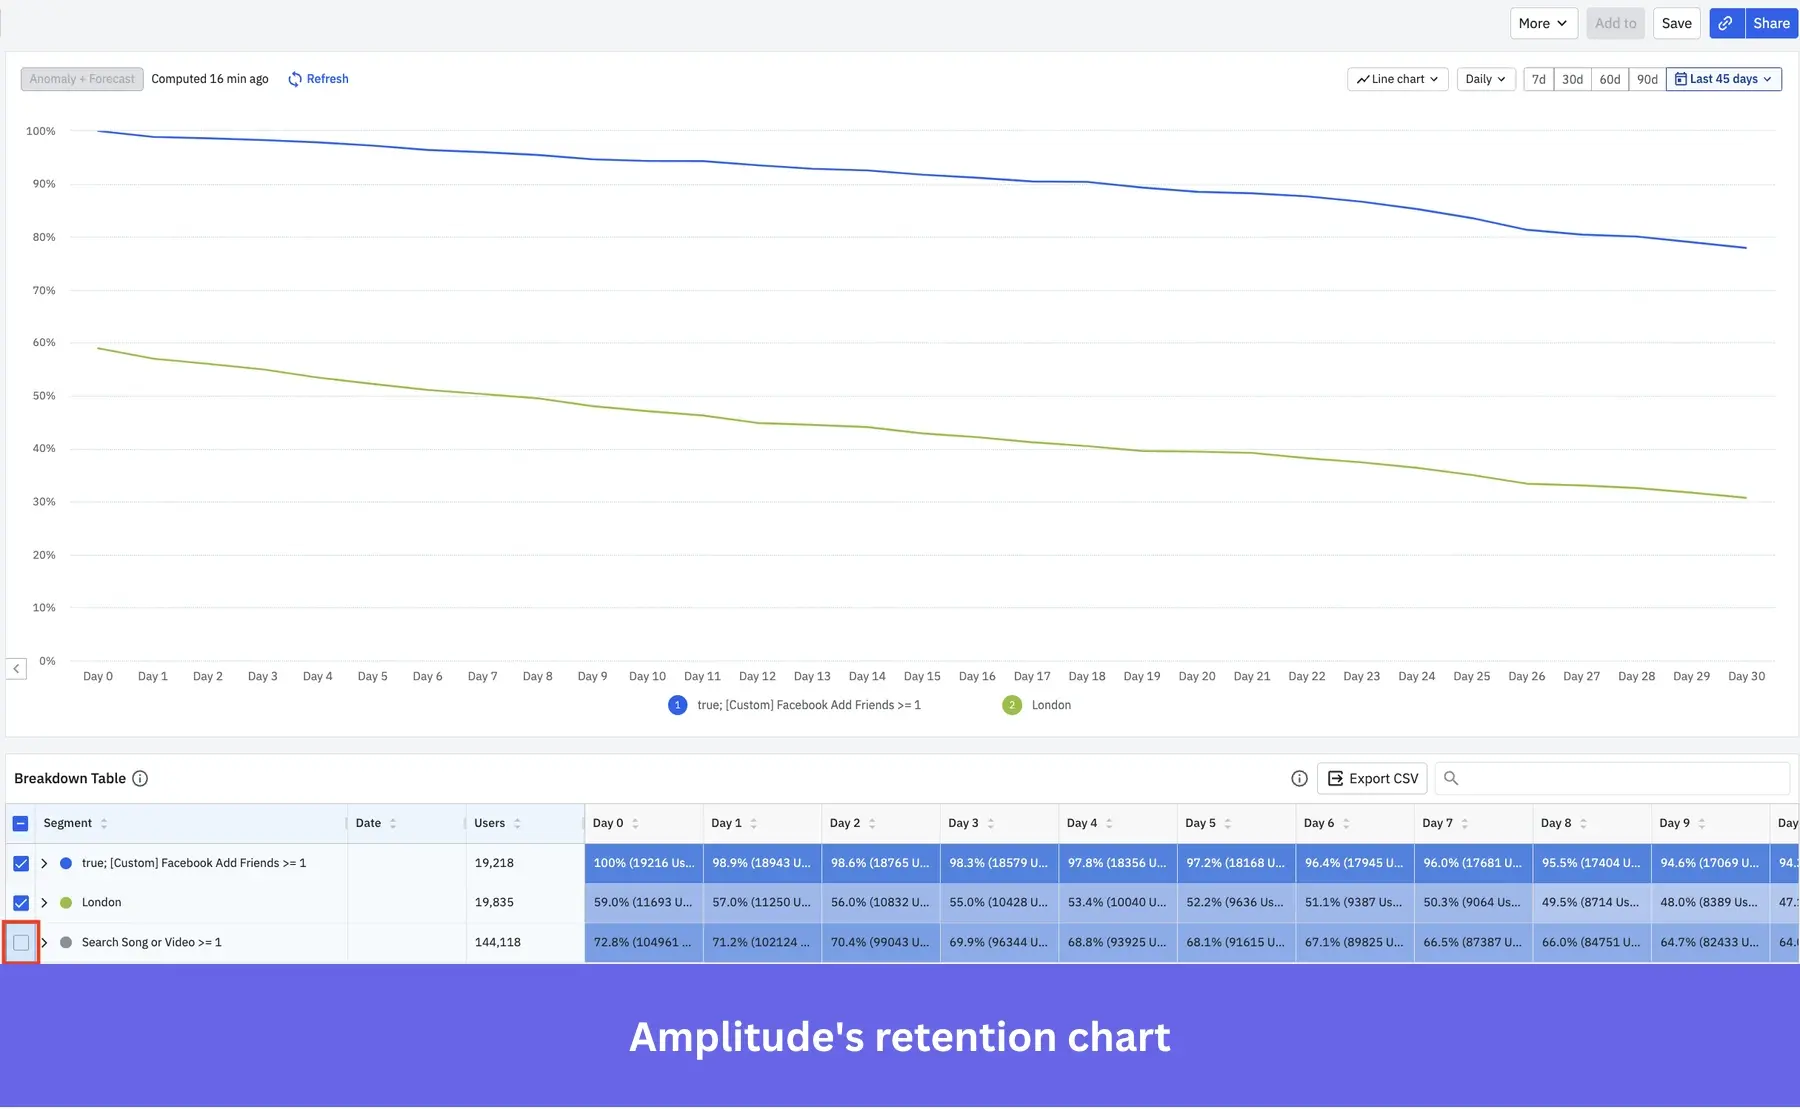
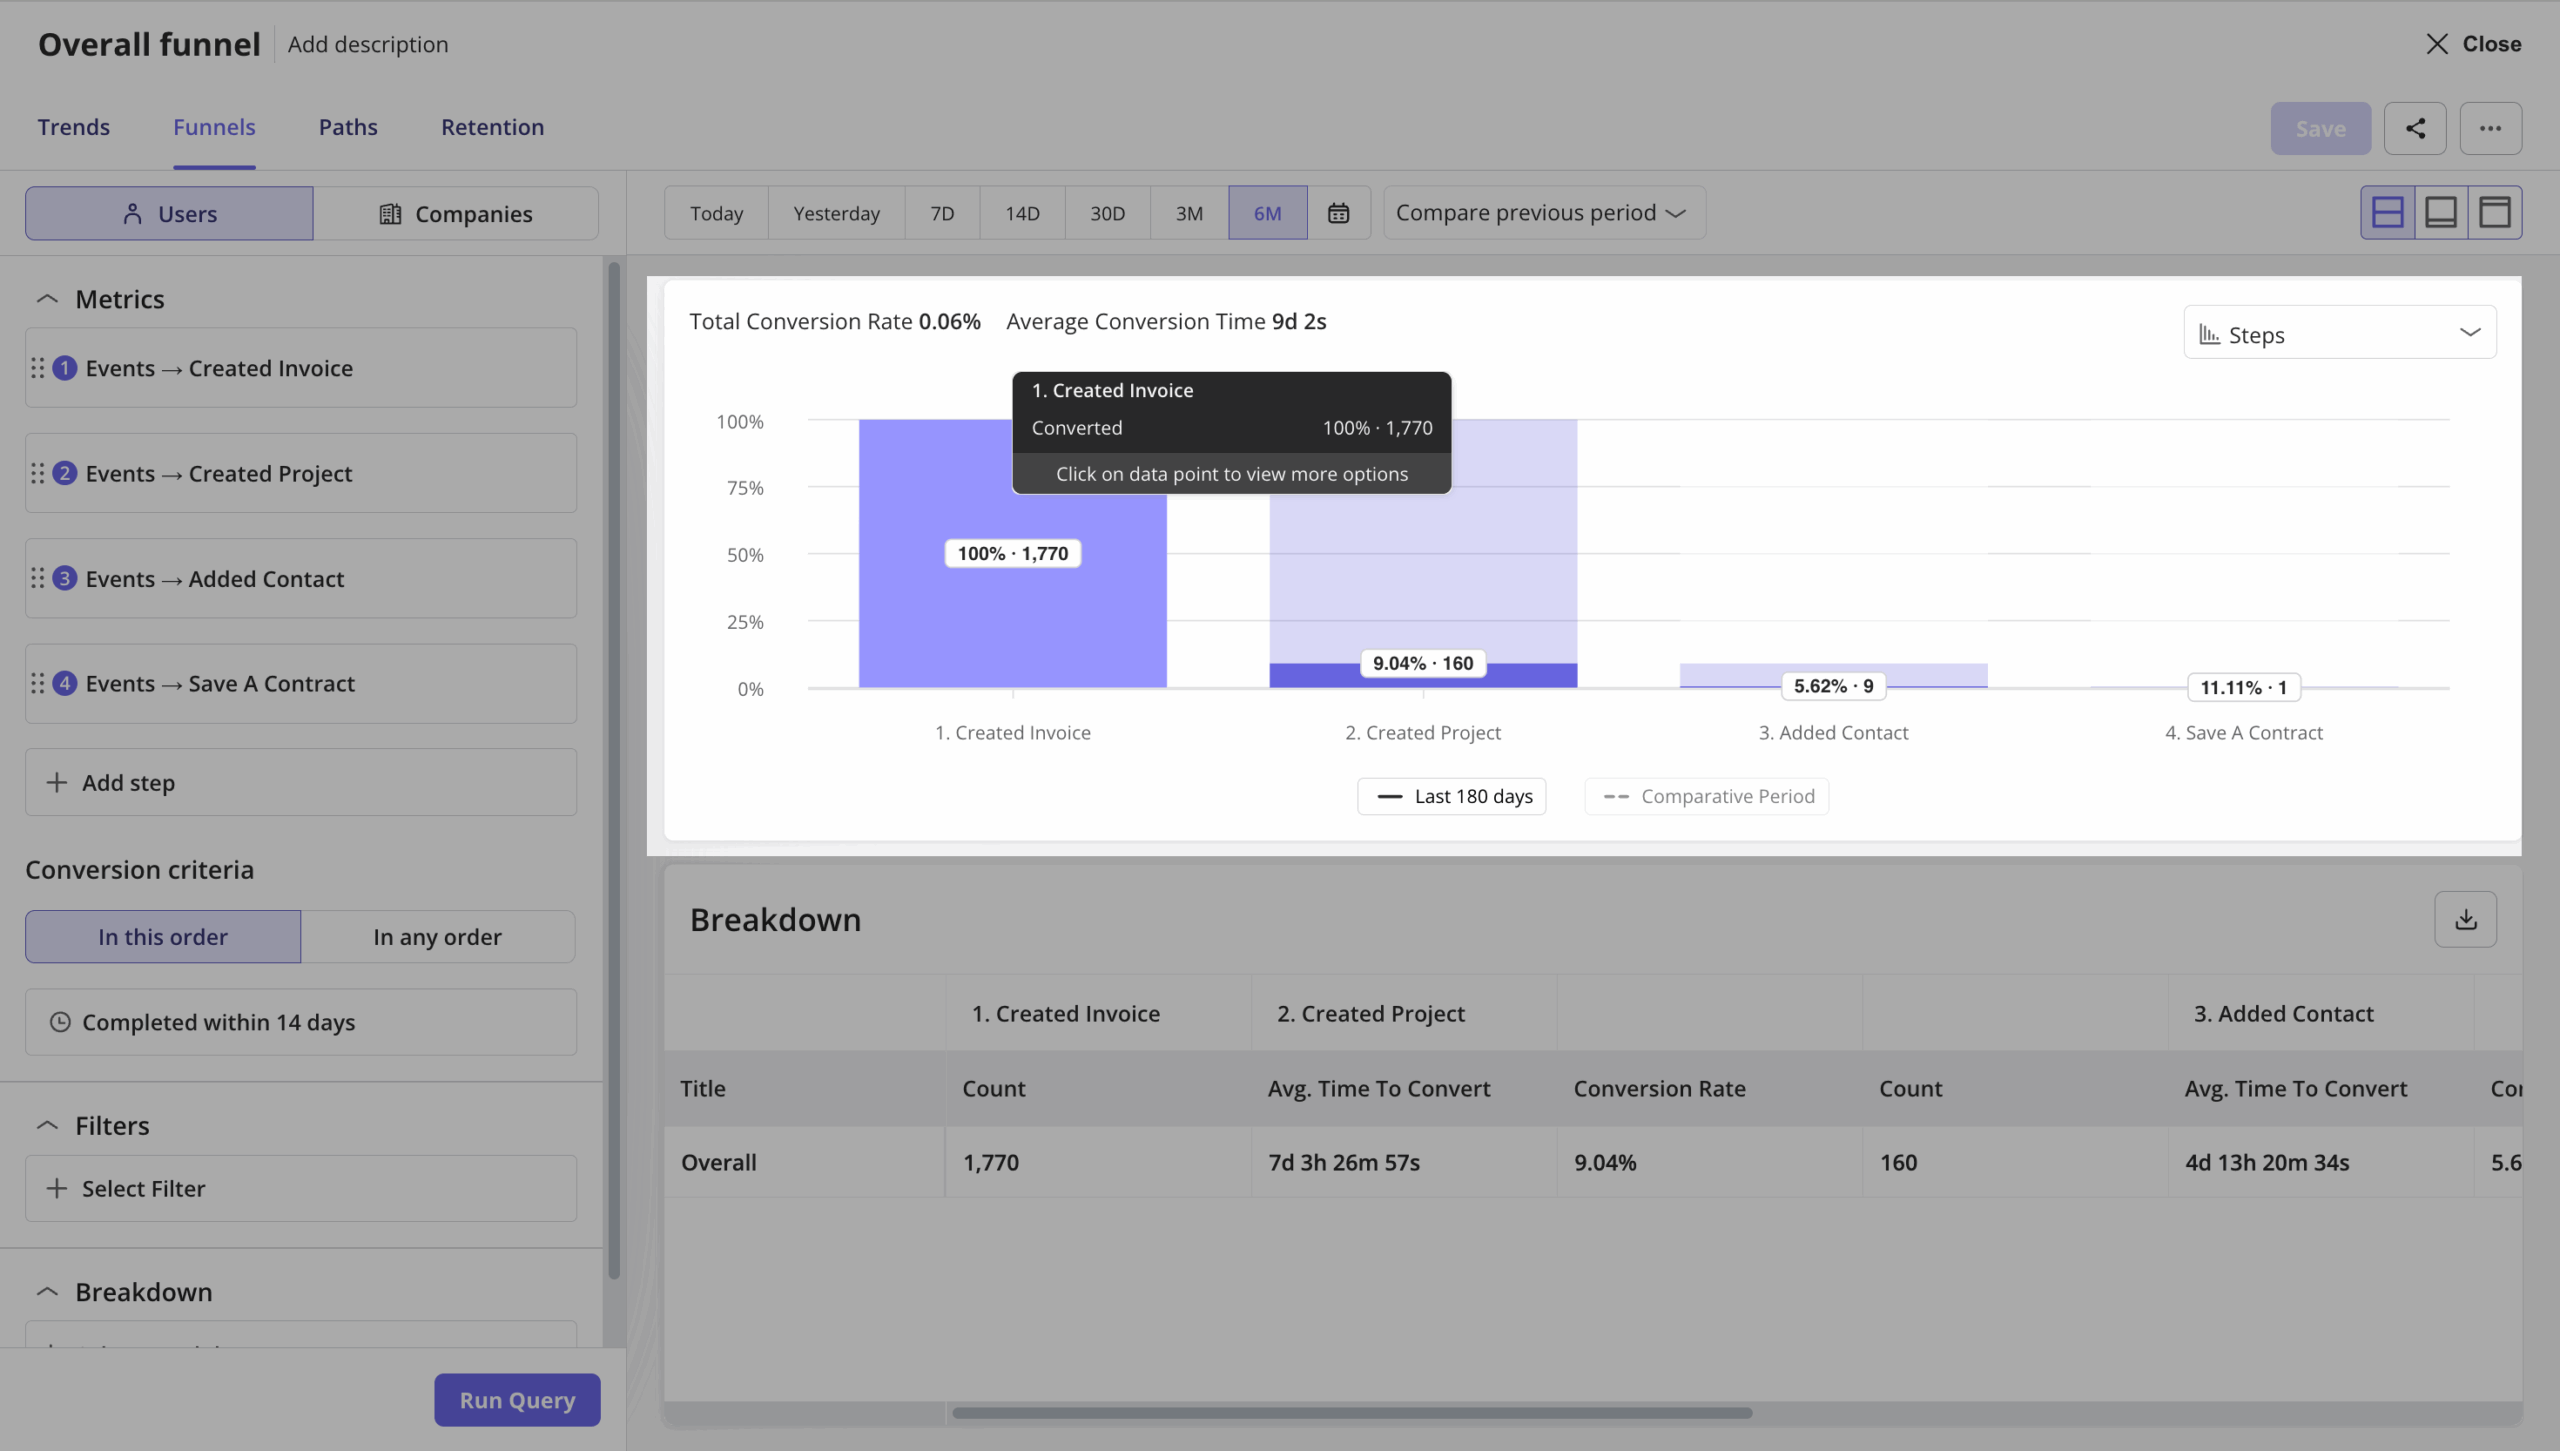
- Comprehensive behavioral analytics: I find Amplitude most valuable for its advanced features that support in-depth behavioral analysis. The platform enables you to explore exactly how users interact with features, track conversion paths across journeys, and identify where engagement begins to decline on both web and mobile apps. You can also decide which mobiles and OS versions are used most by users.
- Governance and data taxonomy controls: Amplitude’s major differentiating feature is its governance framework. It enforces consistent event naming, data validation, and permissions to maintain clean, trustworthy reports and strong data accuracy across teams. For teams that manage multiple products or data sources, this consistency saves time, makes it easy to understand charts and dashboards, and prevents the usual data chaos that comes with scale.
- Predictive analytics and machine learning models: Amplitude uses built-in AI features to uncover correlations between user actions and key outcomes such as activation, churn, or revenue. These insights will help you anticipate user behavior and prioritize high-impact features.
- Data visualization: Amplitude provides flexible dashboards, shareable reports, and presentation-ready visualizations. I particularly love how it promotes collaboration by letting teams add annotations, schedule automated updates, and work together within the same workspace.
Are there any notable cons of Amplitude?
Despite its analytical power, Amplitude comes with challenges that can slow teams down in several ways:
- Steep learning curve and reliance on technical expertise: Unlike Mixpanel, where the challenge often lies in scaling event tracking, Amplitude’s complexity stems from its data governance framework. Extracting its full value from the get-go usually requires a dedicated analyst or someone with strong technical skills to manage schemas, plan taxonomies, and validate events. For PMs who prefer to explore data independently, this structure can feel restrictive. Even small product changes may demand reconfiguration to keep reports accurate.
“It can be a real beast to learn. It’s not a tool you just pick up in an afternoon. You have to genuinely invest time to get the hang of it, which is tough when you just need a quick answer to a question.” – Mohit on G2
- Limited customization flexibility: Amplitude offers less freedom when it comes to customizing dashboards and visualizations. You often have to adapt your reporting style to fit the platform rather than shaping it around your team’s specific workflow.
“I would like to be able to define from the UI the information received in the payloads of each integration to align more custom between tools. Perhaps it would have been easier if Amplitude showed each field of the payload and allowed customization of how I expect it to interpret them.” – Nacho on G2
- Complex interface: Amplitude’s interface isn’t the most intuitive. I’ve often found that navigating dashboards or building custom, advanced reports takes longer than expected, and I’m not alone in this:
“The sidebar navigation isn’t very intuitive, the hamburger menu hides key features, and it can be difficult to quickly access live or recent data.” – Vishal on G2
Amplitude vs Mixpanel: Which tool is more budget-friendly?
In short, I’d say Mixpanel is generally a more budget-friendly product analytics platform than Amplitude, especially if you’re not planning to go all-in on a full platform.
Since their official pricing pages only show monthly tiers, I have gone to Vendr for a more specific reference of their contract value.
From what I’ve seen, Mixpanel’s median contract value sits around $38K/year, while Amplitude is significantly higher, with a median closer to $64K/year.
So to me, Mixpanel feels easier to justify cost-wise for pure analytics, whereas Amplitude becomes a bigger investment that requires more time to tell.
Below is a more detailed breakdown of the two, plan-by-plan:
| Plan | Mixpanel | Amplitude |
|---|---|---|
| Free plan | Free forever: Includes up to 1M monthly events, 5 saved reports per seat, and 10K session replays. | Free Starter plan: includes 10K MTUs and up to 10M events, with access to core analytics, session replay, AI feedback, and web experimentation. |
| Mid-tier plan | Growth plan: Starts at $0.28 per 1K events after the first 1M. Offers unlimited reports, free 20M monthly events, and 24/5 online support. Includes behavioral cohorts and data governance features. | Plus plan: Starts at $49/month (billed annually). Includes up to 300K MTUs, unlimited product analytics, behavioral cohorts, feature tagging, and segmentation tools. |
| Enterprise plan | Enterprise plan: Custom pricing. Supports up to 1T events, advanced analytics, data governance, HIPAA compliance, SAML SSO, and dedicated account management. | Growth & Enterprise plans: Custom pricing. Include custom MTU volume, advanced behavioral analysis, cross-product analytics, permission controls, and real-time streaming & syncs. |
| Pricing model | Based on event volume: Charges per 1,000 tracked events, which scale with usage. | MTU-based: Pricing depends on monthly tracked users and event data volume. |
Mixpanel vs Amplitude: Which tool has better integrations?
Based on my judgment, Amplitude has the edge for enterprise-grade integrations and bi-directional data workflows, while Mixpanel is stronger for flexible integrations and faster setup.
Here’s how to decide:
- Choose Mixpanel if you want fast, flexible integrations without heavy setup: Mixpanel connects easily with a wide range of tools (CRM, messaging, data warehouses) and supports event import/export and cohort syncing.
- Choose Amplitude if you need more structured data integration: Amplitude includes a built-in CDP layer, stronger governance, and more advanced syncing across tools (e.g., pushing cohorts to ad platforms, integrating with data warehouses).
- On two-way sync and data flow: Amplitude is generally stronger for bi-directional sync and centralized data control, while Mixpanel focuses more on getting data in and insights out quickly.
Below is a head-to-head comparison:
| Integration Category | Mixpanel | Amplitude |
|---|---|---|
| Customer data platforms | 27 CDPs, including RevenueCat, Databox, and leaders like Segment. | 4 CDPs, including Segment and mParticle, plus no-code ingestion to unify user profiles and events. |
| CRMs & marketing automation | Integrates with top players like HubSpot, Braze, and Zoho. Also supports marketing tool integrations for campaign tracking and user segment feeds. | Integrates with HubSpot, Klaviyo, Google Analytics, Mailchimp, Salesforce, Braze, and Iterable for advanced lifecycle analytics and cohort syncing. |
| Data pipelines | Supports export to BEEM, Rivery, and similar platforms. | Offers “Data Connections” to bring in from warehouses and export enriched data out to cloud storage or MarTech. |
| Dashboarding and business intelligence | Commonly integrates with BI tools like Optiback or Databox for advanced visualization and dashboards. | Can integrate with BI tools, but emphasizes keeping analysis inside the platform via built-in dashboards and annotations. |
Is there any alternative to Mixpanel and Amplitude?
Evaluating product analytics tools is a core part of my job, so I can confidently say yes. There are several (good) alternatives. However, the right one depends on what you actually need to do next after getting insights.
If your focus is advanced analytics or infrastructure…
- Use PostHog if you want an open-source, developer-friendly stack.
- Choose Heap if you prefer auto-capture across web and mobile without manual event setup.
If you’re looking for a tool to understand user behavior and do something with it (i.e., triggering an in-app experience), consider Userpilot.
It sits a bit differently from tools like Mixpanel or Amplitude. It still covers core analytics needs such as autocapture, session replay, funnels, paths, and dashboards, but puts more emphasis on making those insights accessible without heavy technical work.
Another core difference is that you can use collected data to power your in-app product experiences. Think of delivering in-app guidance to someone who struggles with your new features.
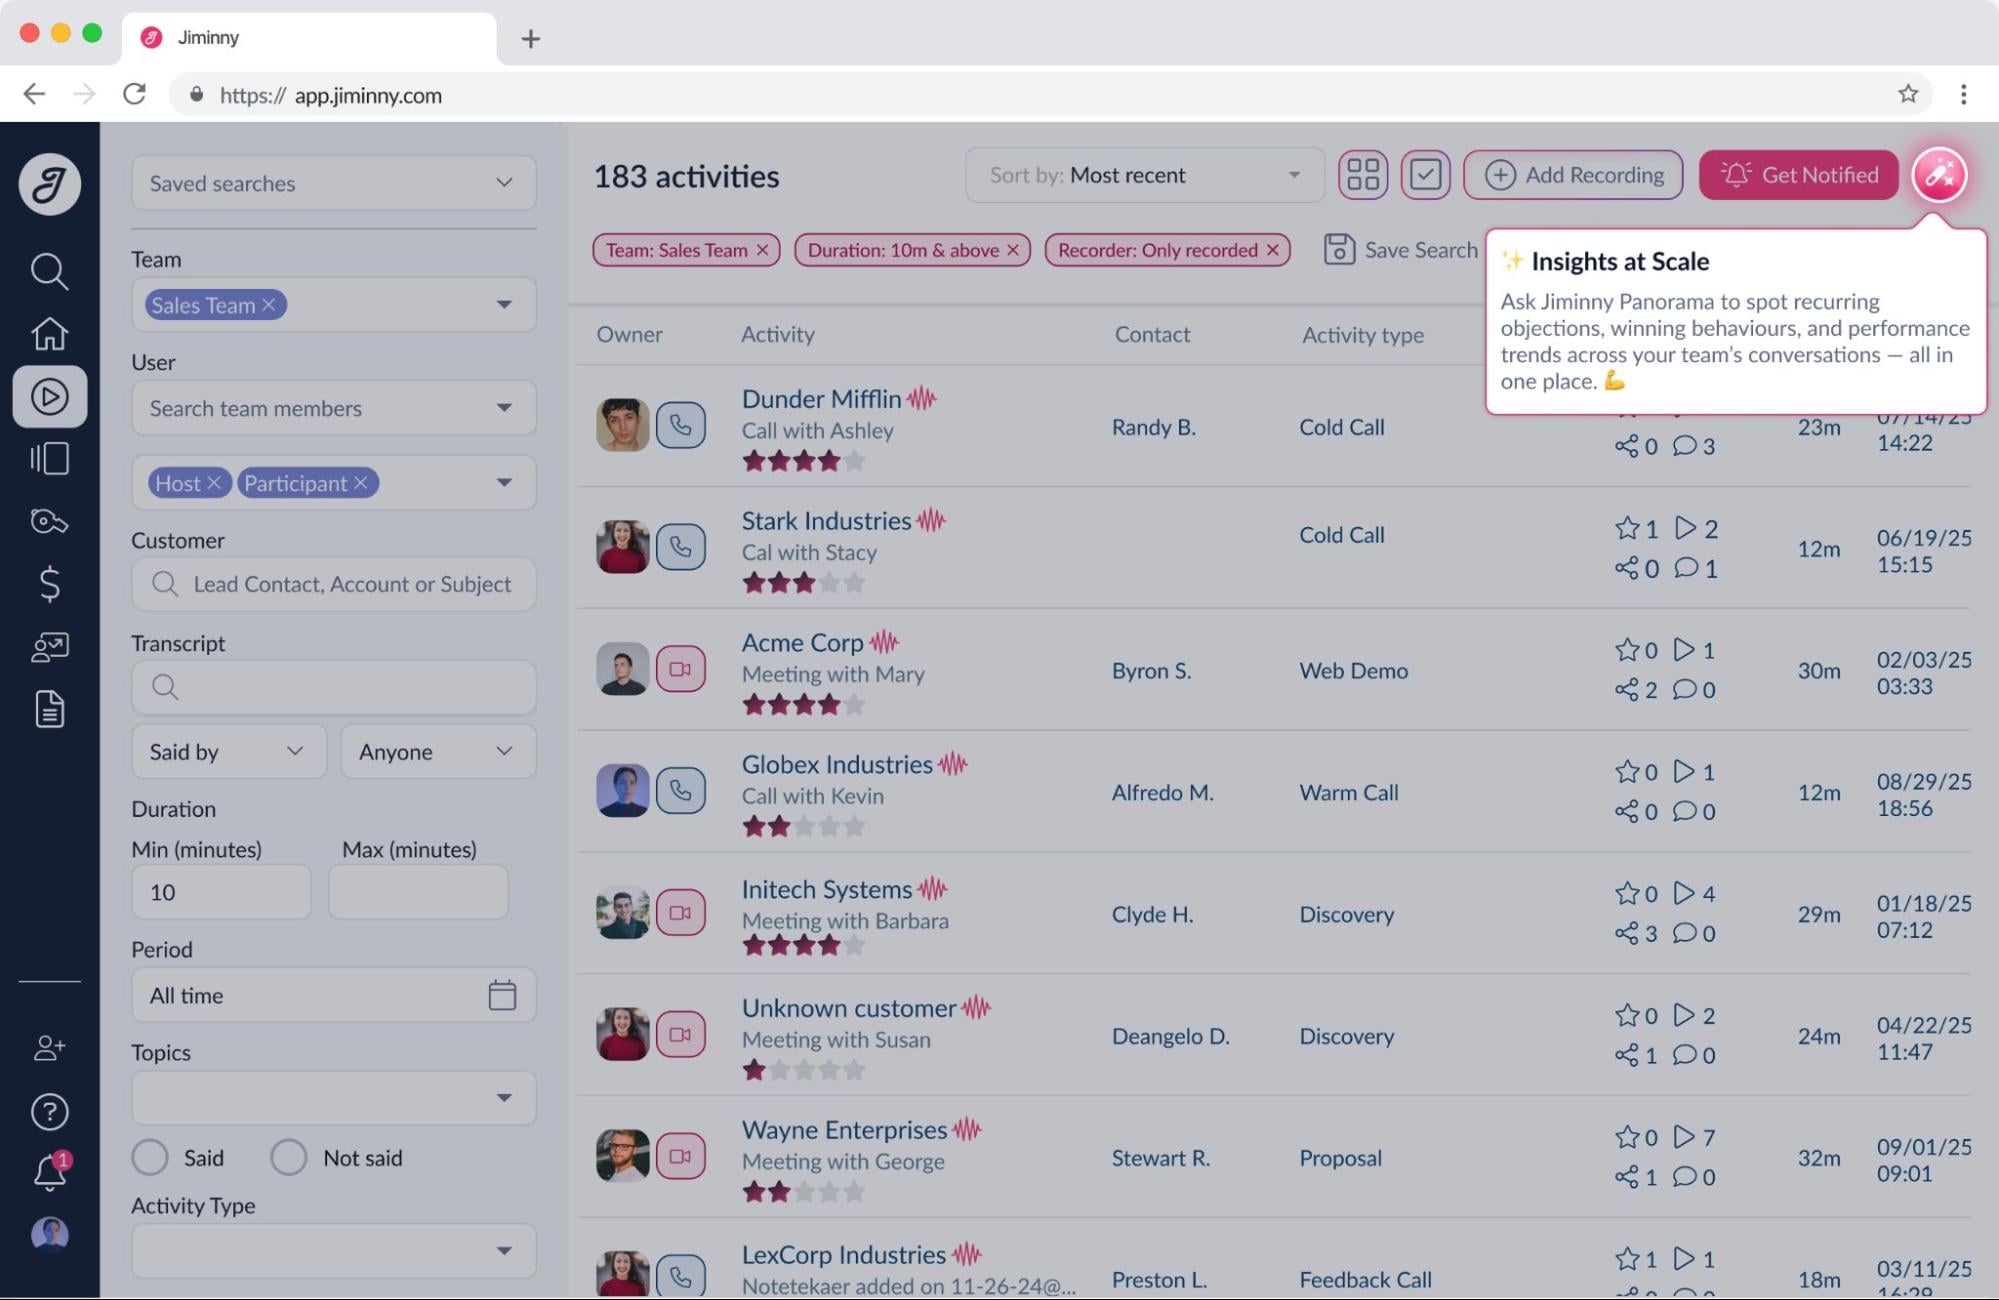
Take one of our customers, Jiminny, for example. When a new feature wasn’t getting traction, they didn’t just flag it in a dashboard. They followed up with targeted in-app tooltips and modals to guide users toward that feature and drive adoption.
And we’re pushing this even further with Lia, our upcoming AI product growth agent. We build Lia to help you surface what matters and suggest the next best actions to take, so you can move from insight to impact faster.
👉 We’re opening up early access soon, join the beta to see Lia in action.

The best product analytics tool depends on your needs
Mixpanel and Amplitude are both solid tools. But “best” really comes down to what your team does after the insight.
If you’re running a data-mature team that lives inside dashboards and runs experiments regularly, Amplitude is worth the investment. If you need fast, accessible analytics without the overhead, Mixpanel gets you there quicker.
Where both fall short is the gap between insight and action. Knowing which feature has low adoption doesn’t help much if you still need three other tools to do something about it.
That’s the problem Userpilot is built to close. Analytics, in-app engagement, and feedback in one place, without the enterprise price tag.
Book a demo to see it in action!
About the author