12 Customer Engagement Metrics to Monitor


What are customer engagement metrics?
Customer engagement metrics are measures of how customers interact with your SaaS product. They show how involved, satisfied, and loyal your customers are.
Monitoring these metrics helps businesses identify improvement areas, refine engagement strategies, build stronger customer relationships, and enhance retention. And ultimately, drive product growth.
Why should you track customer engagement metrics?
It won’t be an overstatement to say that monitoring customer engagement metrics is vital for product success. Here are 3 reasons why.
Measure customer engagement over time
Tracking customer engagement metrics allows you to analyze how customer interactions evolve over time.
By regularly monitoring these metrics, you can identify trends and patterns in customer behavior, assess the effectiveness of your engagement strategies, and make data-driven decisions to improve customer loyalty and satisfaction.
For example, if you see that customers stop engaging with a particular feature, it may be an indication that there’s no longer a demand for it or that you need to redesign your onboarding to accommodate changing user preferences.
Detect problems early on
Regularly monitoring customer engagement metrics enables you to detect potential issues. And tackle them proactively before they escalate.
For example, a poor CES score can indicate usability issues, which can ultimately lead to churn. By spotting it early, you can look into the potential causes to eliminate the issues and improve the customer experience.
Benchmark against industry standards
Tracking customer engagement metrics allows you to benchmark your performance against industry standards.
By comparing your metrics to those of competitors or industry benchmarks, like Userpilot’s SaaS Product Metrics Benchmark Report, you can gain valuable insights into your relative performance and identify areas where you may need to improve.
This helps you set realistic goals, adopt best practices, and ensure your customer engagement strategies remain effective and aligned with industry trends.

![]()
Ready to Track Your Customer Engagement Metrics?

12 key customer engagement metrics to monitor
With the theory covered, let’s get down to the meat of the guide: the 12 customer engagement metrics to track, why you should monitor them, and how to calculate them!
1. Time to value
Time to Value (TTV) is the time it takes a customer to reach the activation point, or in other words, realize the product value.
The metric helps you understand how quickly customers derive benefits, which can influence their satisfaction and retention. A shorter TTV indicates a more intuitive and effective onboarding process.
To calculate TTV, track the time from the customer’s first interaction to when they achieve their first activation milestone.
What’s a good time to value?
Our study of 547 companies found that the average TTV was 1 day, 12 hours, and 23 minutes. The durations varied greatly across the industries, though, so it’s worth checking how companies in your niche are doing.
2. Activation rate
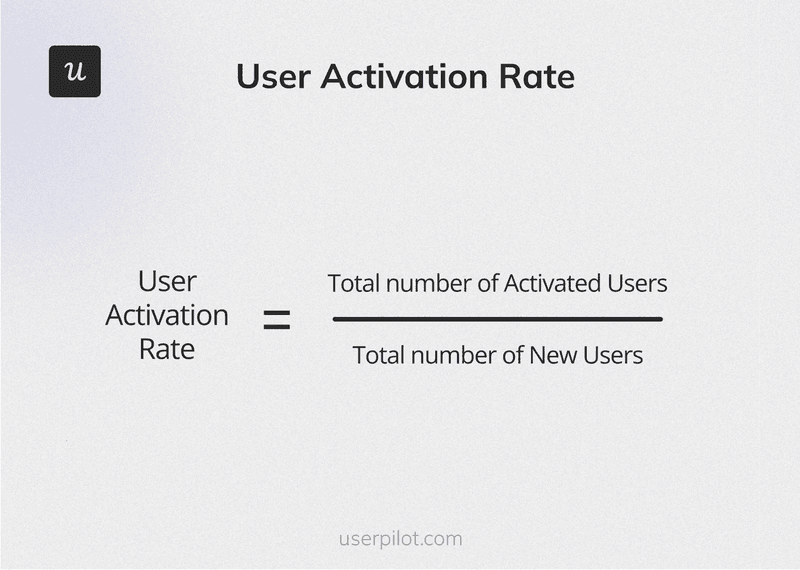
Activation rate is the percentage of new users who reach the activation point within a set timeframe.
This metric is essential for assessing the effectiveness of your onboarding process. More importantly, it can help you forecast product long-term performance. Fairmarkit has found that a 25% activation increase leads to a 34% MRR growth.
To calculate the activation rate, first define your activation point. This varies from product to product and isn’t always easy to pinpoint. If not sure what it is, use analytics to find events that correlate with customer retention, account expansion, and advocacy.
Next, divide the number of users who reached the activation point by the total number of new users, then multiply by 100. For instance, if 200 out of 500 new users activate, the activation rate is 40%.
The average activation rate across all verticals in our benchmark report was 37.5%.
3. Product/feature adoption rate
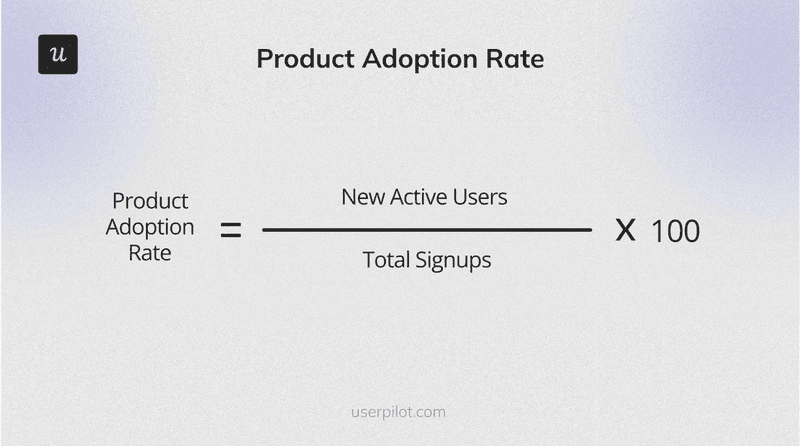
Product or feature adoption rate tracks how many users use a specific product/feature regularly – as a go-to solution to their problems.
The metric sheds light on how valuable your product or feature is to customers. And shows how effective your onboarding and engagement strategies are at driving repeated use.
Product adoption is calculated by dividing the number of active product users by the number of sign-ups, while feature adoption is figured out by dividing the number of active feature users by the total number of users and then multiplying it by 100.
For example, if 300 out of 1,000 users regularly use a new feature, the adoption rate is 30%.
In our benchmark report, we looked at the core feature activation rate, which averaged 24.5% across all sectors.
4. Product stickiness rate
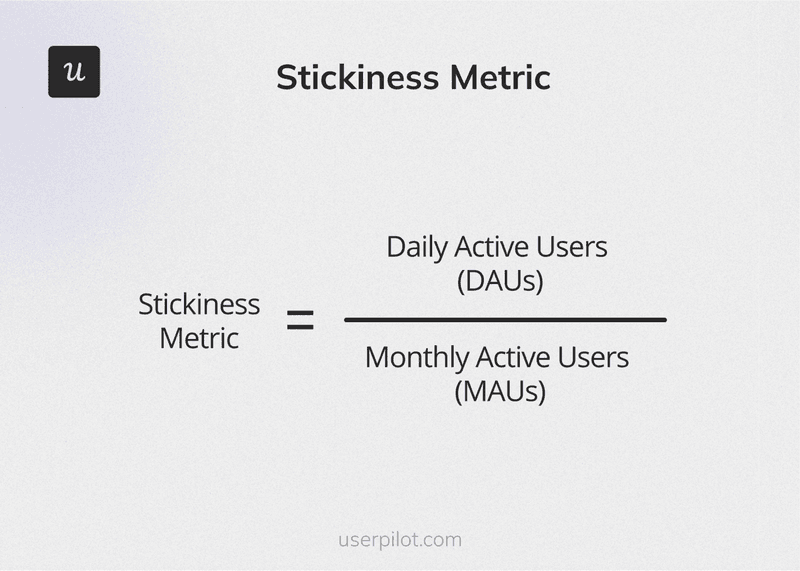
Product stickiness rate measures how often users return to your product over a given period. It’s an indication of its value and customer engagement level.
To calculate it, divide the Daily Active Users (DAU) by the Monthly Active Users (MAU), then multiply it by 100. So, if a product has 200 DAU and 1,000 MAU, the stickiness rate is 20%.
What’s a good stickiness rate?
According to Mixpanel’s 2024 benchmark report, the average stickiness rate is 27%.
5. Customer engagement rate
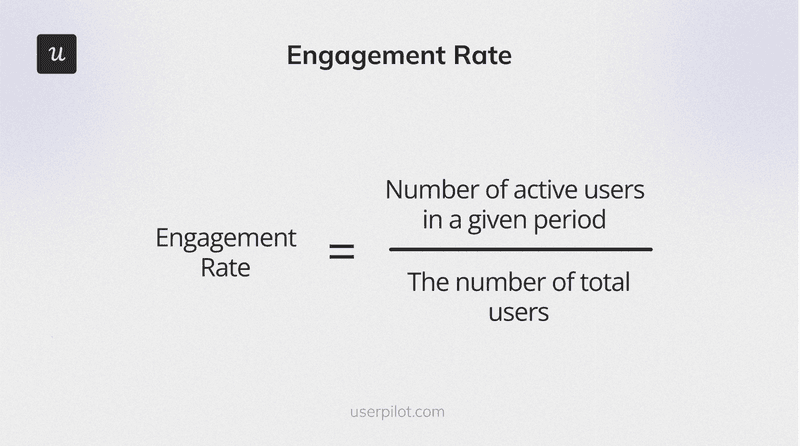
Customer engagement rate assesses the frequency and intensity of customer interactions with your product.
High engagement rates typically signal strong user interest and loyalty. Tracking engagement rate trends can also help you find the best time to engage your customers, for example, with new feature announcements.
Calculate it by dividing the total number of active users in a given period by the total number of users, then multiplying by 100. For example, if there are 5,000 active users in a month and you have 15,000 users, the engagement rate is 33%.
For more in-depth insights, you can look at the user interaction count – one user can engage with the product multiple times.
6. Average session duration
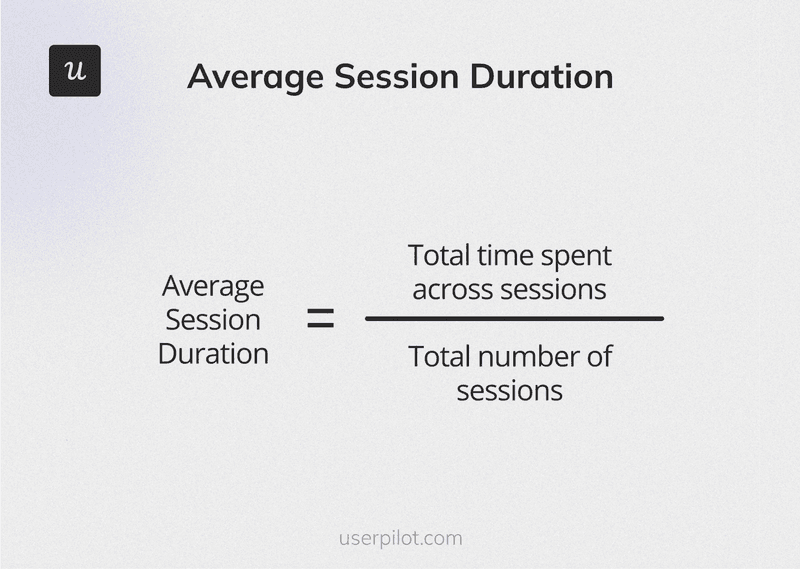
Average session duration measures the average amount of time users spend in a single session on your product.
The metric is an indicator of the value users derive from the product. The longer the sessions, the more valuable the experience.
At least, in theory. Unnaturally long session durations can indicate excessive friction in the user experience. So it’s best to look at it in the context of other metrics, like CES or retention rate.
To calculate the average session duration, divide the total time spent by all users by the number of sessions. For instance, if users spend 10,000 minutes across 500 sessions, the average session duration is 20 minutes.
7. Net promoter score
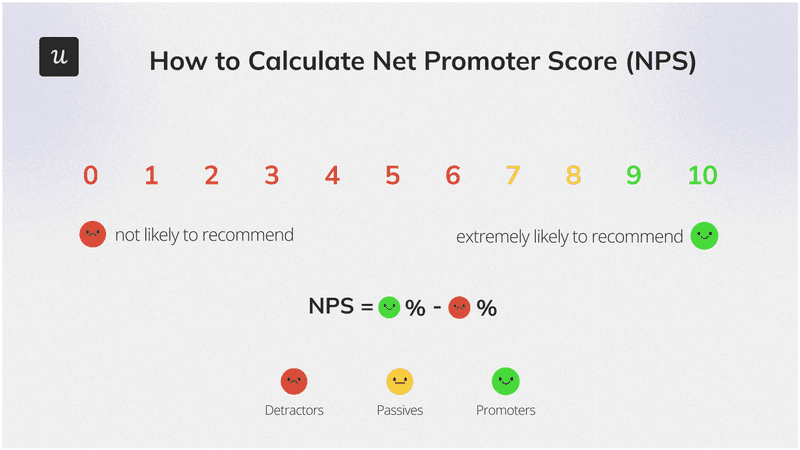
Net Promoter Score (NPS) measures customer sentiment towards the product, their loyalty, and advocacy. When followed up with a qualitative question, it’s also a source of valuable customer feedback on how to improve the product.
It’s calculated based on customer survey responses. The survey asks customers how likely they are to recommend your product on a scale of 0-10. You then group the customers into 3 groups: detractors, passives, and promoters, and subtract the percentage of detractors (0-6) from promoters (9-10).
For example, if 70% are promoters and 20% are detractors, the NPS is 50.
The companies we studied for our benchmark report had an NPS of 35.7 on average.
8. Customer satisfaction score
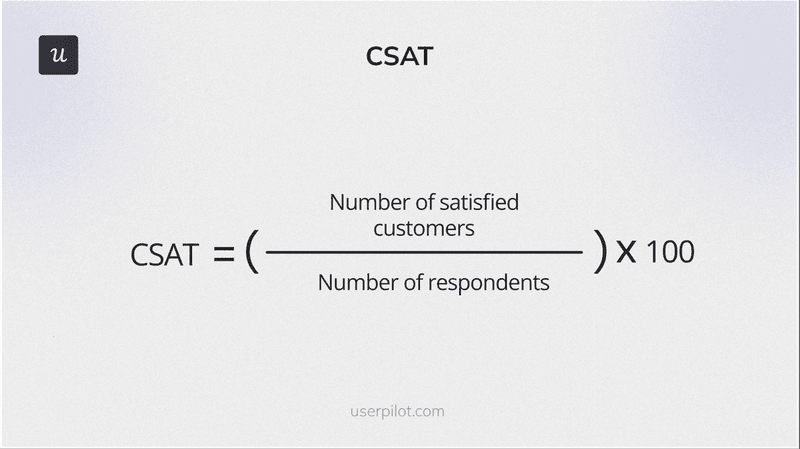
The Customer Satisfaction Score (CSAT) gauges customer contentment with a particular feature or the overall product experience. Customer satisfaction scores are closely linked with customer retention and loyalty.
Just like NPS, it’s based on a survey, in which you ask customers to rate their satisfaction on a scale, typically from 1 to 5. Next, you calculate the percentage of positive responses.
For example, if 80 out of 100 customers rate 4 or 5, the CSAT is 80.
What’s a good CSAT for a SaaS business? 65 is the average, so anything above is solid. But as with the other metrics, this can vary from vertical to vertical.
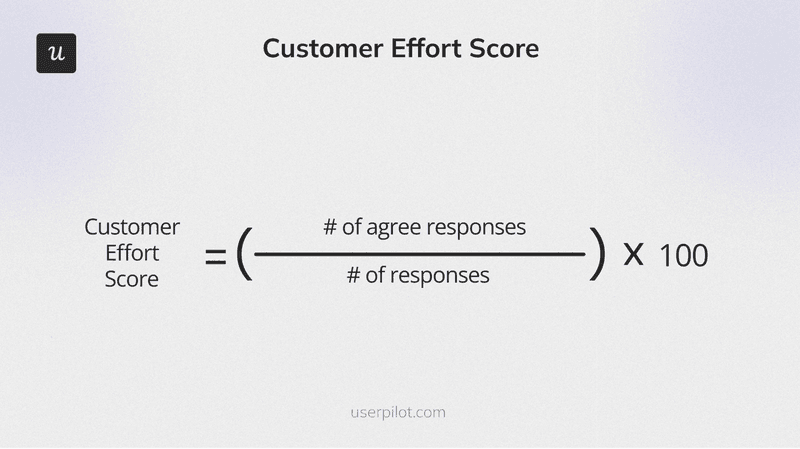
9. Customer effort score
Customer Effort Score (CES) is yet another survey-based metric. It measures how easily customers can complete a task or resolve an issue. A high CES indicates that the product is challenging to use. It can help you identify usability issues and eliminate unnecessary friction from the user journey.
In the survey, customers rate their effort on a scale from 1 to 5 or “Very Easy” to “Very Difficult.” Just like with CSAT, you divide the number of positive responses by the total number of respondents.
So, if 60 out of 100 respondents rate the experience as “Very Easy” or ‘”Easy”, the CES is 60%.
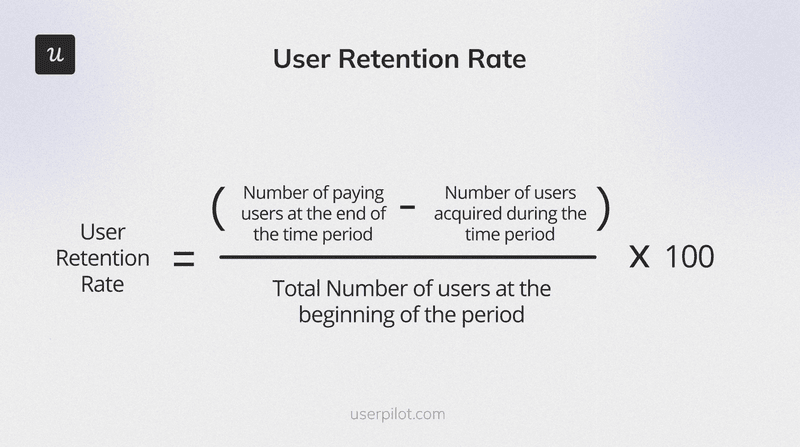
10. Customer retention rate
Customer retention rate is the percentage of customers who continue using your product over a specific period, for example, a week, month, or quarter.
The metric is crucial for assessing long-term satisfaction and loyalty. By analyzing retention patterns, you can also learn how long customers stay engaged and when you need to reengage them.
It’s also linked to other key metrics, like customer lifetime value, and it enables businesses to make informed forecasts and budgets for the future.
To calculate the retention rate, deduct the number of newly acquired customers from the number of customers at the beginning of the period. Next, divide it by the total number of customers at the beginning of the period and multiply it by 100.
In our success metrics benchmark report, we looked at the Month 1 retention rate. The average across all sectors was 46.9%.
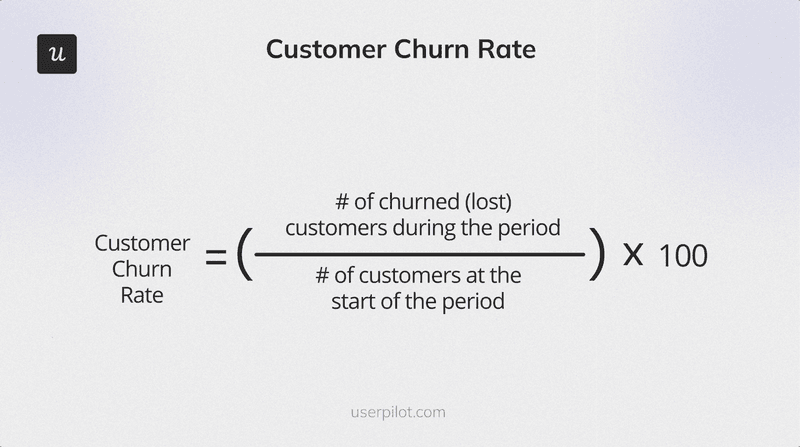
11. Customer churn rate
Customer churn rate is the percentage of customers who stop using your product within a given timeframe. This may indicate that they’re not satisfied with the value or user experience that you offer.
When combined with more in-depth analysis, the data can help you diagnose the reasons for churn and the stage of the user journey when it happens. With such insights, you can offer proactive support to prevent users from churning.
It’s calculated by dividing the number of churned customers by the total number of customers at the beginning of the period, then multiplying by 100. For instance, if 10 out of 500 customers leave, the churn rate is 2.5%.
A churn rate under 5% is a good result for a SaaS company that has found its product-market fit.
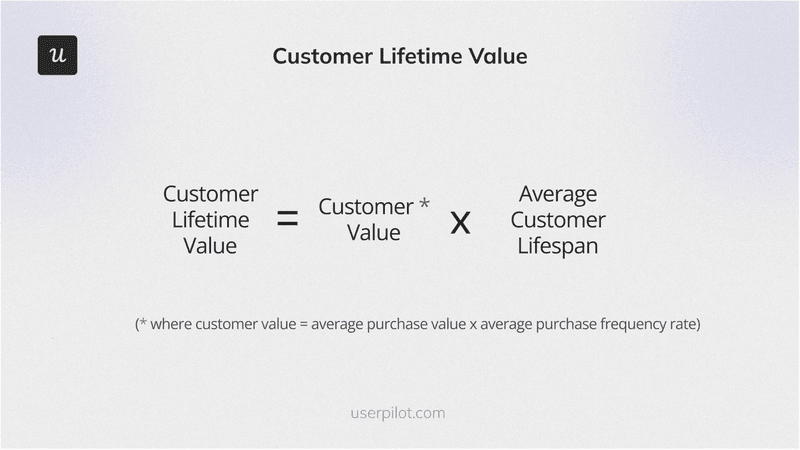
12. Customer lifetime value
Customer Lifetime Value (LTV) is the total revenue an average customer will generate during their entire relationship with your company.
High LTV could indicate effective customer retention and account expansion strategies. However, the metric should always be considered in the context of the customer acquisition cost (CAC). There’s no point getting excited about the LTV if you’re burning money on acquiring and retaining customers!
LTV is calculated by multiplying the average purchase value, average purchase frequency, and average customer lifespan. So if a customer spends $50 a month and the lifespan is 5 years, the LTV is 50×12×5=$3,000.
Conclusion
That’s it – 12 customer engagement metrics to help you monitor customer interaction trends over time, identify issues, and compare how your product performs against competitors.
If you’d like to learn how to track (and improve) the metrics with Userpilot, book the demo!
![]()
Ready to Track Your Customer Engagement Metrics?
About the author