Wondering what customer satisfaction benchmarking is in SaaS and how your business compares to other SaaS companies?
Comparing your performance against other companies in your industry can give you a crystal clear view of where you stand. You can then make more informed decisions to improve customer satisfaction and retain more customers.
In this article, we go in-depth about customer satisfaction benchmarks and how you can measure and improve it.
Try Userpilot Now
See Why 1,000+ Teams Choose Userpilot

What is customer satisfaction?
Customer satisfaction refers to measuring how satisfied your customers are with your products, services, and business as a whole.
What is customer satisfaction benchmarking?
Customer satisfaction benchmarking evaluates your company’s customer satisfaction levels and data against competitors. It lets you understand the average industry benchmark, how well the company is performing, and what areas have scope to improve.
Why is customer satisfaction benchmarking important?
Customer satisfaction benchmarking helps you improve your overall performance and have a competitive advantage. Here are its benefits.
Measure the company’s performance against competitors
Tracking your company’s current and past customer satisfaction levels against competitors will allow you to see how well your company is performing.
You can then better understand whether you meet customer needs or not. It is especially important in the SaaS industry, where customer experience drives revenue.
This will also help you identify trends in the industry, and stay ahead of the competition.
Get actionable insights and improve customer experience
Collecting and analyzing customer data on their experiences can provide valuable insight into areas where you fall short and where you can improve. Once you know what the pain points are through customer feedback, you can take action to improve them.
And as you fix the problems and improve the customer experience, you can see an improvement in customer satisfaction with your products. It will eventually enhance customer loyalty and give you more opportunities for repeat business.
What are the 3 key metrics to measure customer satisfaction?
To measure customer satisfaction effectively, you need to gather customer data and measure the right customer satisfaction metrics.
Let’s go through the 3 most important metrics that can help you improve customer satisfaction.
Customer Satisfaction Score (CSAT)
The customer satisfaction score (CSAT) is a quantitative metric that measures customer service and the quality of your products or services.
Using a CSAT survey, you can ask customers to rate your product or service. The scale can range from 1-10 or 1-5 or 1-7 on an “extremely dissatisfied – extremely satisfied” basis. You can calculate the CSAT scores by dividing the number of happy customers by the number of total customers asked.
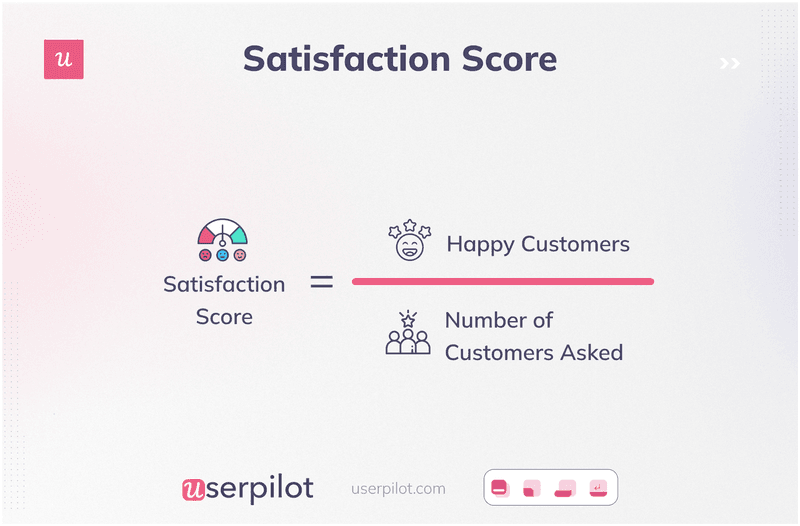
Assume 80 of your 100 responders gave a rating of 9 or 10. Your CSAT score would be (80/100), or 8 out of 10.
You can deliver a CSAT survey in different formats, such as email, phone, in-app, etc. But the in-app format is the most effective for SaaS products because it lets you collect data in real-time.
When should you use a CSAT survey?
You should use a CSAT survey after specific interactions for real-time feedback and accurate insight into your customer service delivery.
Try to use a CSAT survey after the following key interactions in the customer journey:
- Customer onboarding process
- Customer support interactions
- Specific feature usage
- Before a renewal
You can also use it regularly to assess overall customer health and identify pain points.
Customer Effort Score (CES)
The customer effort score (CES) is a metric that measures how easy it is for customers to interact and engage with your products or services.
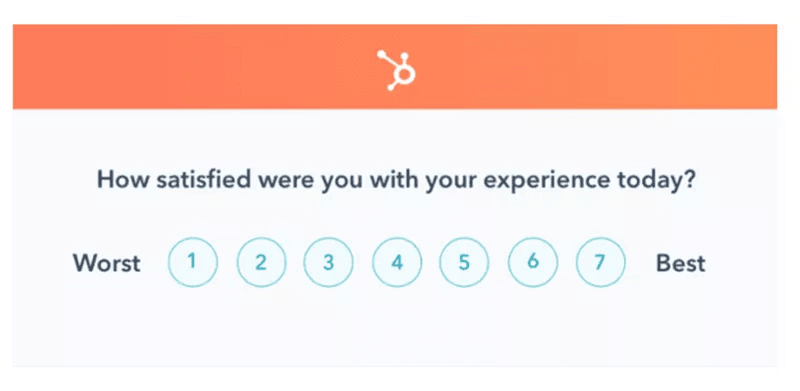
To calculate customer effort scores, divide the number of ratings of 5, 6, and 7 on a scale of 1 to 7 by the number of responses, and multiply by 100.
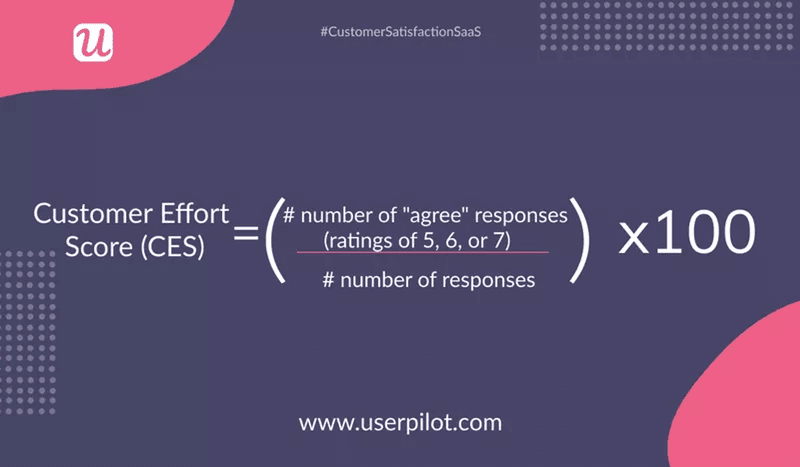
Suppose you asked 200 customers, and 120 responded with ratings of 5+. Your CES is (120/200)*100 or 60%.
Although you can use formats like email surveys and web-based surveys to deliver CES surveys, in-app formats remain the most convenient way to do so, as customers don’t need to leave the app.
When should you use a CES survey?
You can get the best output by using CES surveys after your customer:
- Engages with a feature for the first time
- Engages with customer support or success
- Reaches a milestone in the customer journey
- Has used the product for a long time
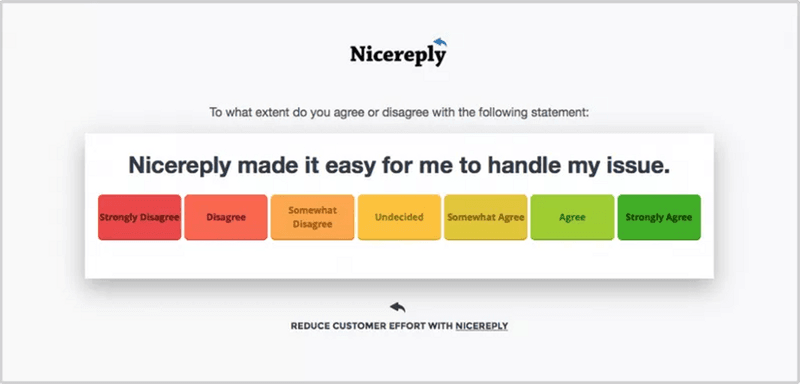
Here is how Nicereply uses the CES survey.
Net Promoter Score (NPS)
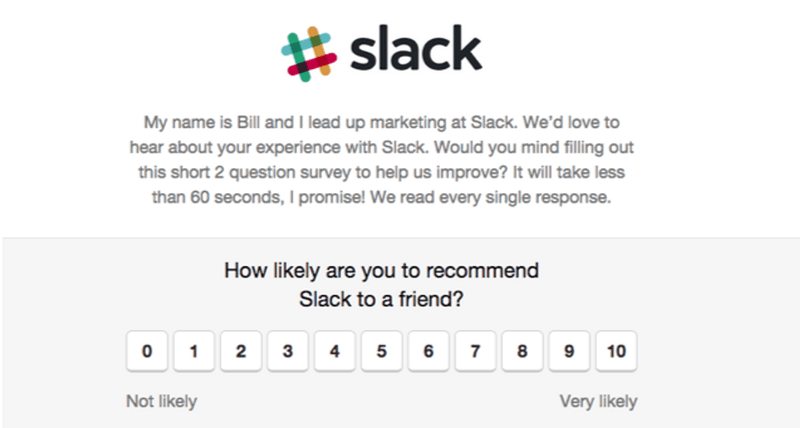
The net promoter score (NPS) measures the likelihood of your customers recommending your products or services to a friend or colleague.
To calculate the NPS score, subtract the percentage of detractors (respondents with 6 or below) from the percentage of promoters (respondents with 9 or 10).
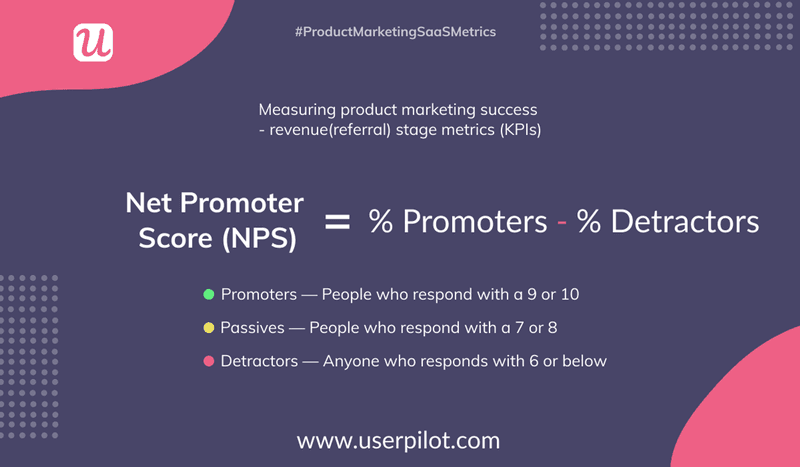
For example, 56% of your respondents gave your product a score of 9 or 10, and 8% gave it a 6 or below. Your NPS is (56-8) or 48.
When should you use an NPS survey?
Finding the right moment to use an NPS survey in the case of SaaS products can be a bit tricky. But you can break the customer journey into two phases – the early phase and the ongoing phase, to get more accurate feedback.
Here is how you can use NPS in each phase:
- Early phase: Send an NPS survey after the customer has finished the onboarding process and used the product or service for some time. But ensure that you don’t send it right after the customer starts using the product, as they won’t have enough feedback to share with you.
- Ongoing phase: Use NPS surveys at various touchpoints throughout your customer’s lifecycle with your product. It will help you understand how they feel about your customer experience.
Try to send an NPS follow-up question to understand why a customer has given you a specific score.
CSAT vs CES vs NPS: Which metric should you use for measuring customer satisfaction?
CSAT, CES, and NPS are all critical metrics to consider if you want to measure customer satisfaction. However, each of these metrics has advantages and disadvantages.
So, you should use them together to get a holistic and complete picture of your products’ customer satisfaction and loyalty.
CSAT: Pros & Cons
- Pros: Quick and easy to identify customer satisfaction issues and let you take prompt action to improve customer loyalty and satisfaction in the long term. You can then understand customer expectations better and personalize the customer experiences.
- Cons: May not be able to provide the complete picture and prediction of customer loyalty, especially compared to CES and NPS. CSAT only captures a portion of the level of customer satisfaction at a specific time.
CES: Pros & Cons
- Pros: More informative than other metrics like CSAT in helping you determine the effectiveness of your customers’ service experiences. You can use the valuable insight to improve your products and services.
- Cons: Less holistic than metrics like NPS or churn rate because it only gives information on a narrow part of the customer experience without going into detail about the overall customer experience and satisfaction.
NPS: Pros & Cons
- Pros: A simple and easy-to-use survey that helps you track customer sentiment over time, measure customers’ overall experiences with your company, and understand the key drivers of customer loyalty.
- Cons: Provides only a single score, which can be misleading without context. If you don’t dig much into the results with a follow-up question, NPS can become a “vanity metric” that doesn’t result in any action.
What are the customer satisfaction industry benchmarks?
Now, let’s look at the customer satisfaction industry benchmarks to help you find out how you are doing compared to your competitors.
CSAT benchmarks
Any score above 50% (around 60% – 70%) is ideally a good CSAT score because it indicates that most respondents, or your customers, are happy.
But with an average CSAT score in the high 60s, the SaaS industry is one of the most competitive in terms of customer satisfaction. As a result, customer expectations for B2B SaaS and other models are very high too.
Here is the Retently 2022 CSAT Benchmark.
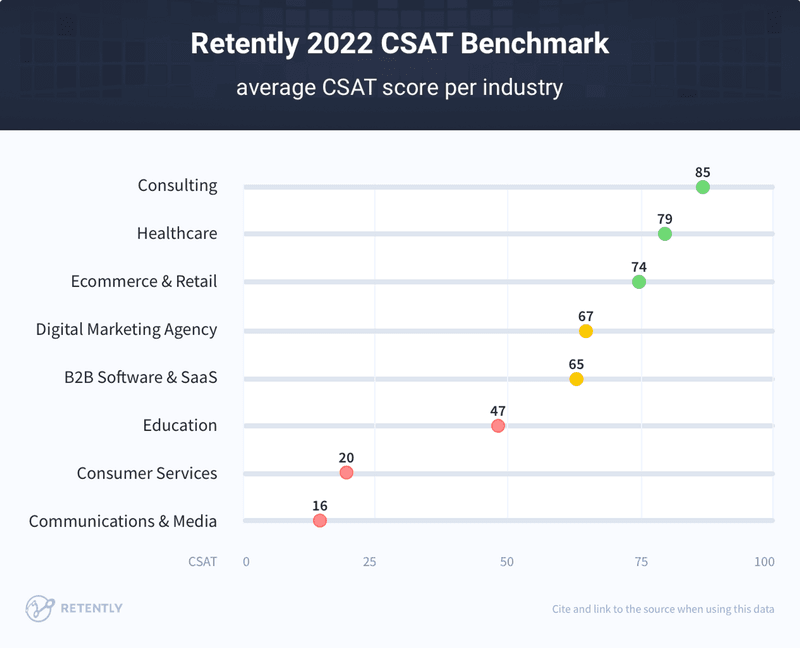
We see here that a score between 65% and 70% is a dominant value across several industries. We can keep the following score list in mind to grasp the CSAT score benchmarks in general.
- 0-35 = very bad/extremely dissatisfied.
- 35-50 = poor/unsatisfied.
- 50-65 = average/quite satisfied.
- 65-80 = good/satisfied.
- 80-100 = excellent/extremely satisfied.
CES benchmarks
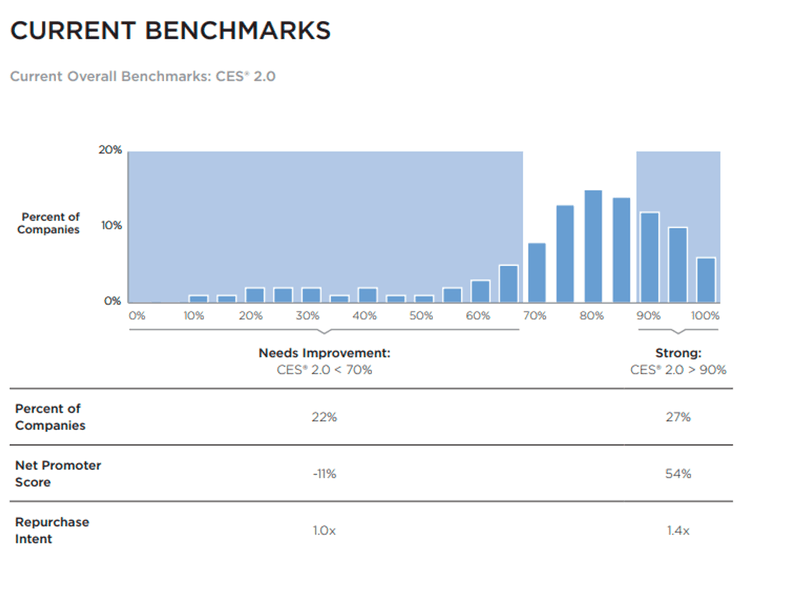
According to Gartner’s released CES benchmark, scores below 70% indicate areas for improvement, and scores above 90% show that the product or company is in a strong position.
Benchmarking CES should not be solely about comparing your score to your competitors’. Instead, compare your current CES with one from six months or a year ago. This will help you gain a better understanding of what’s going on and what your product needs to improve.
H3 NPS benchmarks
NPS benchmarks can vary significantly across industries. So, it is important to check the average in your industry to understand what a good or bad score is for your product.
Let’s look at the 2022 average NPS by industry, where the SaaS industry NPS benchmark is around 40.
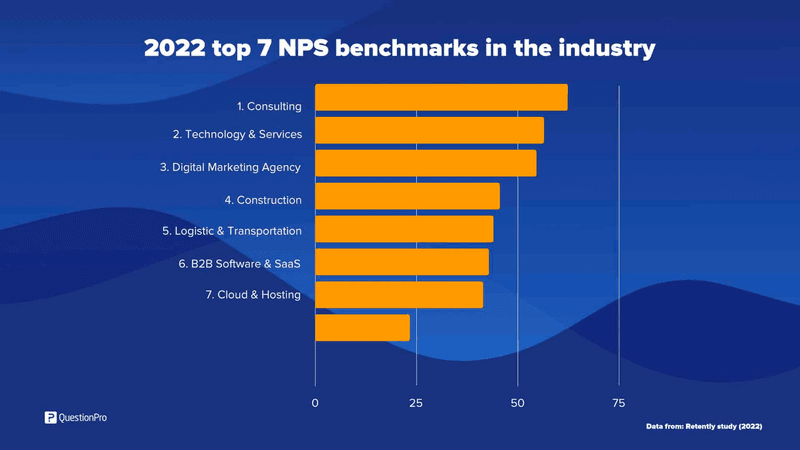
A positive NPS score or score above 0 indicates “good” performance, and anything above 30 indicates excellent performance.
It is also worth noting that these benchmarks and the average NPS have risen in recent years. The growing emphasis on customer experience is the primary reason behind the increase in the NPS score from around 30 to around 40 in just three years.
How to collect user feedback and measure customer satisfaction with Userpilot?
Userpilot is a code-free user onboarding, engagement, and adoption platform. But with its versatile features, it is one of the best product feedback and customer feedback tools.
You can create and send different microsurveys, such as CSAT, NPS, and CES. It allows you to customize the surveys and send them to different user segments (Userpilot can do the customer segmentation automatically too).
Extending these capabilities, Userpilot’s mobile features allow customers to trigger NPS surveys directly on mobile, effortlessly gathering valuable user insights on-the-go.
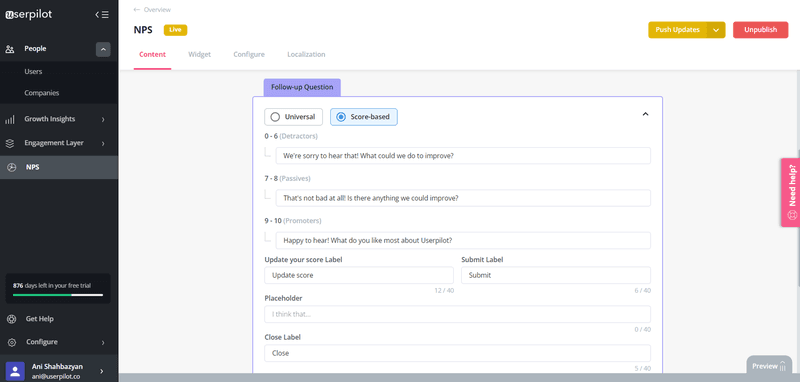
Depending on the respondents’ scores, you can also add different follow-up questions to the survey. It will help you understand the reasons behind your customers’ scores and do what is necessary to improve the product.
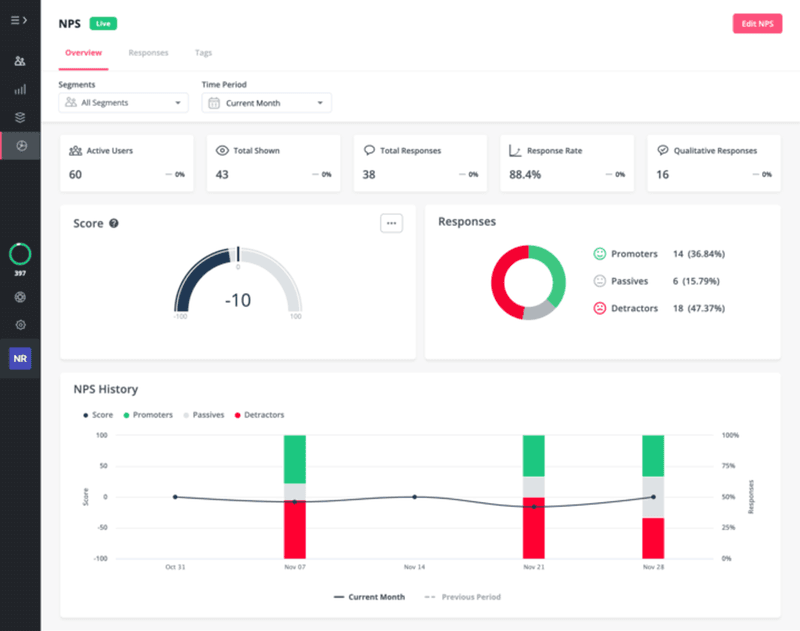
Userpilot’s advanced analytics provide in-depth data and powerful insights about your efforts to increase customer satisfaction. You can make more informed and data-driven decisions to improve customer experiences and satisfaction with them.
Conclusion
Customer satisfaction benchmarks work best when you focus on your scores instead of only looking at competitors.
Ensure you measure customer satisfaction, analyze consumer feedback, and tailor your offerings to meet your customers’ expectations.
Want to collect in-app user feedback and improve your customer satisfaction benchmarking code-free? Get a Userpilot demo and see how you can effectively do it.


