As you’re researching dashboard reporting tools, you’ve probably noticed how hard it is to find reliable information on the available solutions.
To make your life a little bit easier and help you choose the best dashboard analytics tool for your SaaS, we’ve produced a guide of 12 excellent platforms available on the market in 2026.
Let’s dive in!
What’s your biggest challenge with dashboard reporting tools right now?
How much customization do you need in your dashboard software?
What is your team’s technical skill level when it comes to data analysis?
Based on your needs, a no-code platform that offers deep insights and easy customization is the right fit.
See how Userpilot’s powerful dashboard reporting tools can help you turn complex data into clear actions without writing a single line of code.
Try Userpilot Now
See Why 1,000+ Teams Choose Userpilot

What is a dashboard reporting tool?
A dashboard reporting tool is software that displays key information about your business or activities in one easy-to-view place.
It updates in real-time, allowing you to quickly understand your performance, identify issues, and make informed decisions. This tool simplifies data management, enabling you to focus on what matters most efficiently.
What qualities to look for in dashboard software?
When selecting dashboard software options, you should focus on key features that will help you find a tool that meets and exceeds your expectations.
- Ease of Use: The product should be straightforward and intuitive. It should make it easy for everyone on your team to navigate and utilize its features without extensive training.
- Customization Options: A one-size-fits-all approach doesn’t work for dashboard tools. The ability to customize your dashboard—from the data visualization styles to the specific metrics you track—is vital.
- Integrations: The power of a dashboard is significantly amplified by its ability to integrate with other systems you already use. Seamless integration helps to break down data silos, offering a comprehensive view of your business performance across all platforms.
- Value for Money: Cost is always a consideration, but the focus should be on the value the tool delivers for its price. The best dashboard software offers a balance of essential features and affordability, ensuring you get the functionality you need without overspending.
- Data Privacy: With the increasing importance of data security, your dashboard software must have strong data privacy measures in place. It should protect your marketing data from unauthorized access, ensuring your information remains secure and compliant with regulations.
12 Best reporting tools for getting actionable insights
Navigating the myriad dashboard reporting tools available can be overwhelming, but finding the right one can convert raw data into insights that drive your business forward.
In this section, we’ll discuss some of the best tools on the market and hopefully help you make a decision.
Let’s dive in!
1. Userpilot: Best no-code reporting tool
Userpilot is a digital growth platform with comprehensive product analytics and data visualization capabilities. It not only helps you collect data from different sources but also helps you get actionable insights and use them.
Main features
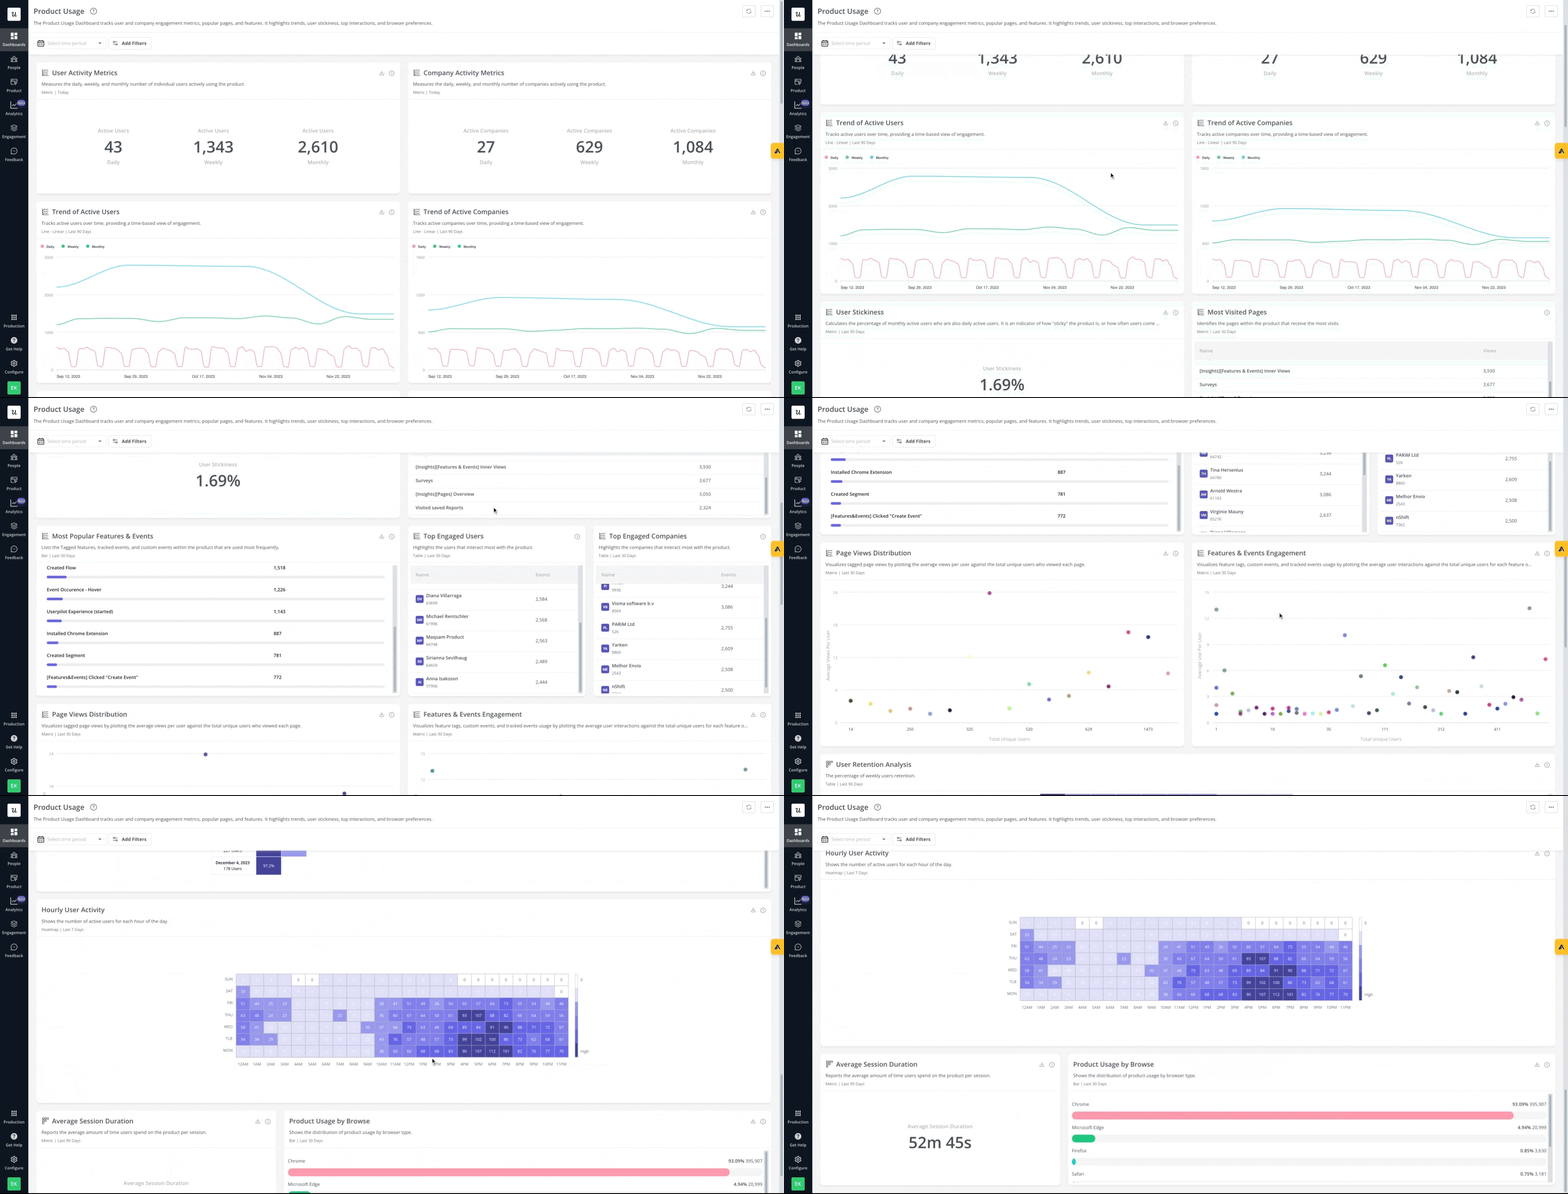
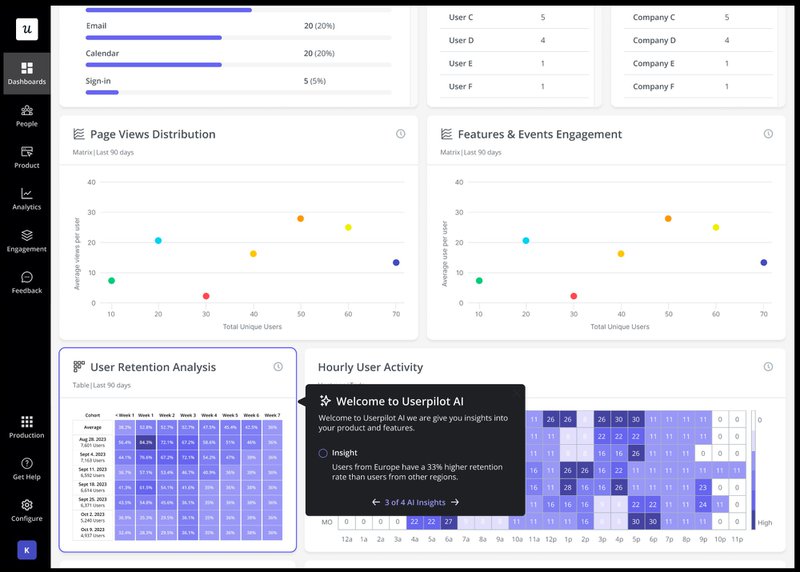
- Analytics Dashboards: Userpilot offers various analytics dashboards, including product usage, Core Feature Engagement, user activation, and user retention. These dashboards allow you to track key performance indicators such as active users, page views, and average session duration, amongst others.
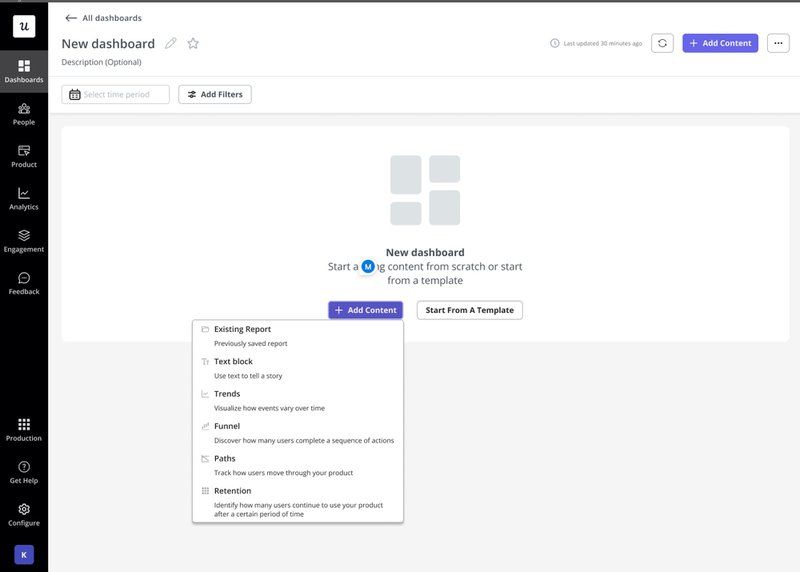
- Custom Dashboards: Enables the creation of custom KPI dashboards tailored to your specific metrics and visualization options. This gives you the flexibility to monitor what’s most important to your product’s success.
- AI Analytics: This feature is designed to help non-technical teams derive actionable insights from the data collected. For example, it can dive deep into the numbers on a dashboard and sum up the trends in it.
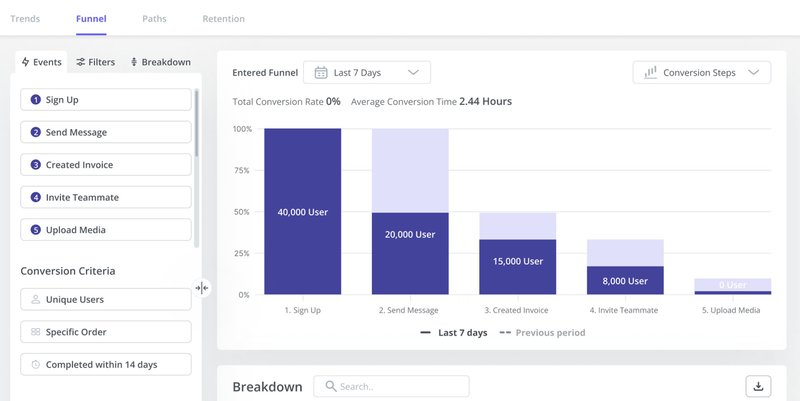
- Funnel Reports: Userpilot’s funnel reports feature allows you to monitor how users progress through different steps of your funnel. You can then identify potential drop-off points and act on them to improve conversion rates.
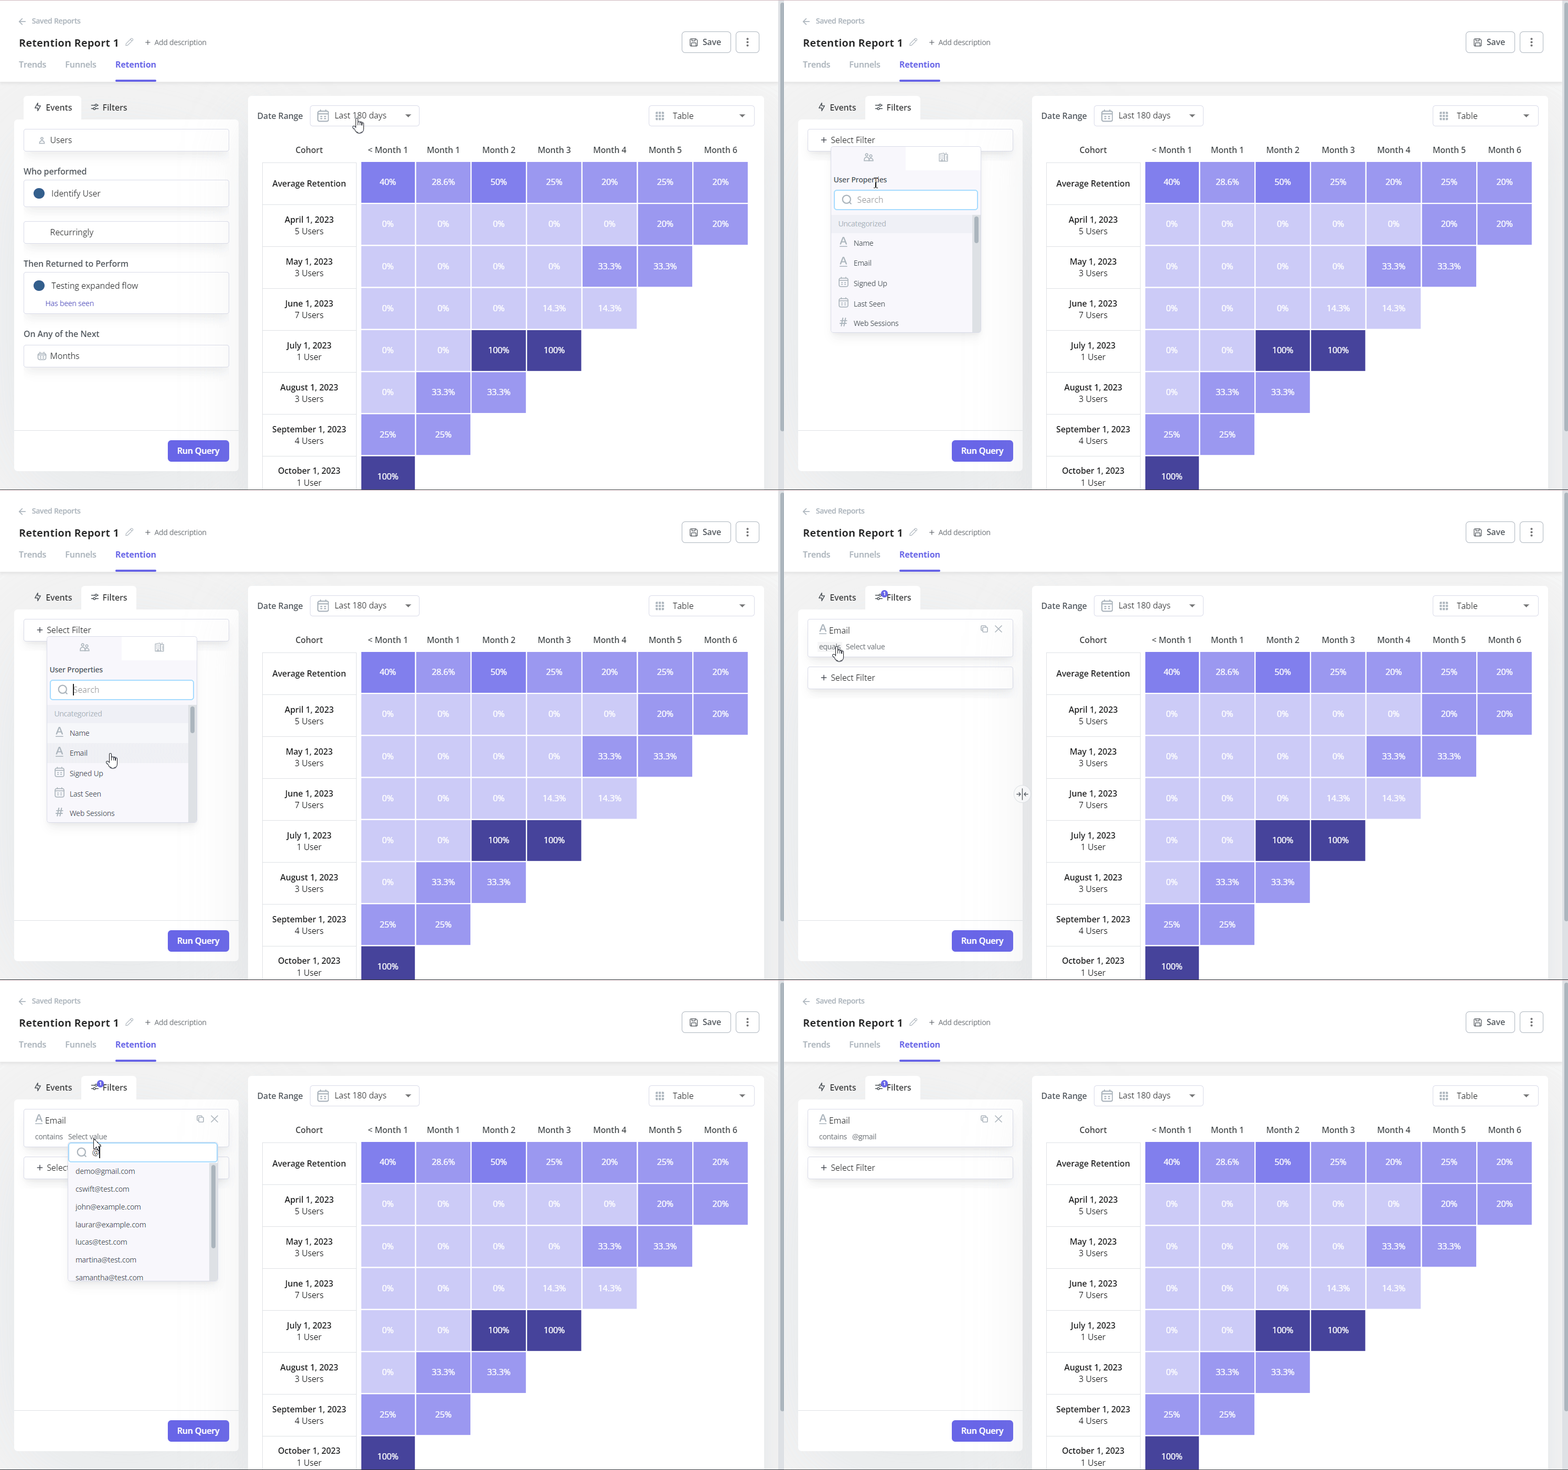
- Cohort Tables: Track and analyze retention rates among different user cohorts, providing valuable insights into user engagement and loyalty over time. You can also apply filters and segment data for more granular analysis.
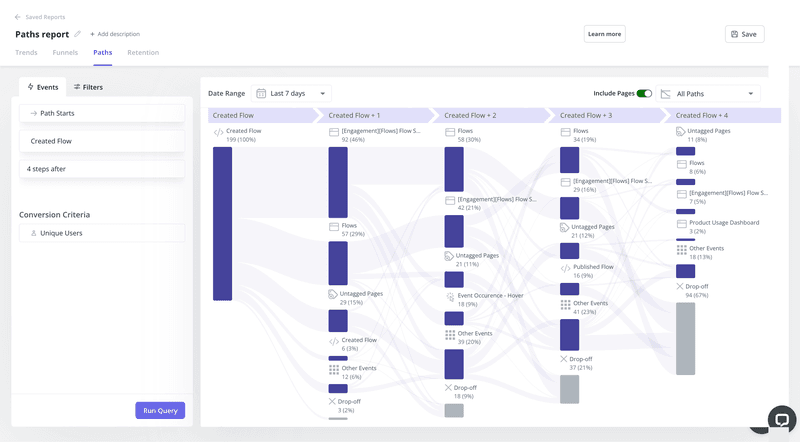
- Path Analysis: The path analysis tool in Userpilot enables teams to analyze user behavior by visualizing the customer journey inside the app. You’ll need to choose a starting and ending points and then you’ll see which percent of people complete each action or where they drop off.
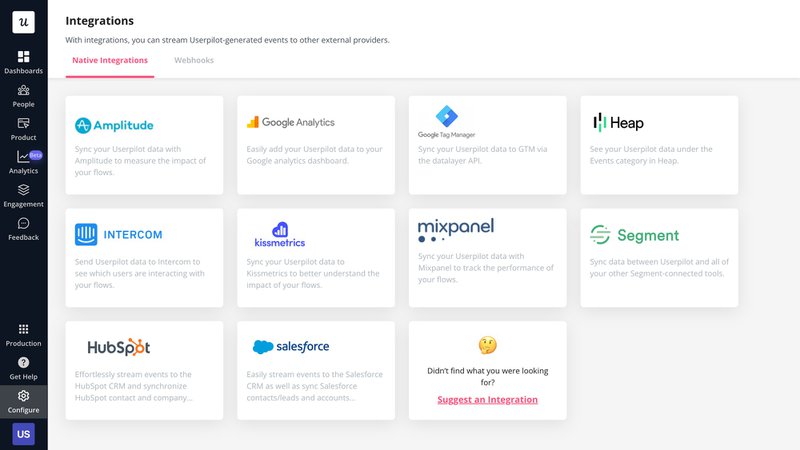
- Data Integrations: Userpilot boasts a wide range of integrations with leading tools such as Google Analytics, Mixpanel, Kissmetrics, Hubspot, Amplitude, and more, facilitating you to import data and comprehensive analysis.
Pricing
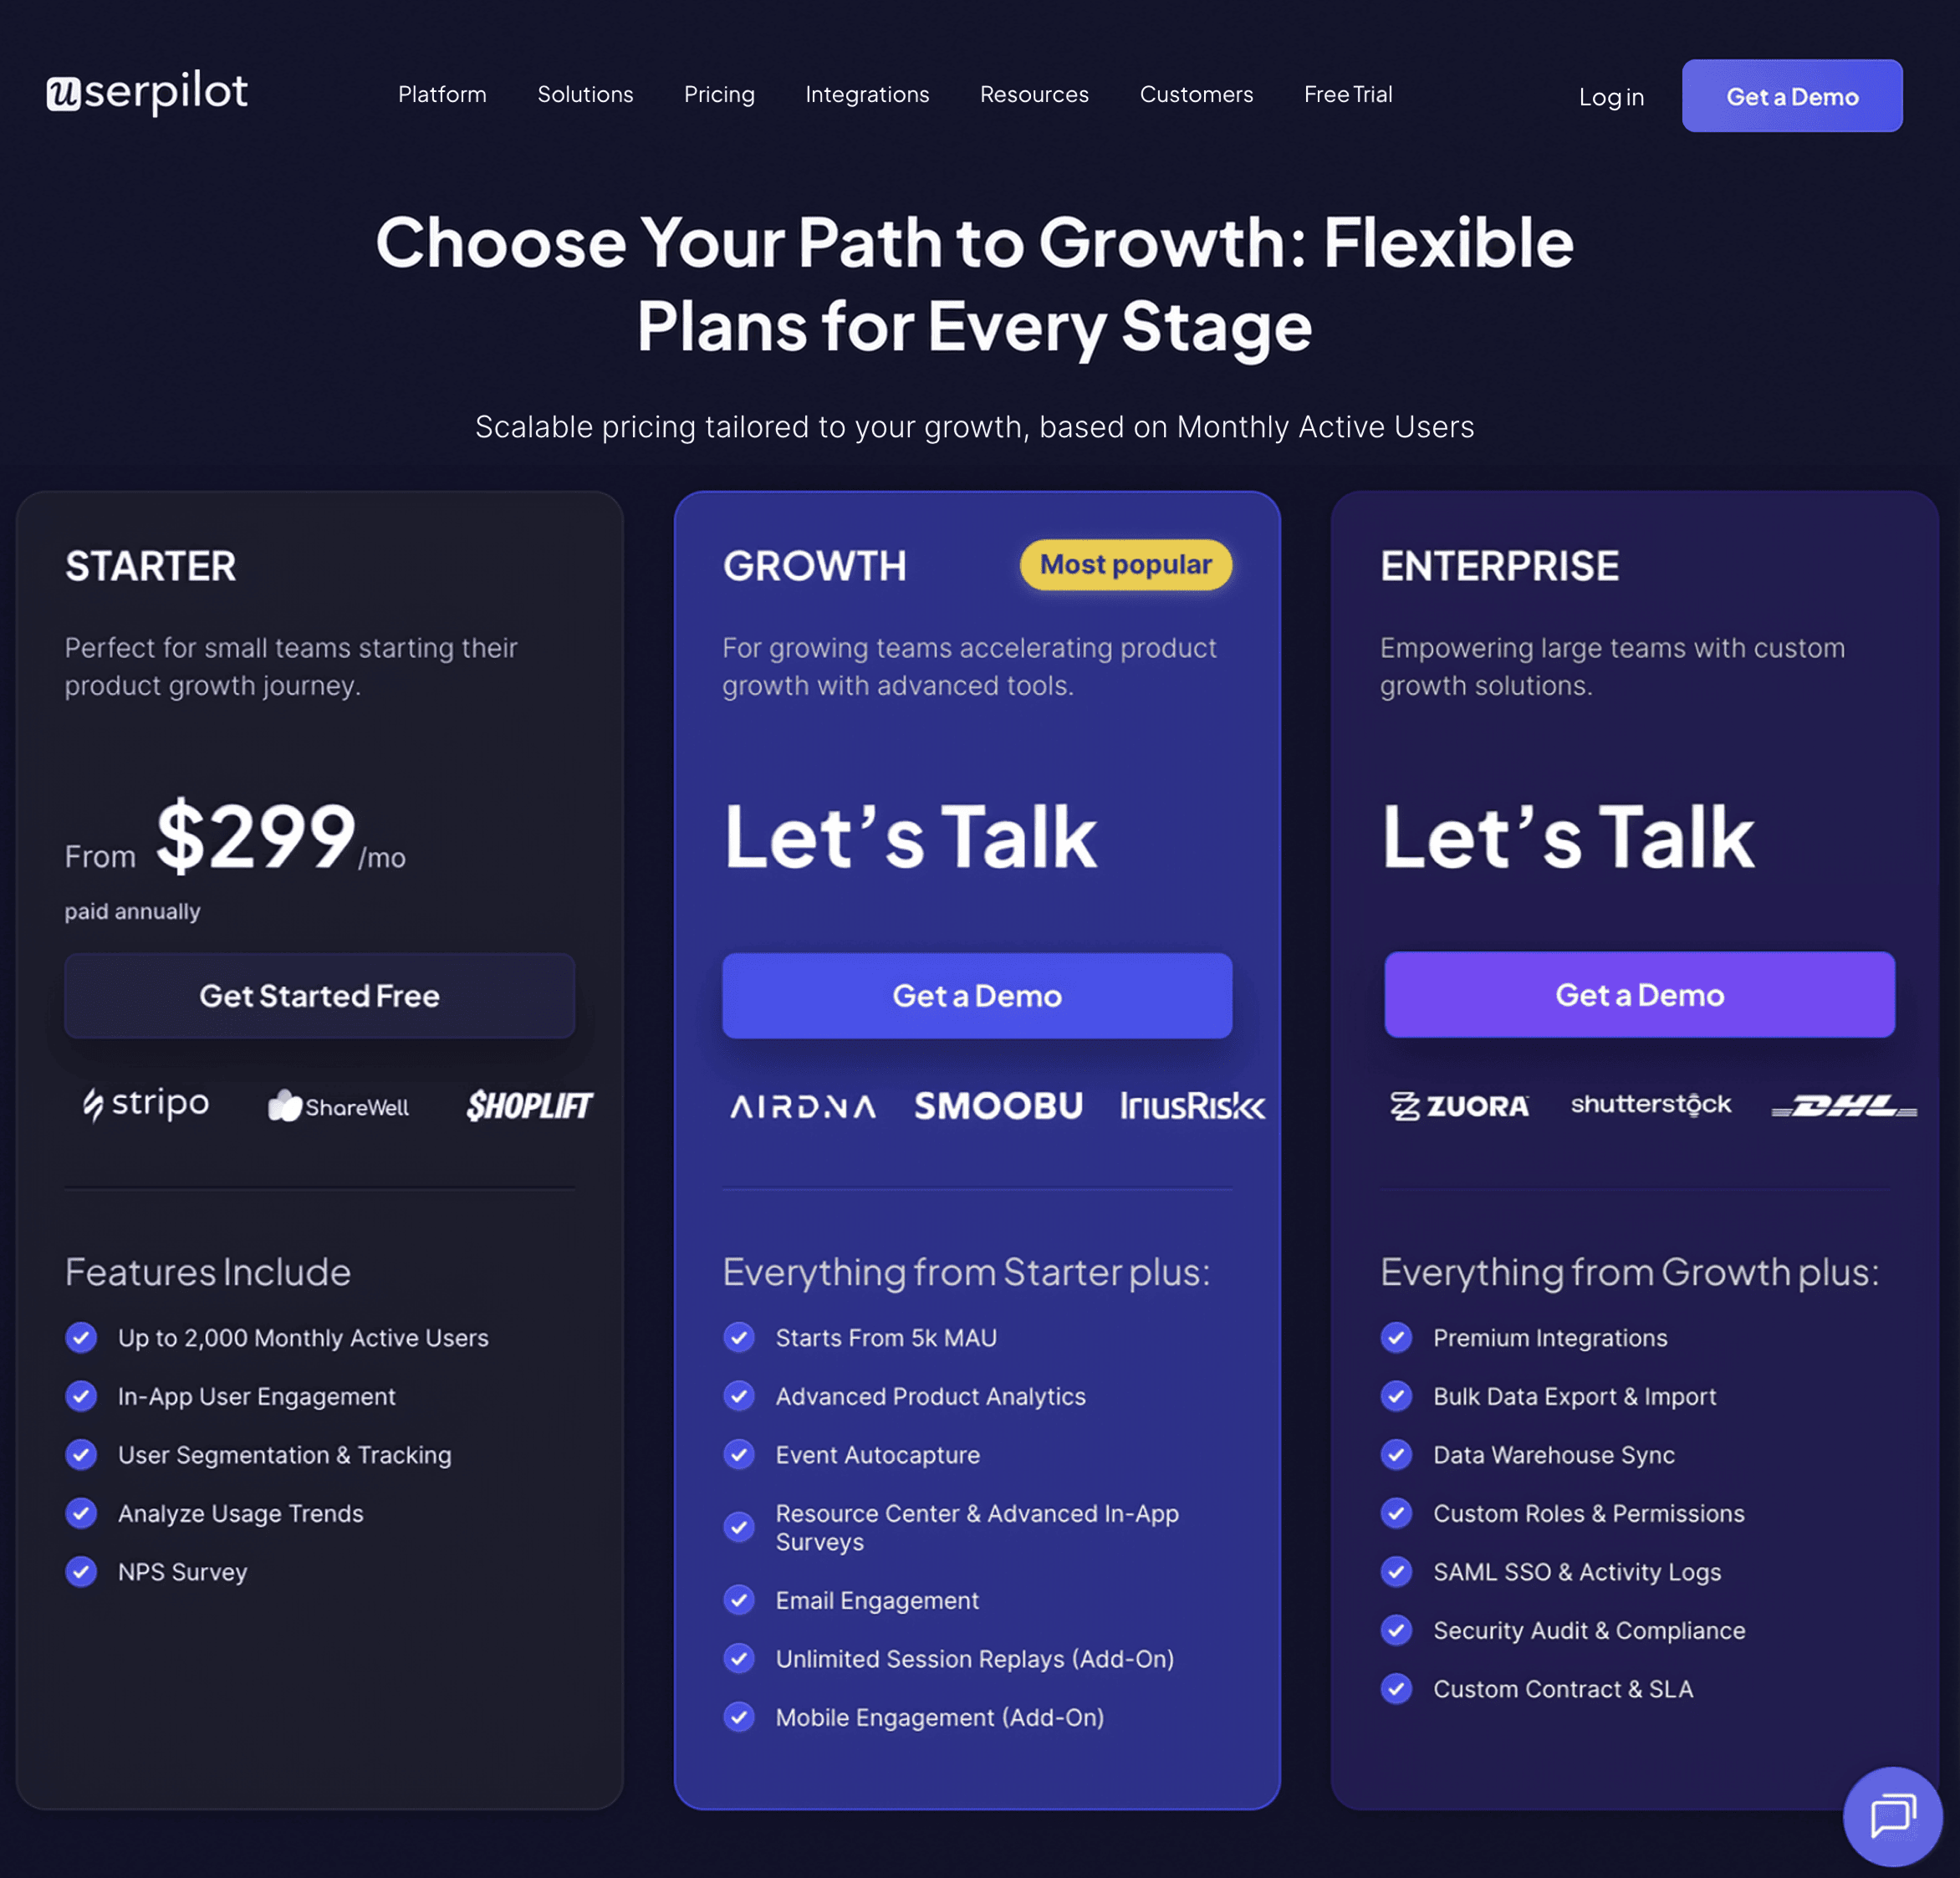
Userpilot offers flexible pricing based on your monthly active users (MAUs). Plans start at $299 per month for smaller teams and scale as your user base grows.
Below are the pricing tiers you can choose from:
- The Starter plan begins at $299/month (billed annually) for up to 2,000 monthly active users. It includes in-app user engagement, usage trend analysis, NPS surveys, and essential product analytics—ideal for mid-market SaaS teams getting started.
- The Growth plan offers custom pricing and adds advanced analytics, retroactive event auto-capture, in-app surveys, session replay, and more. It’s the most popular choice for growing teams that need deeper insights and scale.
- The Enterprise plan offers custom pricing and includes everything in Growth, plus bulk data handling, custom roles and permissions, SOC 2 Type 2 compliance, and enterprise-level support.
2. DataBox: Best reporting tool for data-visualization
DataBox stands out for its intuitive design, emphasizing ease of use, flexibility, and customization.
Businesses choose it for its user-friendly approach to data visualization and its capacity to integrate with a wide array of data sources without requiring coding skills.
Main Features
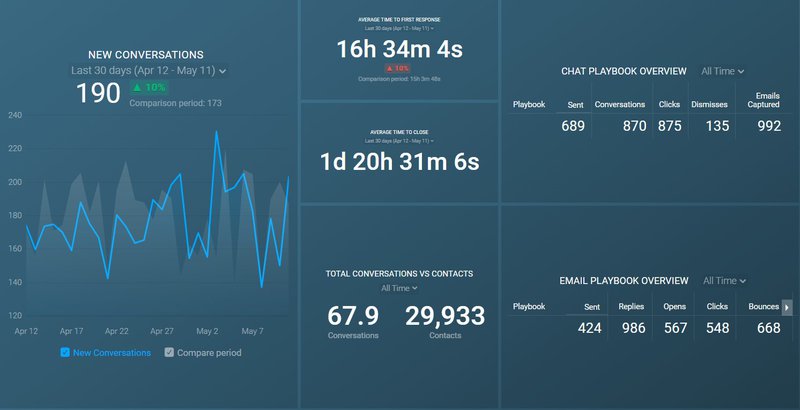
- Intuitive Features and Visual Reporting: Offers a user-friendly interface with excellent visual reporting graphics, simplifying the import, tracking, and visualization of business KPIs.
- Goal Setting and Performance Tracking: Enables users to set goals and track performance from any device, providing notifications, scorecards, and alerts for up-to-date metrics monitoring.
- Unified View Across Devices: Provides a cohesive dashboard experience across multiple devices and locations, allowing for visualization of unified marketing data and analytics metrics.
- Extensive Integrations: Features over 100 one-click integrations with popular business apps and over 650 additional integrations through Zapier.
Pricing
- Free: Monitor key metrics for up to three data sources. Includes daily data updates, three business users, and three dashboards.
- Starter: $47/month. Monitors from 70+ data sources, including five users, data updated every four hours, and unlimited dashboards.
- Professional: $135/month. Offers custom analytics and monitoring from any data source, includes 15 business users, data updated hourly, and up to 300 custom metrics.
- Growth: $319/month. For companies focused on growth, it includes AI-enhanced analytics, unlimited users, data updated hourly, and up to 1,000 custom metrics.
- Premium: $799/month. For larger companies needing enterprise-level security, faster data sync, priority support, and a dedicated analyst.
3. Looker Studio: Best free reporting tool
Google Data Studio, now known as Looker Studio, offers a platform for creating customizable analytic dashboards. It’s especially useful for collaborative efforts, allowing real-time work on reports with both team members and external partners.
While it excels in user-friendliness and customization, certain limitations may prevent it from satisfying the need for advanced dashboard tools.
Main Features
- Custom Analytics Dashboards: Enables the creation of fully customizable dashboards, with features for adding logos, icons, changing backgrounds, and more, tailored to fit your brand.
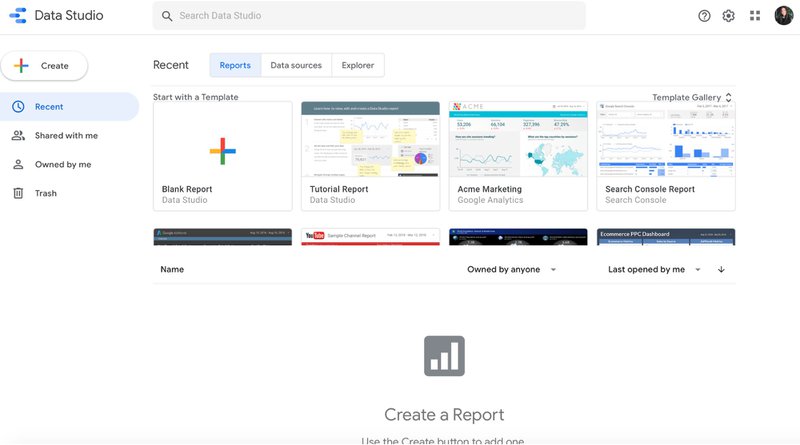
- Templates: Offers a variety of templates, including reports for YouTube channels, Google Ads overviews, and more, making it easier to start and scale your analytics efforts.
- Data Visualization: Transforms your data into powerful components for charts and graphs, supporting bar charts, pie charts, tables, heat maps, and other visual formats.
Pricing
Google Data Studio is free to use.
4. Microsoft Power BI: Best for extensive cloud-based analytics and reporting
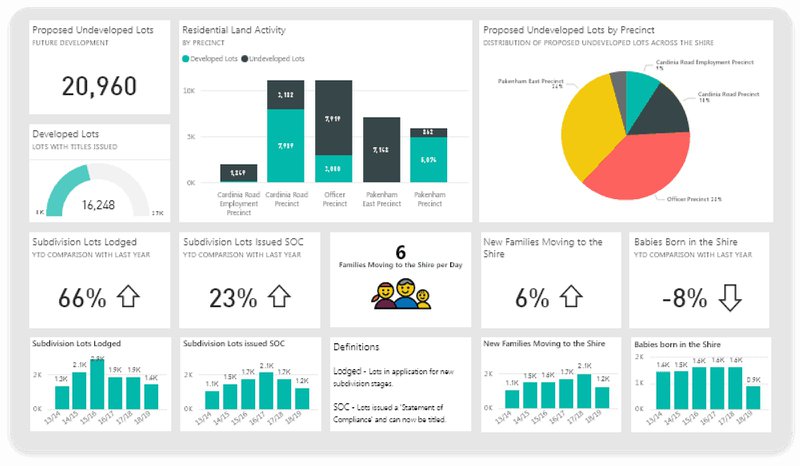
Microsoft Power BI is a leading cloud-based analytics and data visualization platform known for its comprehensive capabilities in interactive reporting, real-time dashboards, and extensive data connectivity.
Main features
- Versatile Platform: Offers desktop and mobile applications, providing flexibility in accessing interactive reports and real-time dashboards.
- Extensive Data Connectivity: Can connect to dozens of data sources, ensuring comprehensive data integration for diverse analytics needs.
- Embedded Visuals and Trend Identification: Features include embedded visuals that allow seamless integration into apps or websites and trend identification tools for spotting data patterns.
- Custom Reports: Enables the creation of custom reports tailored to specific business requirements, enhancing the relevance and impact of data insights.
Pricing
- Free Version: Includes basic analytics capabilities with a limit of 1GB of analysis per user.
- Power BI Pro: Priced at £8.20 per user/month, includes features like report sharing and is included in Microsoft 365 E5.
- Power BI Premium: At £16.40 per user/month, access to more advanced features such as larger model sizes, more frequent data refreshes, and enterprise-scale capabilities.
5. Tableau: Best reporting tool with intensive integrations
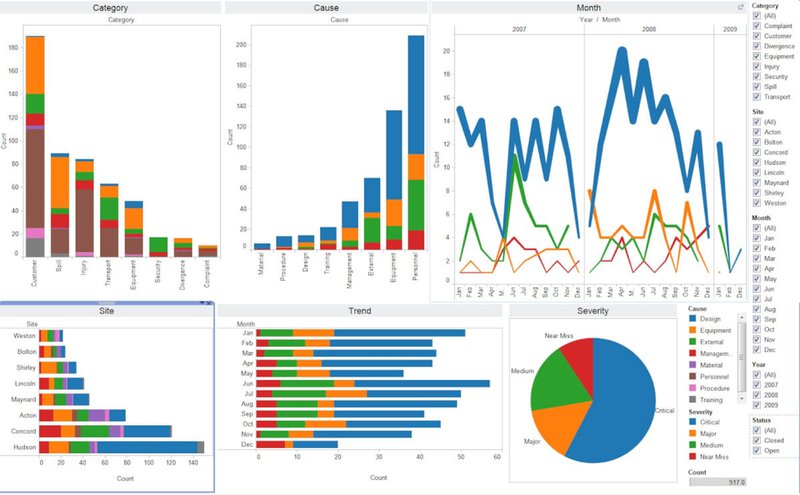
Tableau is recognized for helping large organizations fully leverage their data and personnel.
It’s a powerful data visualization and analytics reporting tool, offering scalability, data refresh automation, and secure access for external teams and clients.
Main features
- Quick Setup and Scalability: Easy to start and scale according to your needs, Tableau supports a seamless addition of users as your organization grows.
- Data Refresh Automation: Automates data refresh from web applications such as Google Analytics and Salesforce, ensuring your analytics are always based on the latest data.
- User and Content Management: Provides tools for site admins to manage authentication, permissions, and access for users, content, and data efficiently.
Pricing
- Tableau Creator: $75 per user/month (billed annually). Includes Tableau Desktop, Tableau Prep Builder, Tableau Pulse, and one Creator license on Tableau Cloud.
- Tableau Explorer: $42 per user/month (billed annually). Offers self-service analytics, including Tableau Pulse and one Explorer license for Tableau Cloud.
- Tableau Viewer: $15 per user/month (billed annually). Includes Tableau Pulse and one Viewer license for Tableau Cloud.
6. Datapine: Best reporting tool for turning raw data into actionable insights
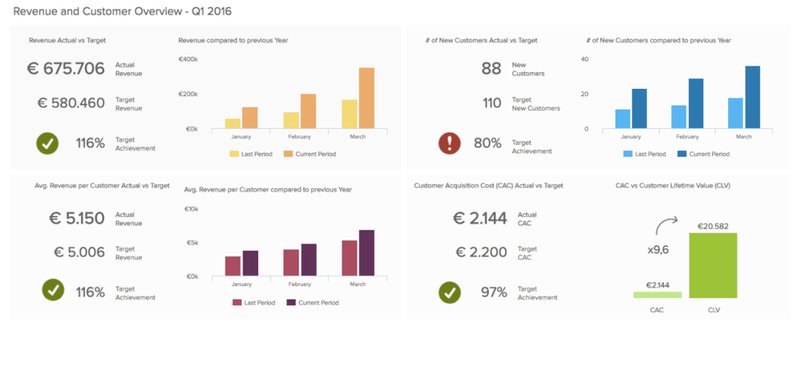
Datapine offers a comprehensive reporting tool for businesses to visualize, monitor, and analyze their most relevant KPIs in one unified location.
Main features
- Advanced Analytics: Provides deep insights into data through advanced analytics capabilities, helping businesses understand complex data patterns.
- Interactive Dashboards: Offers interactive dashboards that make it easy to explore and drill down into data for detailed analysis.
- Intelligent Alarms: Features intelligent alarms that notify users about important changes or milestones in data, ensuring timely reactions to critical insights.
Pricing
- Basic: £199 per month. Offers advanced analytics and custom formulas.
- Professional: £399 per month. Includes all Basic features plus interactive dashboards.
- Premium: £649 per month. Includes all Professional features plus intelligent alarms.
- Branding & Embedded: £899 per month. Includes customizable branding, flexible embedding options, premium features, and embedded dashboards.
7. Whatagraph: Best marketing reporting tool
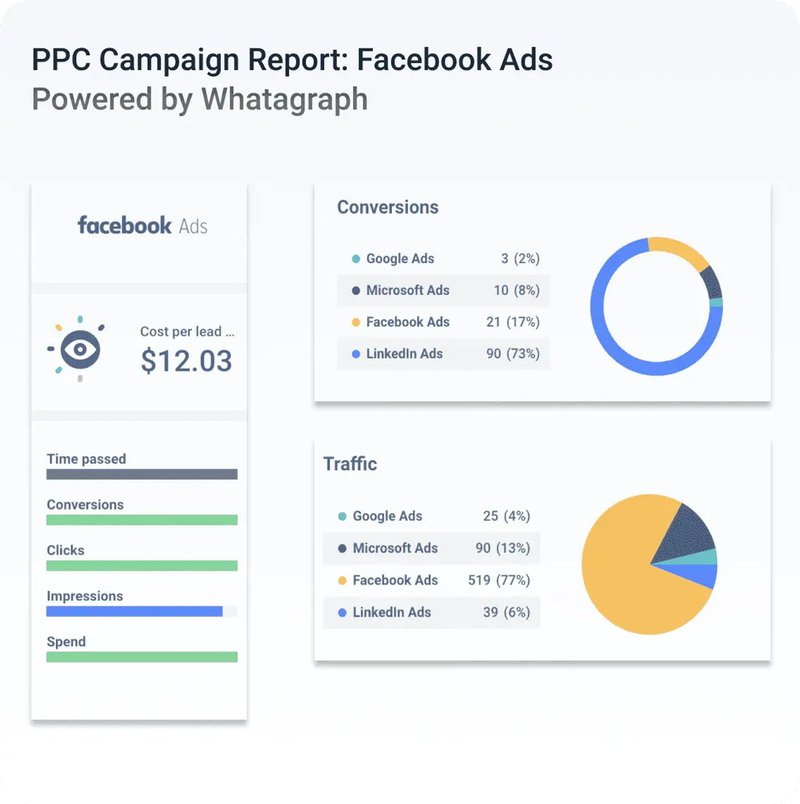
Whatagraph is a premier marketing reporting tool that enables businesses to monitor, measure, and analyze their marketing channel performance.
It simplifies gathering data from various marketing channels into visually appealing, easy-to-understand reports, making it an ideal choice for internal team assessments and client presentations.
Main features
- Cross-Platform Reporting: Allows data aggregation from over 40 integrations into a single report, making it easier to compare the performance of different marketing channels, such as Google Ads and Instagram Ads, on one platform.
- Easy Customization and Reporting Building: Offers a high level of customization, including changes to report colors, fonts, and data sources. A user-friendly interface and drag-and-drop reporting tool enable quick report and dashboard creation.
- Automated Report Delivery: Supports real-time and historical data tracking with automated delivery options to ensure reports are sent out at specified frequencies.
Pricing
- Essential: €219/month (billed annually). Unlimited reports and dashboards, and live chat support.
- Advanced: €439/month (billed annually). Includes 40 source credits, ten users, custom branding, link reports to a template, a customer success manager, and priority support.
- Custom: Offers 120+ source credits, 20 users, and all the benefits of the Essential and Advanced plans, plus customized pricing models and hands-on training.
8. Geckoboard: Best live reporting tool for businesses
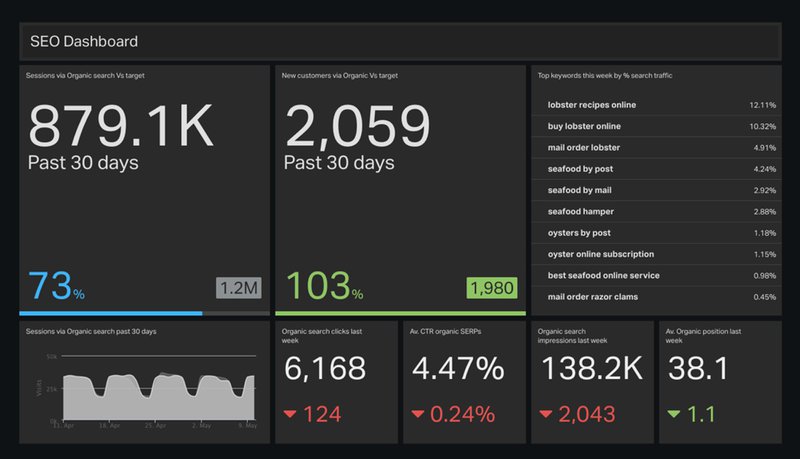
Geckoboard provides a reporting tool that displays live business metrics, KPIs, and goals clearly and engagingly, making it particularly useful for team communication and goal tracking.
Its focus on live data visualization is designed to keep teams informed and aligned with business objectives.
Main features
- Live Metrics Visualization: This enables pulling live metrics from popular business tools into Geckoboard effortlessly, requiring no technical expertise.
- Easy Sharing: Provides quick sharing options for your dashboard via a link, making distributing insights through email or chat easy.
- TV Dashboard Optimization: Geckoboard is optimized for display on office walls, offering a TV dashboard setup that can be built in minutes using a drag-and-drop interface.
Pricing
- Essential: $39/month (billed annually). Core data sources like spreadsheets, Google Analytics, Shopify, and more are included, along with sharing links and dashboard loops.
- Pro: $79/month (billed annually). Expand on Essential by offering connection to over 90 data sources, one dashboard, ten users, and sending to 3 TVs. Pro features include everything in Essential, plus additional pro data sources, Slack integration, custom logo use, and priority support.
- Scale: $559/month (billed annually). Includes 30 dashboards, 25 users, and the ability to send to 10 TVs. Scale adds Single Sign-On (SSO), advanced dashboard theming, and a dedicated support representative.
9. PiktoChart: Best free tool for report visualizations
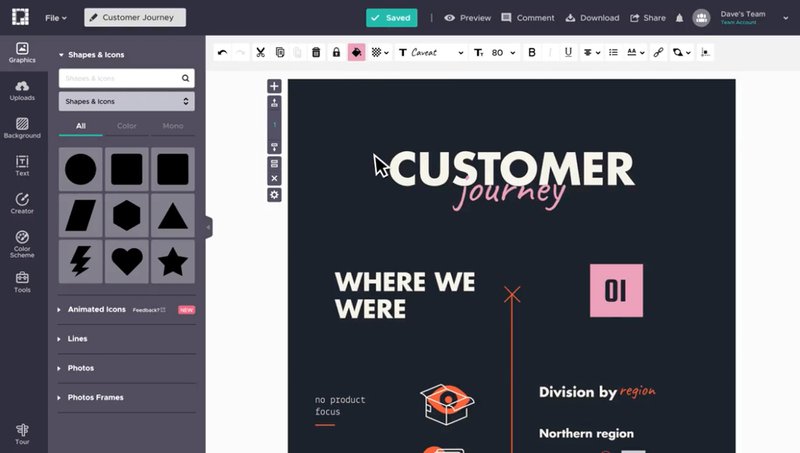
PiktoChart serves a wide audience, including students, teachers, bloggers, and marketers, enabling them to create visually engaging stories, infographics, presentations, flyers, and posters.
It’s known for its user-friendly drag-and-drop interface and rich design features, making complex data storytelling accessible to all.
Main features
- Drag-and-Drop Interface: Simplifies the creation process, allowing users to easily assemble and customize their visuals without needing design experience.
- Design Features: Offers interactive maps, embeddable videos, hyperlinks, and a variety of ready-to-use graphics and templates, along with high-resolution download options.
- Publishing and Sharing: Enables users to share their creations across social media, embed them on websites, or export them to PDF, JPEG, or PNG files for various use cases.
- Access to Assets: Provides free access to templates, icons, and images, with additional features in the pro package, such as custom font uploads and HD image exports.
Pricing
- Free: Offers 100MB storage, two library assets, five visual projects, PNG & PPT downloads, and team collaboration features.
- Pro: Starting at $14 per member/month (billed annually), this plan includes 100GB storage, unlimited visuals and downloads, PDF downloads, and access to over 5 million Pro icons, illustrations, and 3D graphics.
- Business: At $24 per member/month (billed annually), offering 250GB storage, unlimited brand colors, fonts, logos, and up to 300 AI infographic generations per member.
- Enterprise: Custom pricing for teams of 11 or more, focusing on enterprises requiring advanced security, personalized onboarding, dedicated account management, and custom templates.
10. ClickUp: Best reporting tool for KPI dashboards
ClickUp is acclaimed as the world’s highest-rated productivity and project management software, catering to highly productive teams across both small and large organizations.
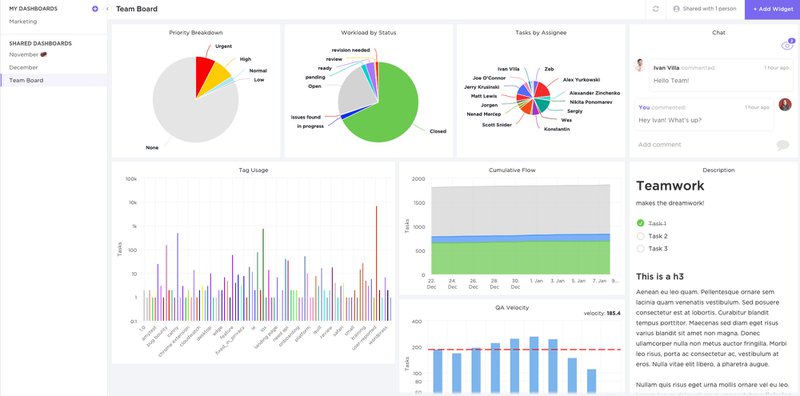
It’s also recognized for its versatile dashboard capabilities, which are designed to accommodate any business scenario easily.
Main features
- KPI Dashboards: Simplifies complex data analysis with KPI dashboards that break down data into understandable graphs and charts, making data more accessible.
- Customizable Dashboards: Offers 50+ widget customizations for insights into critical business analytics, enabling effective monitoring of various business processes.
- Custom Charts: Users can create line charts for trend identification, bar charts for observing changes over time, and pie charts for expense mapping, among other customizations.
- Security and Permissions: Ensures dashboard security by setting permissions, with dashboards being private by default but shareable with team members or displayable in full-screen mode in the office.
Pricing
- Free Forever: Offers 100MB storage, unlimited tasks, unlimited free plan members, and essential project management features at no cost.
- Unlimited: Priced at $7 per monthly member, this plan adds unlimited storage, integrations, dashboards, Gantt charts, custom fields, and more, suited for small teams.
- Business: At $12 per monthly member, designed for mid-sized teams, adding advanced features such as Google SSO, custom exporting, advanced dashboard features, and comprehensive time tracking solutions.
- Enterprise: Tailored for large organizations with custom pricing, offering advanced permissions, conditional logic in forms, enterprise API, white labeling, and dedicated support, among other premium features.
11. InfoCaptor: Best reporting tool for data mining
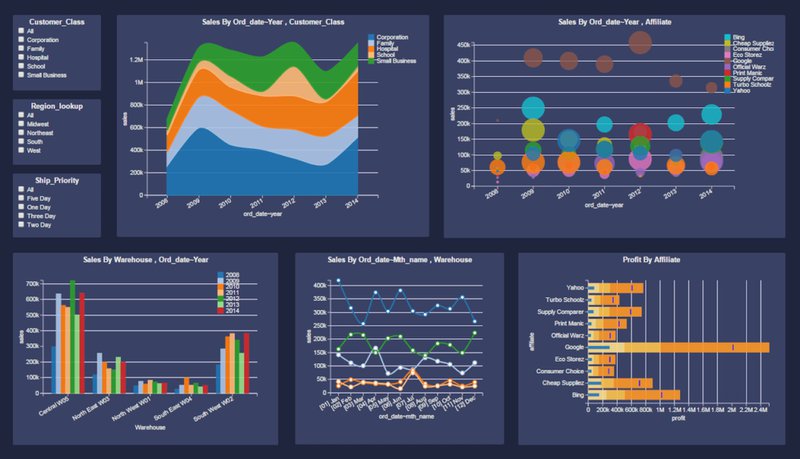
InfoCaptor is designed to facilitate deep dives into data from multiple perspectives, promoting insightful discoveries and “Aha moments” for its users.
It specializes in making data analysis both comprehensive and accessible, with a focus on rapid analytics and ad-hoc visualization.
Main features
- Rapid Analytics: Offers quick and efficient analysis tools to explore data and generate insights swiftly.
- Ad-hoc Visualization: Enables users to create visualizations on the fly, adapting to the needs of different datasets and questions.
- Security and Data Governance: Ensures data integrity and security, implementing governance policies to manage data access and compliance.
- Embeddable Dashboards: Unique feature allowing users to embed dashboards or individual widgets directly onto any web page, enhancing accessibility and integration.
Pricing
Priced at $39 per month, the package includes a Visual Analyzer, support for Excel and CSV data, compatibility with all SQL databases, and unlimited dashboards.
12. HandyKPI: Best reporting tool for mobile KPI control
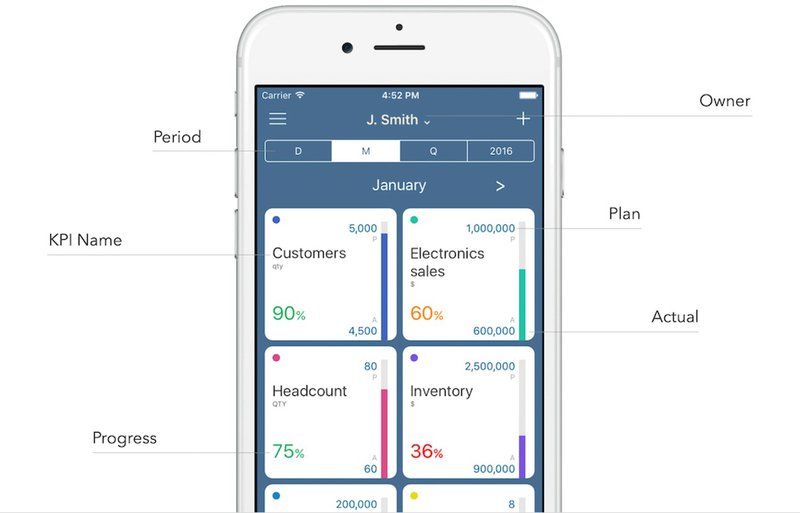
HandyKPI aims to make business and team performance tracking as accessible as possible by leveraging mobile technology. It focuses on providing key performance indicators (KPIs) at your fingertips, offering a comprehensive mobile app for real-time performance monitoring.
Main features
- Mobile KPI Control: Enables the monitoring and control of business KPIs directly from a mobile app, ensuring that critical data is always within reach.
- Quick KPI Delivery: Allows for the swift collection and distribution of KPIs among team members, facilitating efficient communication and data sharing.
- Software Integration: Provides integration capabilities with existing software systems, ensuring seamless data flow and consolidation.
Pricing
- Start: Free plan for teams of up to 3 people, offering unlimited KPIs.
- Business: Priced at $5 per user/month for teams of 4 people and more, this plan also offers unlimited KPIs with subscription options for 1, 3, 6, or 12 months. A 30-day free trial is available with unlimited users, requiring no credit card for initiation.
Conclusion
The great thing about dashboard reporting tools is that they have many other features from which you can benefit. So, you can consider the best reporting tool for you with this in mind.
If you’re looking for a dashboard reporting tool to help display your key product information and many other benefits, see how Userpilot can help you by booking a demo now.


![What are Release Notes? Definition, Best Practices & Examples [+ Release Note Template] cover](https://blog-static.userpilot.com/blog/wp-content/uploads/2026/02/what-are-release-notes-definition-best-practices-examples-release-note-template_1b727da8d60969c39acdb09f617eb616_2000-1024x670.png)
