Mixpanel Reviews: Honest Assessment of Features, Pricing & Alternatives


Mixpanel gives product teams a level of behavioral clarity that its users have come to rely upon. You can see exactly where users drop off in an onboarding flow, which features correlate with 90-day retention, and how behavior differs across cohorts, all without writing a single SQL query.
But to give you a complete picture of the tool, I went through verified Mixpanel reviews on G2, analyzed the current pricing structure, and compared Mixpanel against the alternatives product teams evaluate most often.
What is Mixpanel?
Mixpanel is a product analytics platform built around a single core idea: tracking what users do, not just where they go. It captures specific actions like signing up for an account, completing a tutorial, or making a purchase, then surfaces patterns in engagement and behavior from that data.
The platform is built around an event collection-based model, which means every meaningful interaction can be captured and analyzed.
This approach gives product teams the granular data they need to answer questions like “Which features drive retention?” or “Where do users drop off during onboarding?”
Companies ranging from early-stage startups to established enterprises use Mixpanel to make data-driven decisions about product development, user experience optimization, and growth strategies. It’s particularly valuable for SaaS businesses, mobile apps, and any product-led organization that needs to understand the relationship between user actions and business outcomes.
Mixpanel features and capabilities
Mixpanel combines flexible event collection with powerful analysis capabilities, enabling product teams to track any user action and derive meaningful insights from that data.
Event collection to track user behavior
Its flexible event tracking system allows teams to define and track nearly any user interaction within their product.
The emphasis on custom events allows you to tailor your data collection to your specific product and business goals, not limited to predefined metrics.
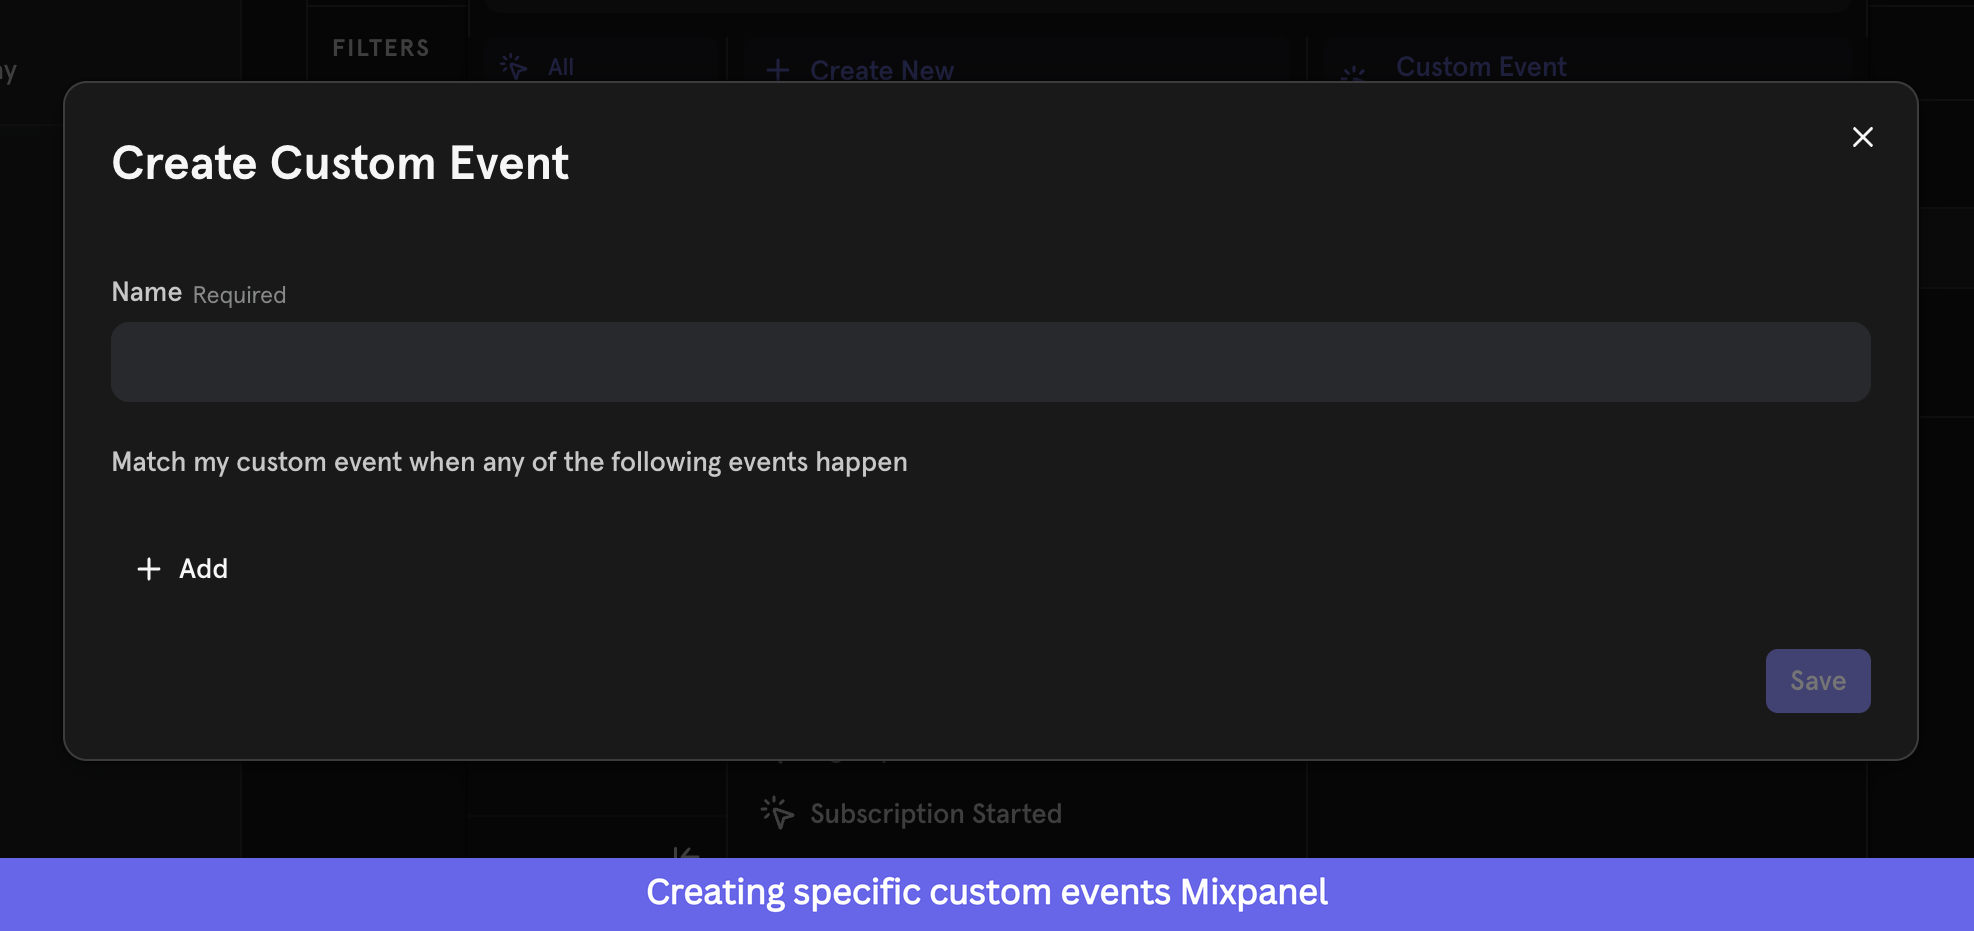
Say you’re tracking a “First Transaction” event for your SaaS product. After a thorough analysis of user behavior data, you find that the ones who complete their first transaction within the first 24 hours show a 3x higher retention rate than those who don’t.
With this single insight, your entire onboarding strategy can go from optimizing your welcome email, to subtly pushing users toward their first transaction.
Apart from custom events, Mixpanel also supports autocaptured events, which automatically log basic interactions like button clicks, form submissions, or page views without any extra setup.
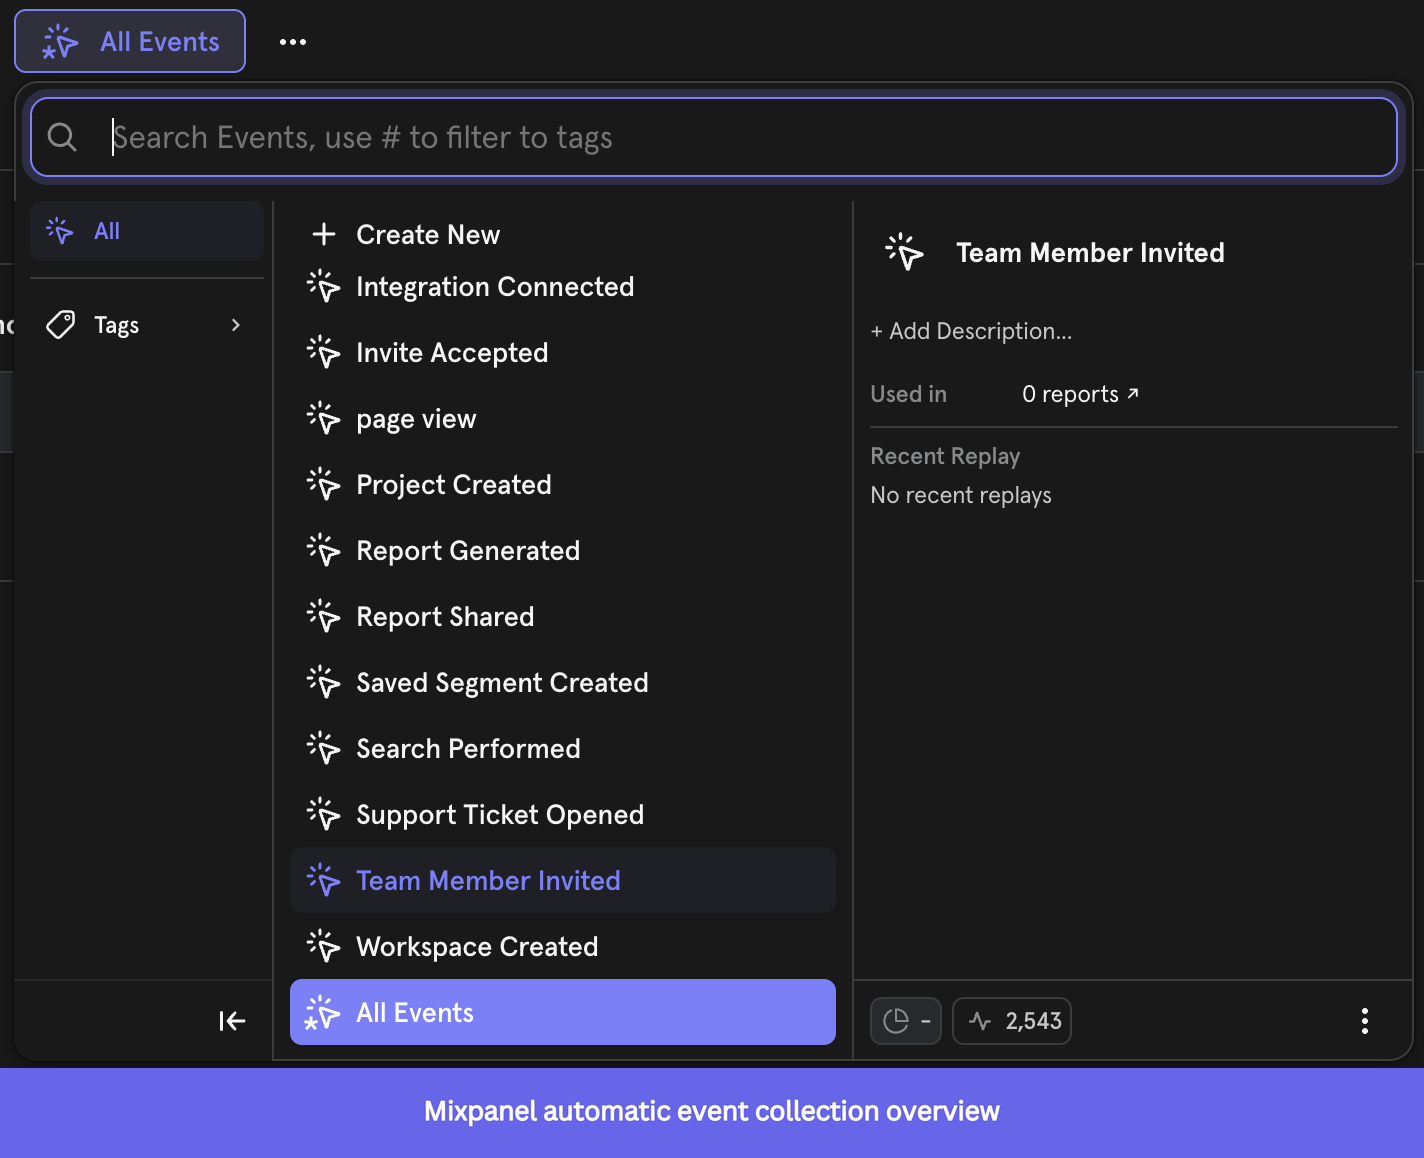
For example, if I’m tracking a new feature launch, I’d want to know not just how many people saw the feature, but how many clicked on it, completed a specific task using it, or returned to it later.
Advanced analytics and reporting to understand user behavior
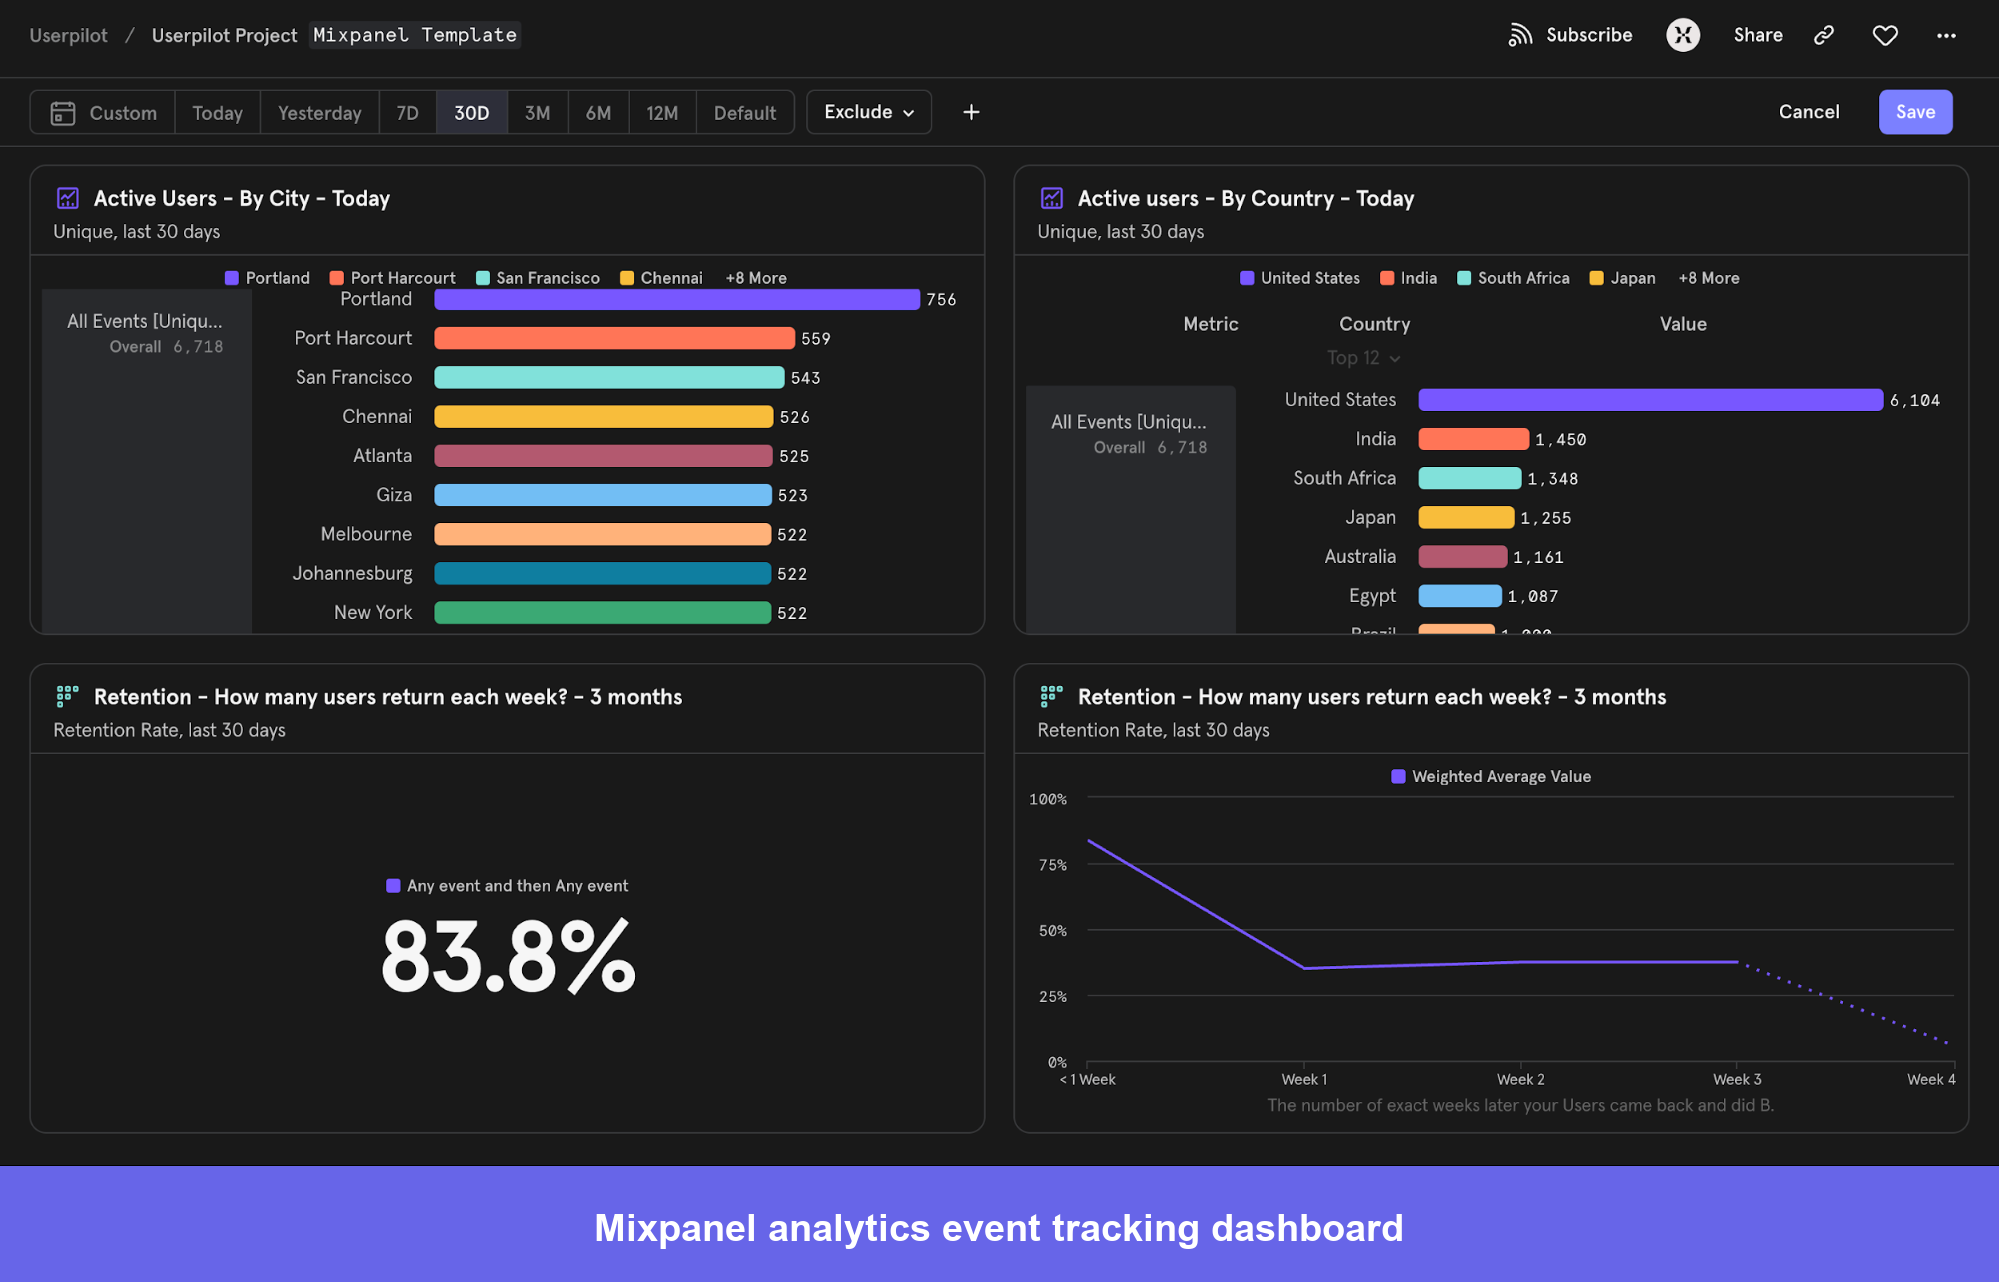
Mixpanel offers several reports that help product and marketing teams slice and dice their data:
- Insights reports: These are your go-to for basic event analysis, trends, breakdowns, and comparisons over time. You can segment data by various properties, which is invaluable for understanding different customer segments. If a feature sees high adoption overall but near-zero usage among trial users, Insights surfaces that gap instantly so you know exactly where to focus your upgrade messaging.
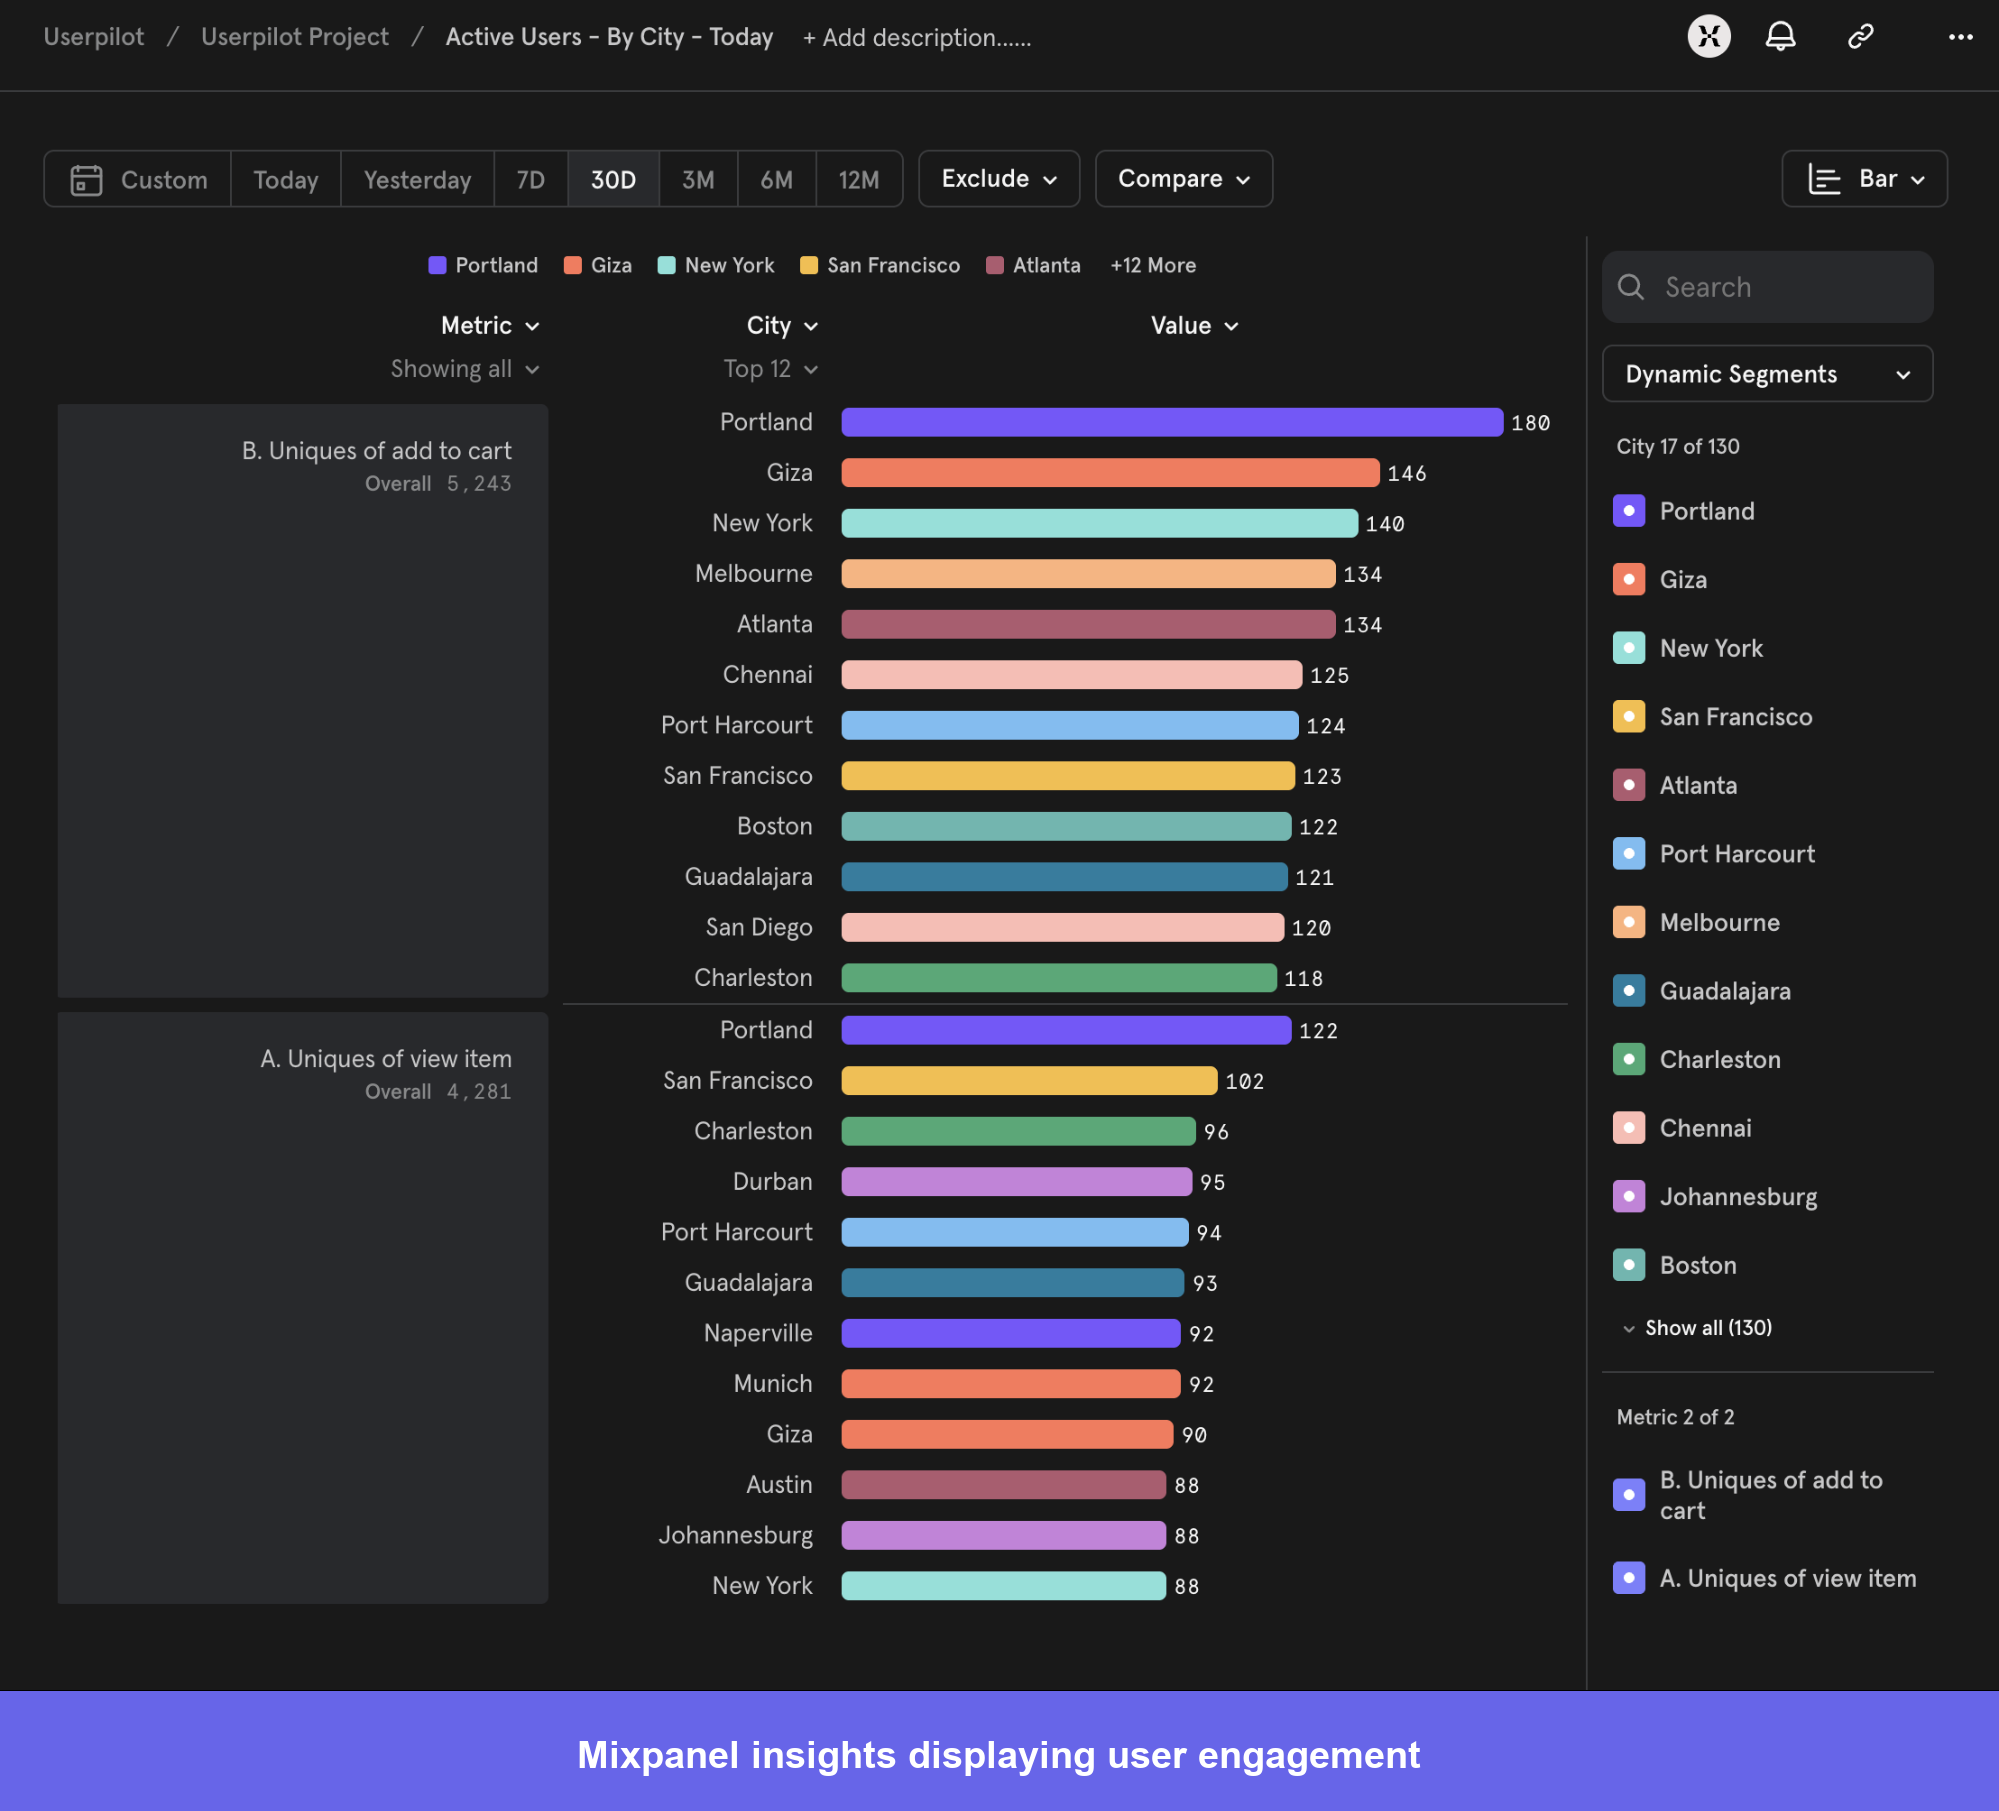
- Funnels: Mixpanel’s funnel analysis helps visualize user journeys and identify where users drop off in critical processes like signup or onboarding.
- Retention analysis: Mixpanel offers cohort-based retention tracking, showing how user engagement changes over time.
- Flows: While not as robust as a dedicated user journey mapping tool, Mixpanel’s flow reports visually represent common user paths through your application.
- Session replay: A newer addition, Mixpanel’s session replay allows you to watch actual user interactions. This qualitative data is useful for spotting user friction and validating hypotheses from your quantitative data.
- Feature Flags: You can roll out updates to selected segments and test results safely.
- Experiments in Mixpanel: Lets you measure A/B or multivariate test results to see what drives conversions and optimize for better outcomes.
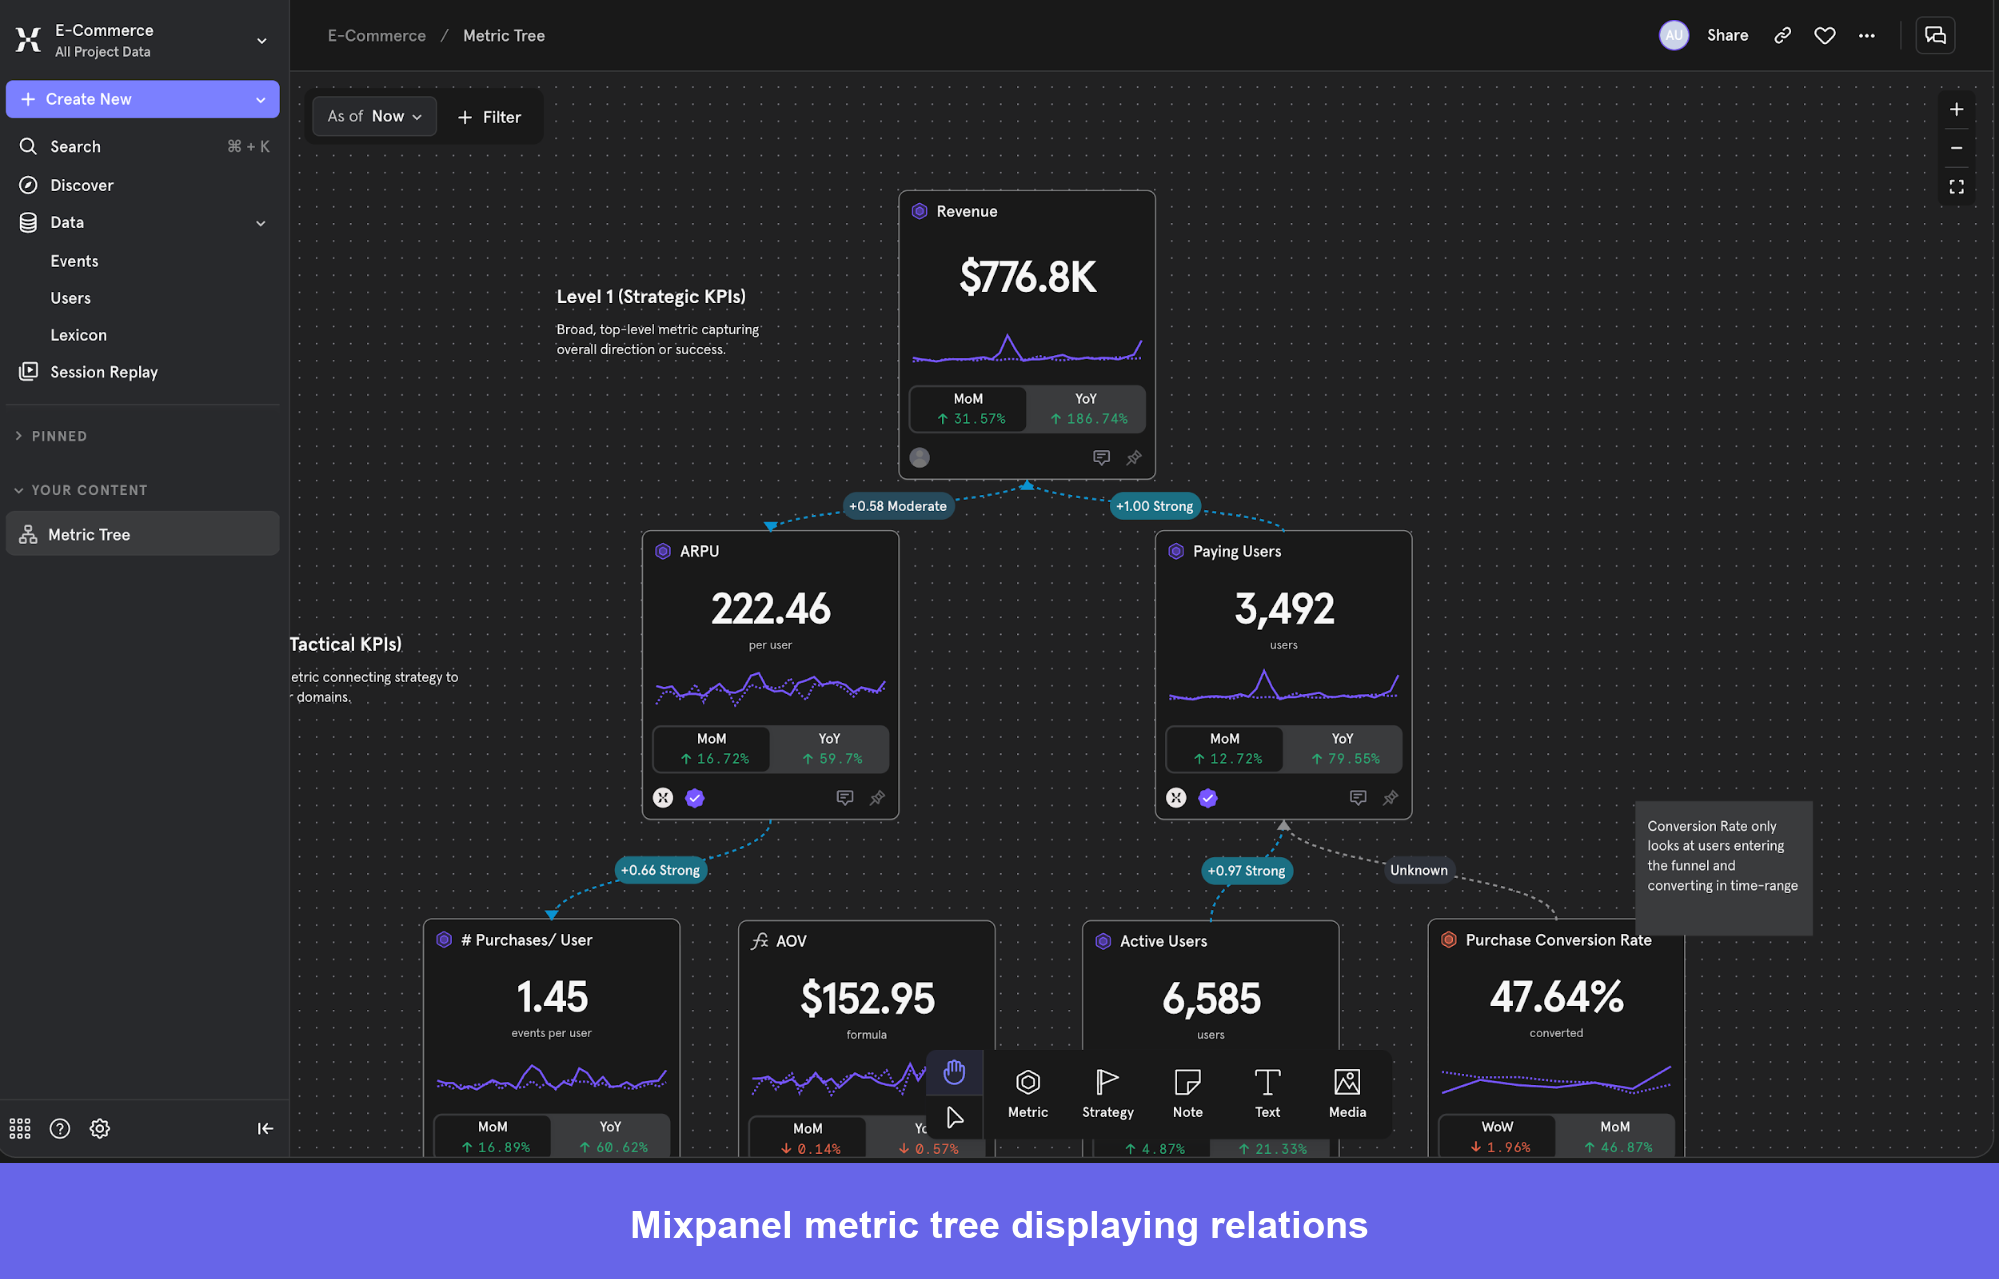
- Metric Trees: Helps you break down high-level KPIs into smaller, contributing factors so you can determine what’s really driving results.
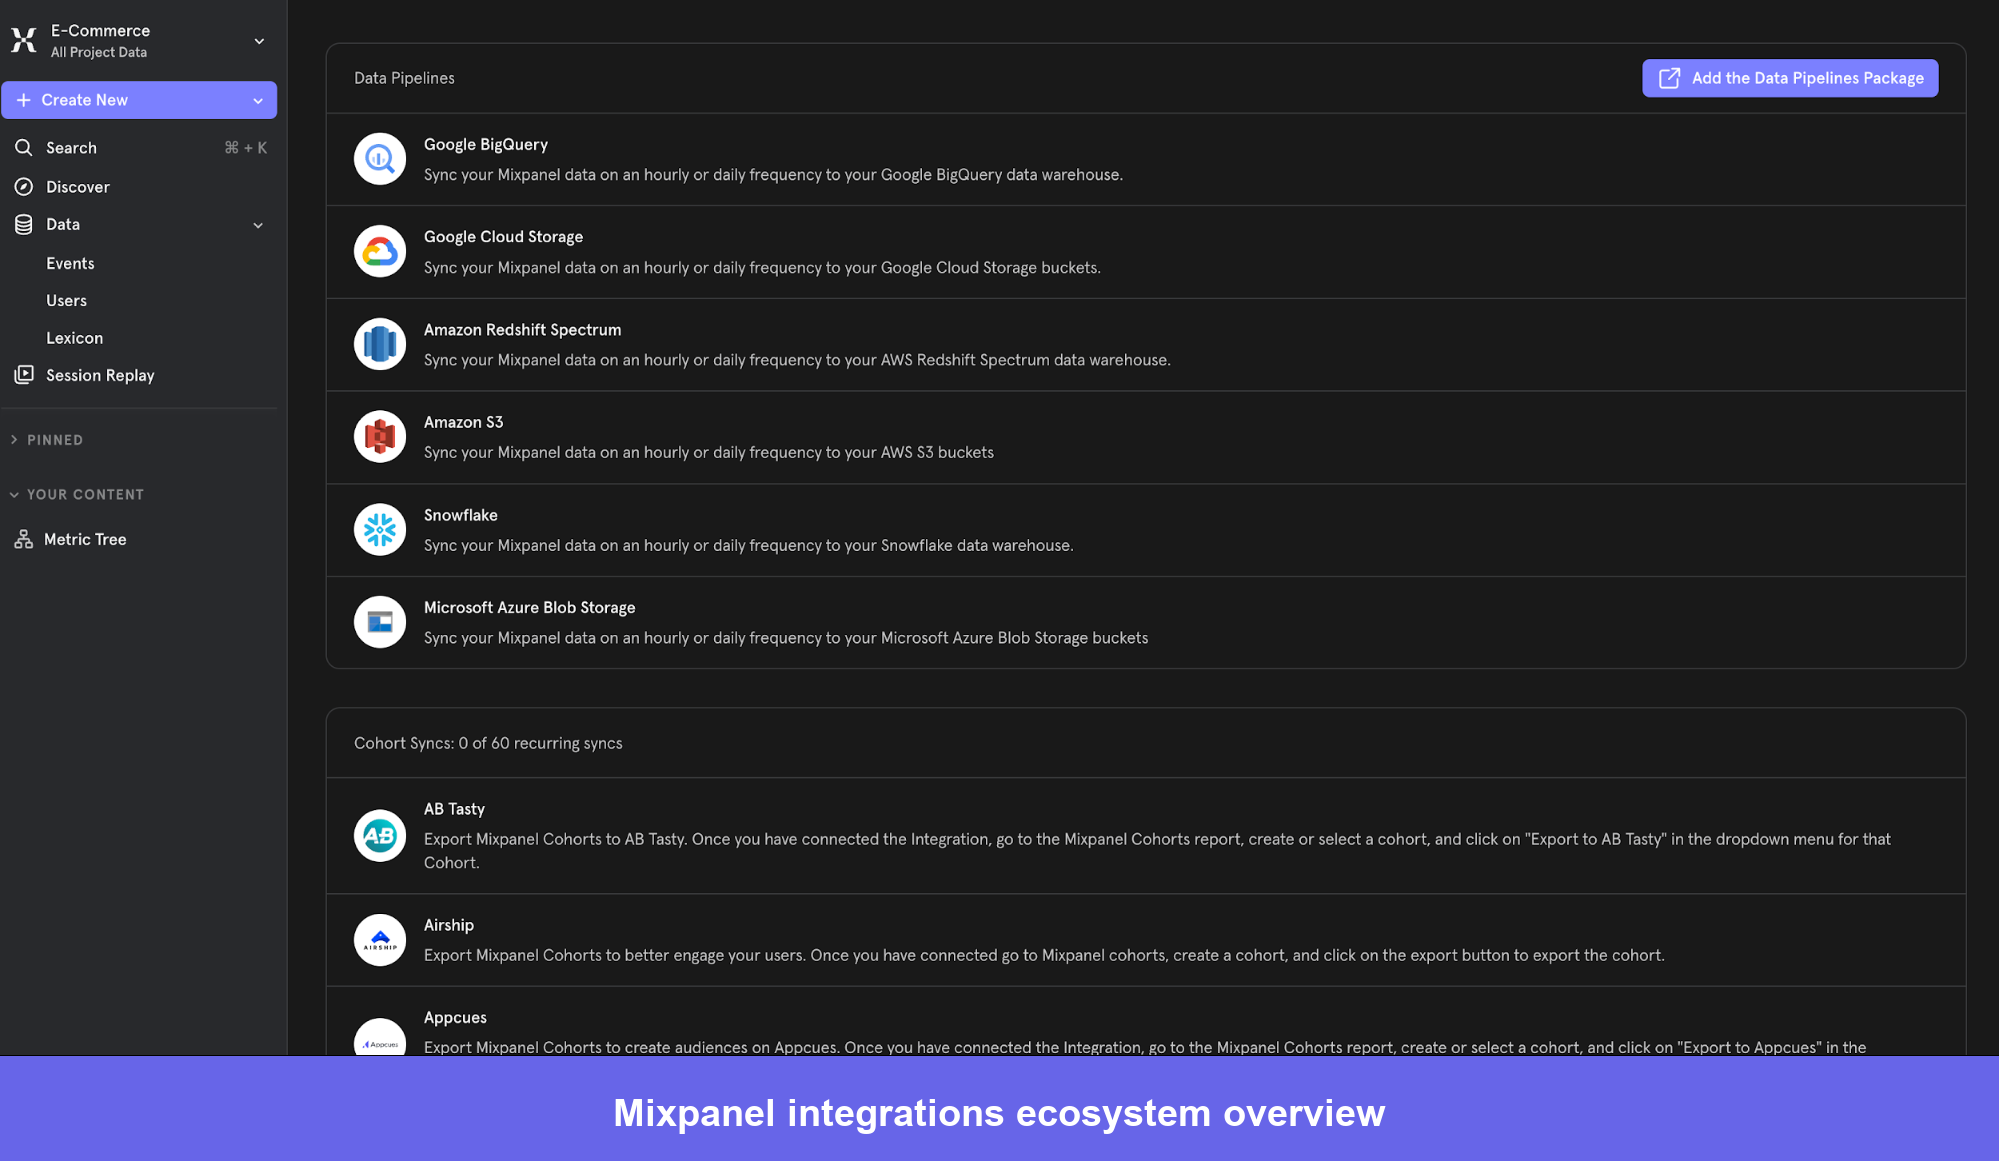
Integration ecosystem for detailed insights
Mixpanel integrates with many popular tools, including CRM systems like Salesforce and HubSpot, marketing automation platforms, and data warehouses. This helps create a more unified view of the customer journey, though the depth of integration can vary.
Here’s a look at Mixpanel’s 40-plus connectors that tie it into nearly every major platform your team already uses:
- CRM tools like Salesforce, HubSpot, and Sales Hub.
- Data warehouses and databases such as Snowflake, Google BigQuery, and Supabase.
- Analytics and monitoring tools, including Google Analytics, Microsoft Clarity, and FullStory.
- Marketing automation platforms like Braze, Iterable, and Customer.io.
- Development and deployment tools such as LaunchDarkly, Python, and Sentry.
- E-commerce and CMS systems like Shopify Plus, WooCommerce, and WordPress.
But what do actual users think of Mixpanel? The next section summarizes Mixpanel reviews and highlights the platform’s strengths and weaknesses based on real-world experiences.
Mixpanel reviews: What users are saying
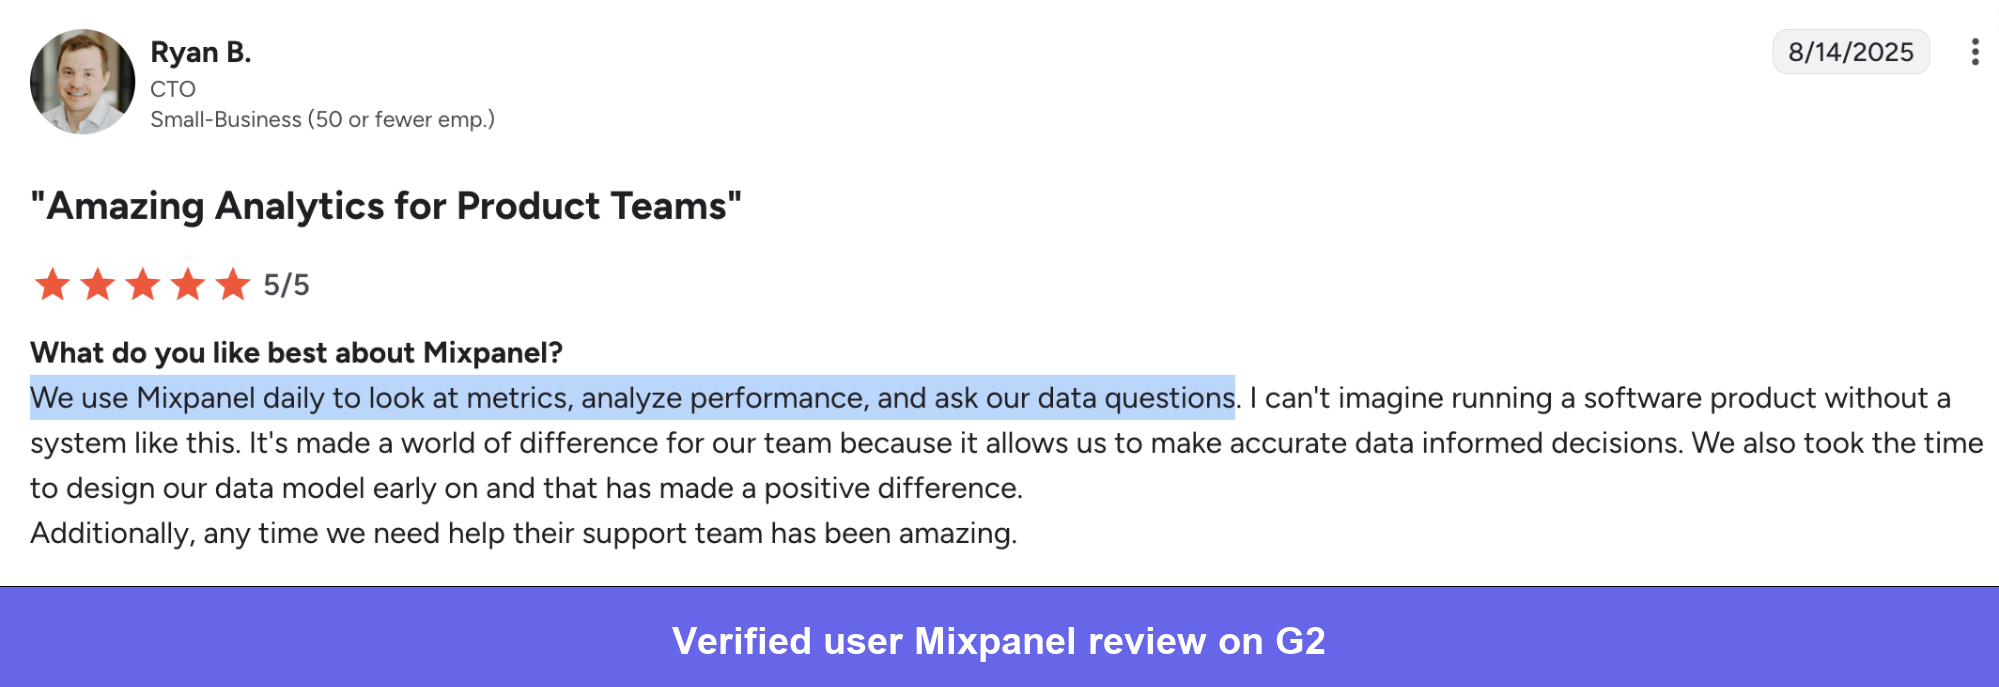
Teams that invest in a clean event schema and learn the reporting layer tend to rate Mixpanel highly. The platform has a 4.5/5 rating on G2, but dig into the comments, and you’ll see people repeat a similar experience, stating that Mixpanel is a powerful tool.
One CTO noted that their team uses Mixpanel daily to examine metrics, analyze performance, and interrogate their data, describing it as essential infrastructure for running a software product.
The behavioral analytics capabilities stand out in user reviews.
Product teams use cohorts, user flows, and funnels to identify bottlenecks in critical processes such as signup, onboarding, and purchase paths. The platform’s real-time nature also earns consistent praise, as users value the ability to process queries quickly and to focus on analysis rather than waiting for data to load.
From digging through recent reviews on G2, I noticed a few themes popping up. Overall, users love what Mixpanel can do. They see it as a powerful tool that enables teams to turn data into insightful, data-driven decisions. But they also say that it can feel harder than other tools to implement and master.
To provide a balanced perspective, let’s delve into the specific pros and cons of using Mixpanel, as highlighted by its users.
What users like
- Dashboards + reporting: Teams say they can create boards and charts quickly and give stakeholders easy access to the most relevant metrics. This helps marketing and product teams make informed decisions faster. One user says:
“What I like most about Mixpanel is how clearly it shows user activity. I can see what users are doing step by step, like where they click, where they stop, and what features they actually use. It helps me understand real behavior instead of guessing. I also like that once things are set up, the dashboard updates on its own, so I don’t need to check data manually again and again. The charts are easy to read even for someone who is not a data expert.” – Hardik B., Full Stack Developer
- Behavioral analytics for real questions: Teams like Mixpanel’s cohorts, user flows, and funnels to identify bottlenecks in signup, onboarding, and purchase journeys on both website and app. Here’s a review:
“MixPanel stands out for its unique blend of simplicity and power. Whenever we want to uncover new insights from our user data, MixPanel makes the process straightforward and allows us to quickly analyze and break down the data to discover patterns that might otherwise go unnoticed.” – Gordon P., VP Product
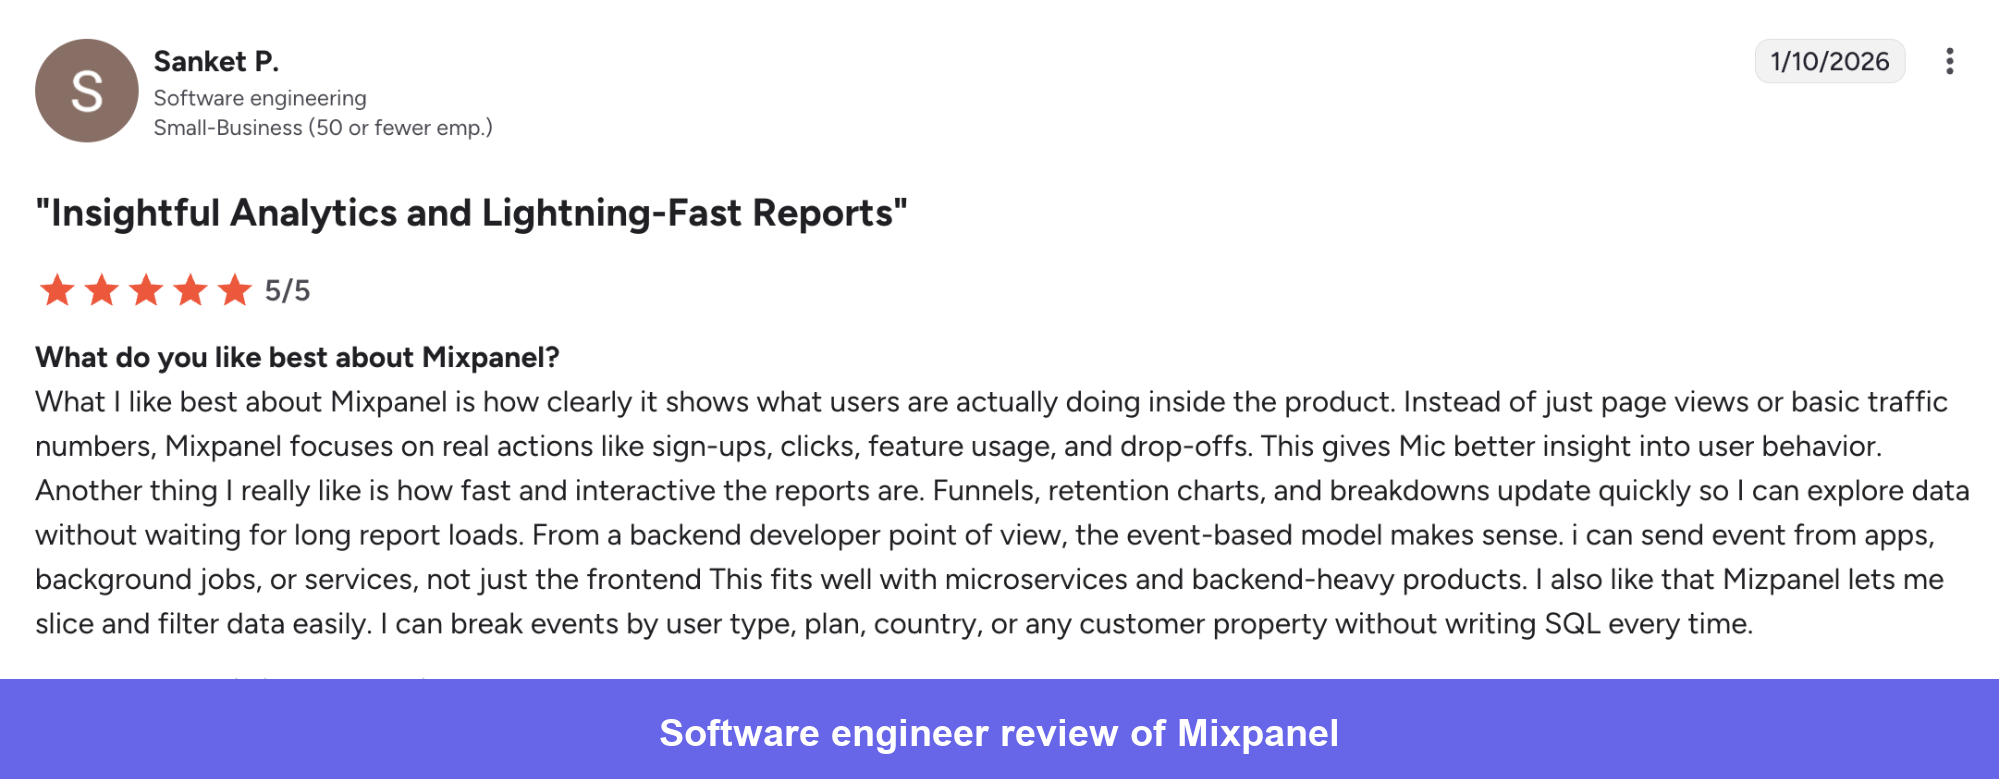
- Real-time insights and responsive UI: Many users love how fast Mixpanel feels in day-to-day use. One user observed:
“I really like is how fast and interactive the reports are. Funnels, retention charts, and breakdowns update quickly so I can explore data without waiting for long report loads. ” – Sanket P., Software engineering
What users want improved
- Users say that Mixpanel’s advanced setup takes time and planning. Plus, you need a clear event schema to achieve clean analysis later. One reviewer says:
“There is a little bit of a learning curve until you understand how to use some of the filtering/breakdown features..” – David P., Software Engineer
- Implementation & data management: A few users cite delays and identity/profile quirks. You’ll want tight governance to determine accuracy across devices and sessions. One of the users said:
“You have to be really strict with how you name events in your code. If you aren’t careful, the data gets messy and hard to read.” – Manu Y., Full Stack Developer
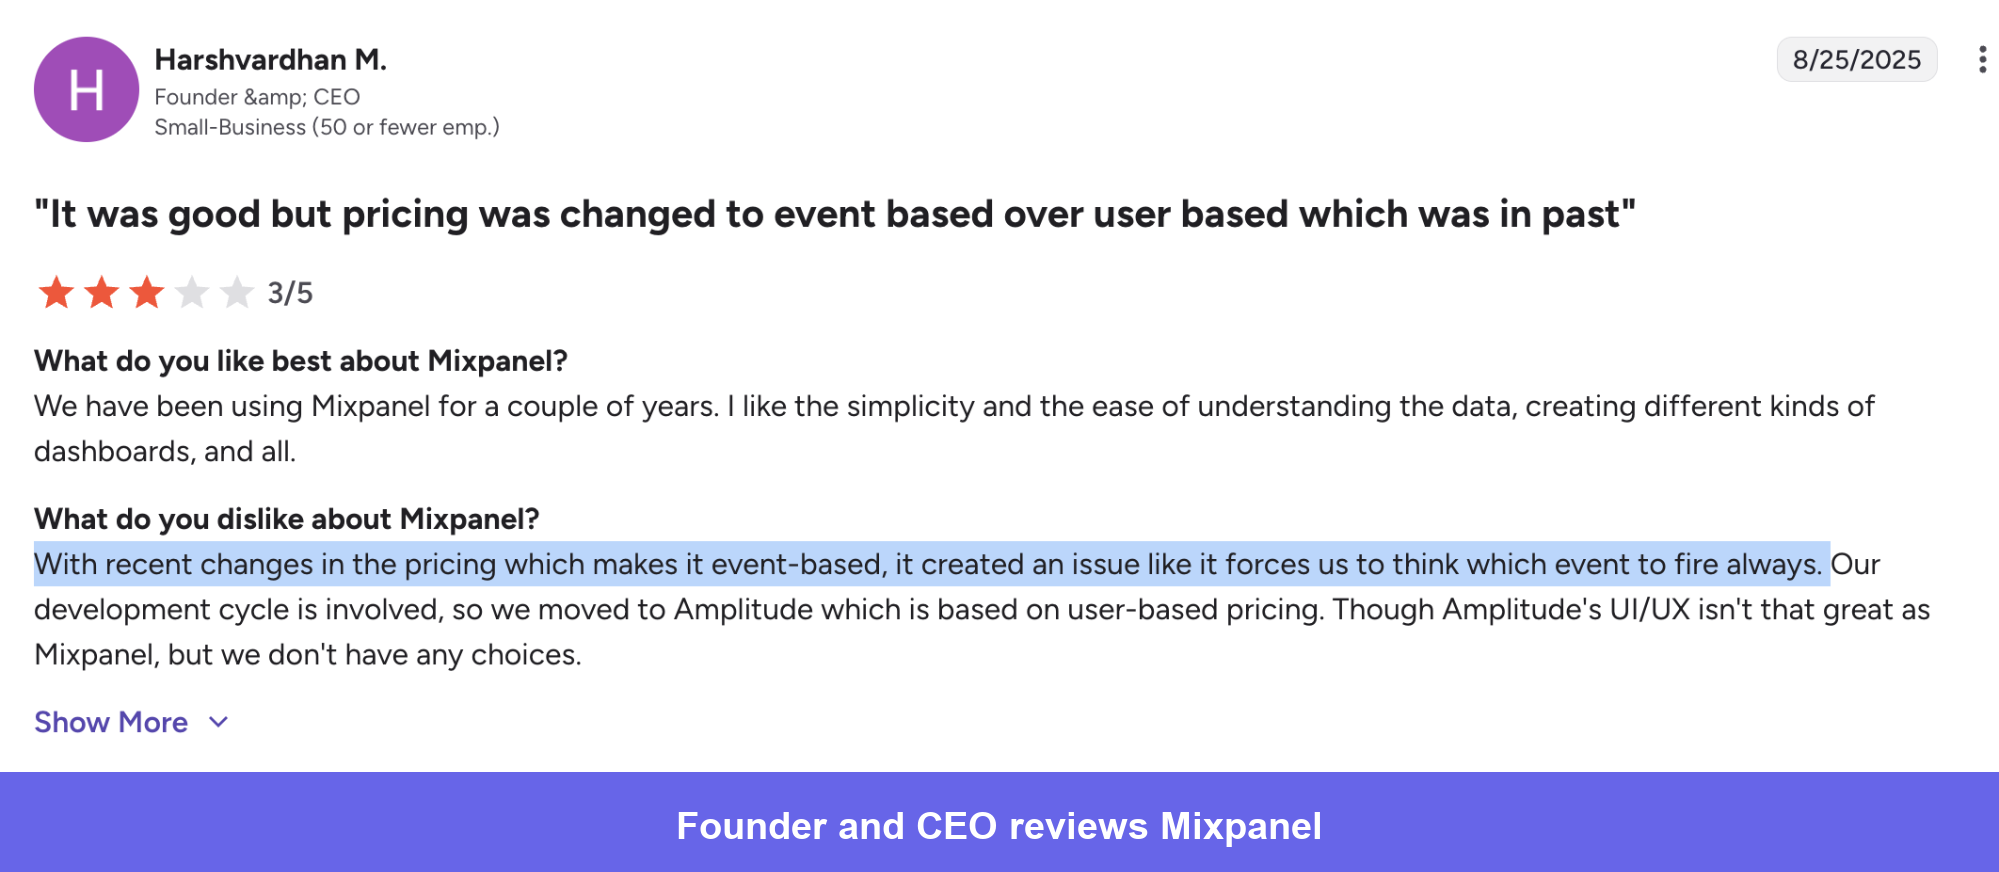
- Mixpanel pricing changes: Some mention past shifts to event-based pricing, creating anxiety about volume. Here’s a recent review:
“With recent changes in the pricing which makes it event-based, it created an issue like it forces us to think which event to fire always.” – Harshvardhan M., Founder & CEO
Pros of Mixpanel
- Dashboards and reporting: Teams can build charts quickly and share the most relevant metrics with stakeholders without SQL knowledge. The auto-refreshing dashboards mean less time spent manually pulling data.
- Feature Flags and Experiments: Powerful for controlled rollouts and A/B testing, though interpreting results requires a solid handle on data analysis. Teams not on Enterprise plans can analyze results but cannot run full experiments within the platform.
- Scalability: Mixpanel handles large data volumes well, making it a reasonable choice for growing companies that need analytics infrastructure to scale with their user base.
- Mixpanel analytics: What really stands out for me (and many users) is Mixpanel’s Feature Flags and Experiments. It’s powerful, but I’ll be honest: interpreting those results isn’t always straightforward. If you don’t already have a strong handle on data analysis, it can feel a bit complex to make sense of it all. Plus, unless you are on expensive Enterprise plans, they only help you get half of the job done, which is analyzing results, not actually running experiments.
- Near-real-time processing: Mixpanel enables you to track and query data very shortly after it is generated (often within seconds to a minute). This means your team can react quickly to changes in user behavior or the impact of new releases.
- Scalability: Mixpanel handles large volumes of data well, making it suitable for growing companies.
Cons of Mixpanel
- Implementation complexity: Setting up comprehensive tracking requires significant technical effort. For teams without dedicated data engineers, getting the most out of Mixpanel can be a real challenge, and a poorly designed event schema creates data quality problems that compound over time.
- Learning curve: New users frequently find the breadth of options overwhelming. Effective use often requires training and a solid understanding of analytical concepts, which creates a barrier for teams expecting a plug-and-play solution.
- Cost at scale: Mixpanel’s pricing is event-based and can become expensive for products with high engagement volumes, and past pricing structure changes have created uncertainty for some customers. Careful event planning is not optional.
- Data management friction: Excluding test users from production reports or removing unnecessary historical data is more cumbersome than it should be.
- No in-app engagement layer: Mixpanel tells you what users are doing and why, but it doesn’t give you the tools to act on those insights directly in-app. You’d need separate tools for in-app guidance or customer feedback collection.
Mixpanel pricing breakdown
Mixpanel structures its pricing around event volume and offers three main tiers to accommodate businesses at different stages of growth. You need to understand how these tiers work to accurately forecast costs as your product scales.

- Free: With the free forever plan, you can track up to 1 million events per month. That’s a solid deal for startups or small teams who want to explore product analytics before committing to a paid plan. It includes all the core analytics features.
- Growth: Once you cross that free threshold, you’ll move into Mixpanel’s paid tier. The first million events stay free. After that, you’re billed per event (around $0.28 per 1k additional events). The plan unlocks more flexibility and advanced analytics, but costs can scale quickly if your usage grows faster than expected.
- Enterprise: This tier is for when you need custom pricing to accommodate a large number of monthly events. It offers unlimited tracking and premium features like data governance and dedicated support. This is for large organizations with complex needs and deeper pockets.
From my experience, the “value” part of the pricing depends entirely on your usage patterns. If your product has relatively consistent, high-value events, the event-based model can be quite fair.
However, if you track a lot of low-value interactions, or if your user base grows fast, costs can jump rapidly. This makes a clear data tracking plan essential to avoid unexpected bills.
When comparing product analytics platforms, Mixpanel often goes head-to-head with Amplitude. The next section provides a detailed comparison of these two leading tools.
Mixpanel alternatives worth considering
While Mixpanel offers robust analytics capabilities, there are several alternative platforms that provide different approaches to understanding user behavior and product performance. These options help ensure you select the tool that best matches your team’s technical capabilities, budget constraints, and analytical requirements.
Here’s a quick comparison of how the Mixpanel alternatives stack up:
| Tool | G2 Rating | Starting Price | Key Strength | Best For |
|---|---|---|---|---|
| Amplitude | 4.5/5 | Free tier available. Growth from ~$49/mo | Predictive analytics and cohort depth | Teams prioritizing forecasting and experimentation |
| Google Analytics 4 | 4.5/5 | Free | Google ecosystem integration | Teams with basic analytics needs or tight budgets |
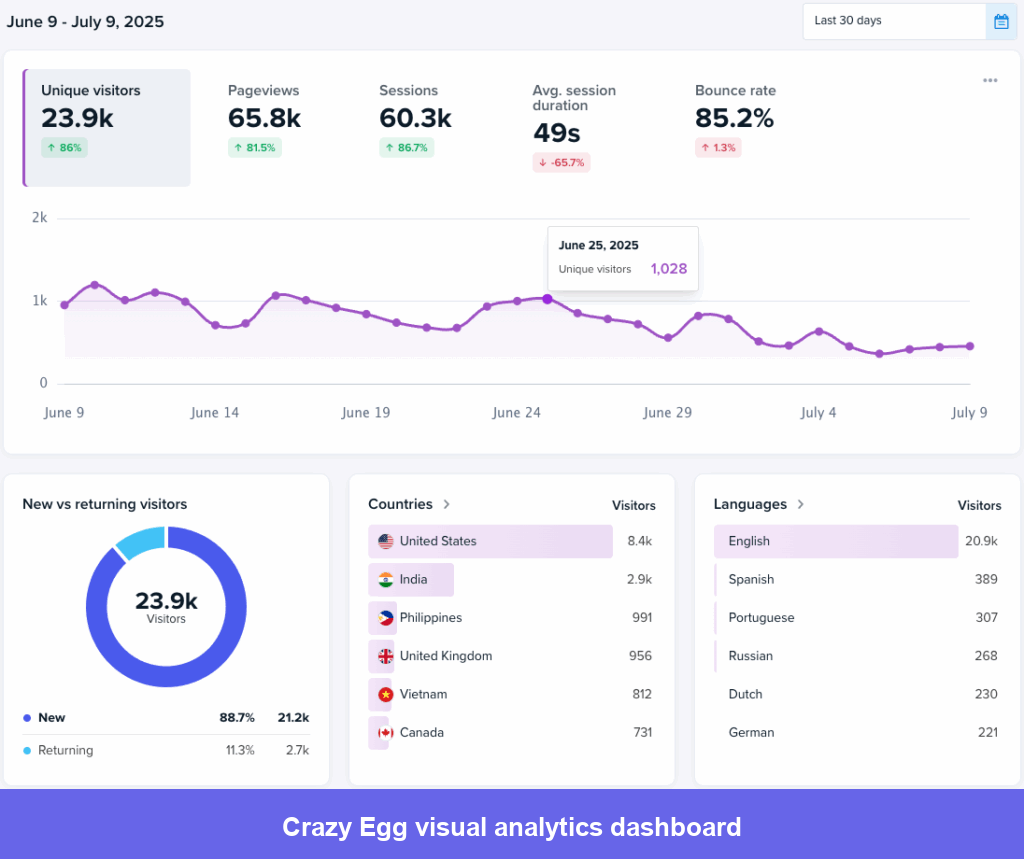
| Crazy Egg | 4.2/5 | From $29/mo | Visual heatmaps and scroll maps | UX teams focused on page-level behavior |
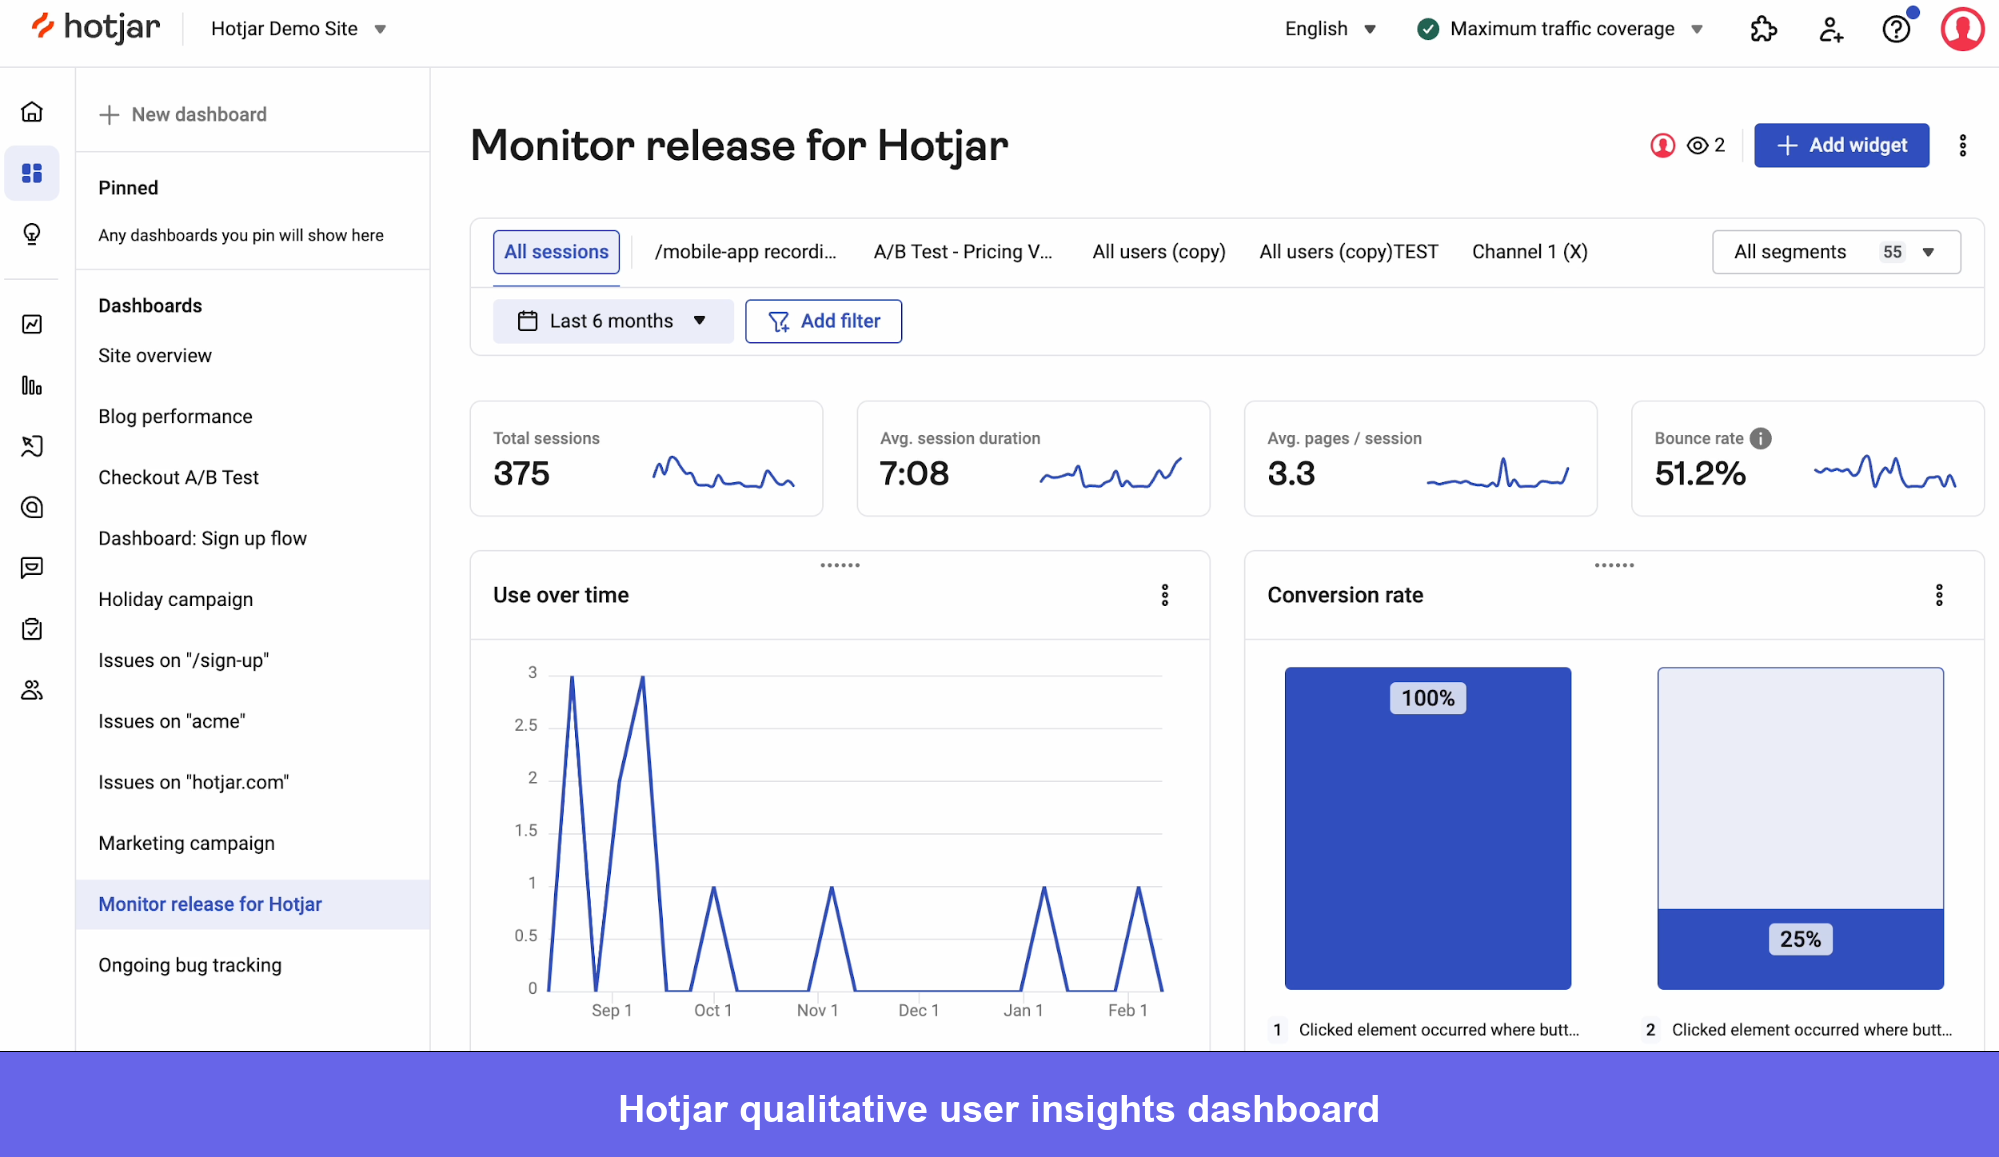
| Hotjar | 4.3/5 | Free tier. Scale from $99/mo | Qualitative insights and session recordings | Teams combining behavioral data with user feedback |
| Userpilot | 4.6/5 | From $299/mo | Analytics + no-code in-app engagement | Product teams that want to analyze and act without extra tools |
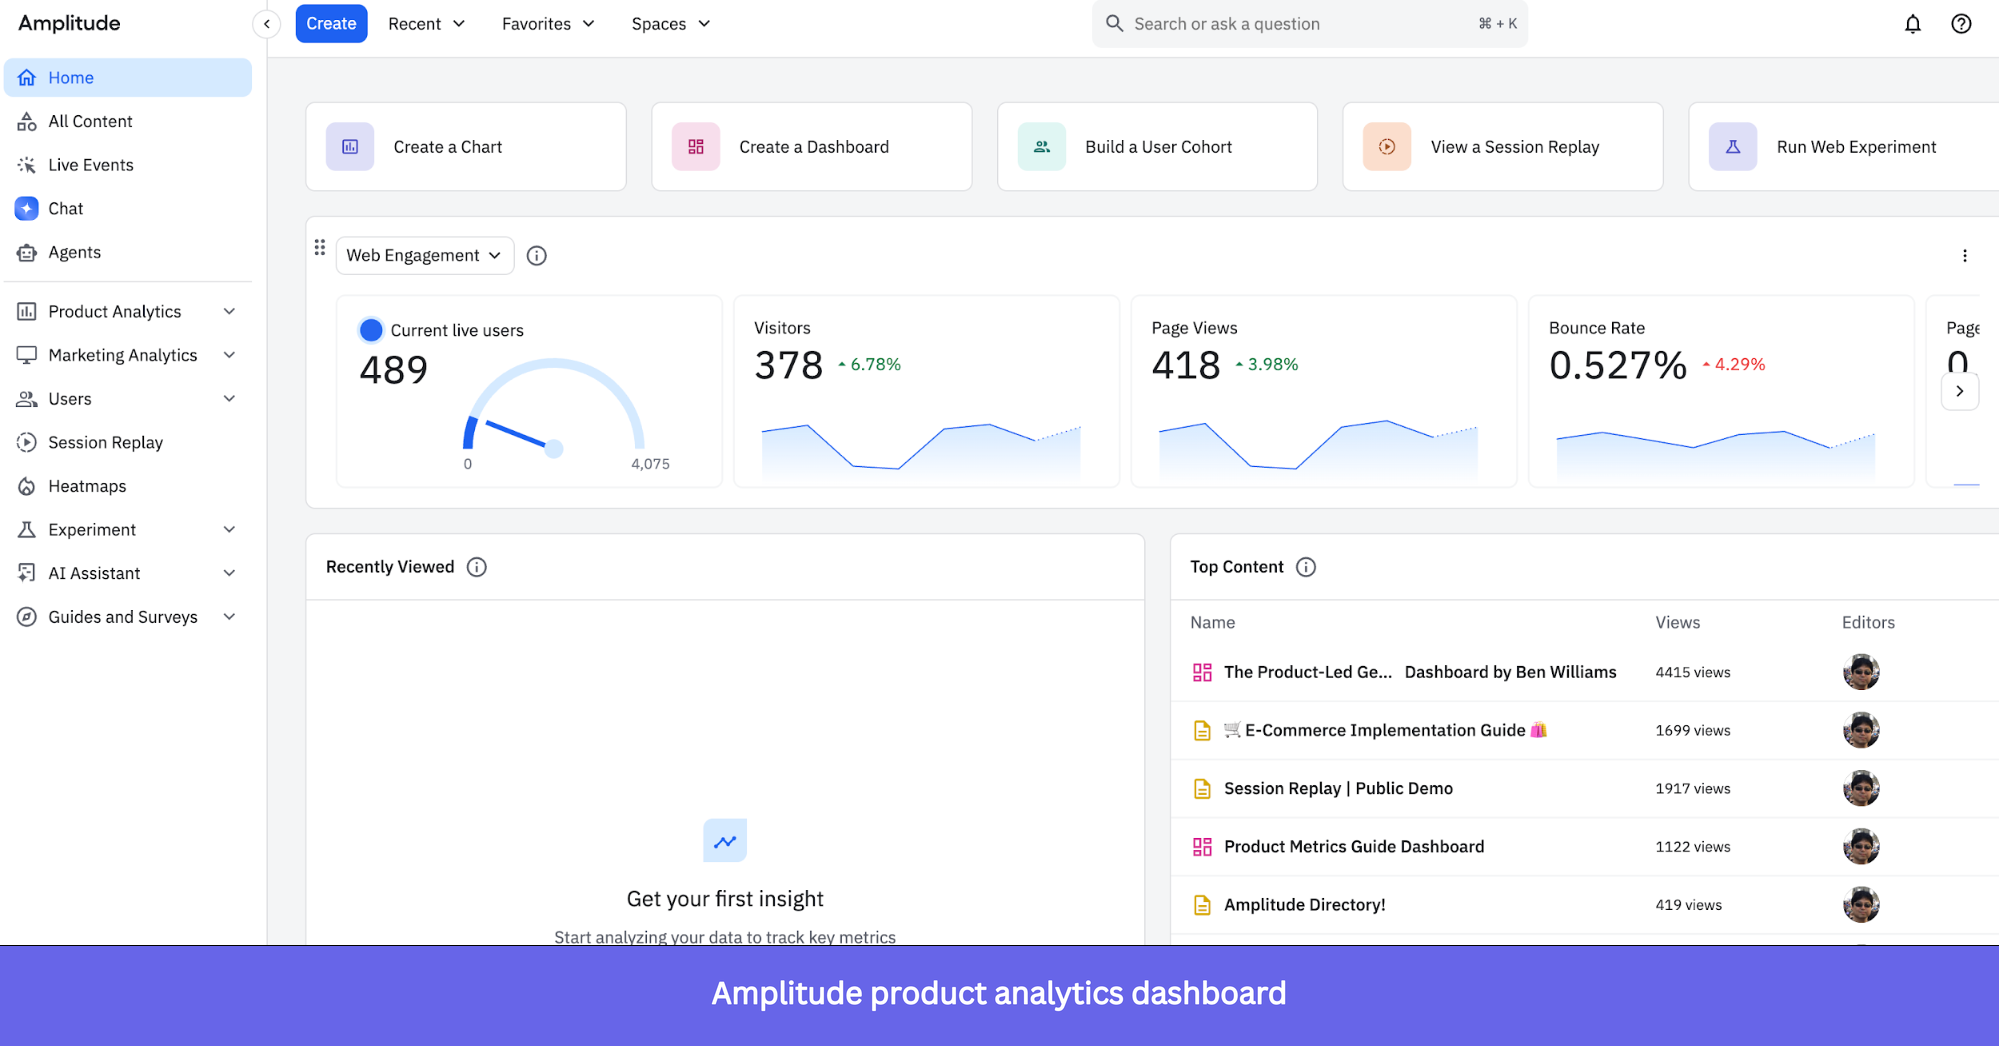
Amplitude
Amplitude is Mixpanel’s closest competitor in the pure product analytics space. It offers similar event tracking and behavioral analysis capabilities, with particular strength in predictive analytics and cohort analysis.
Amplitude’s approach to pricing is about offering both event-based and user-based models. This model provides more flexibility for some organizations. Teams that prioritize forecasting future user behavior based on historical patterns often find Amplitude’s predictive features compelling.
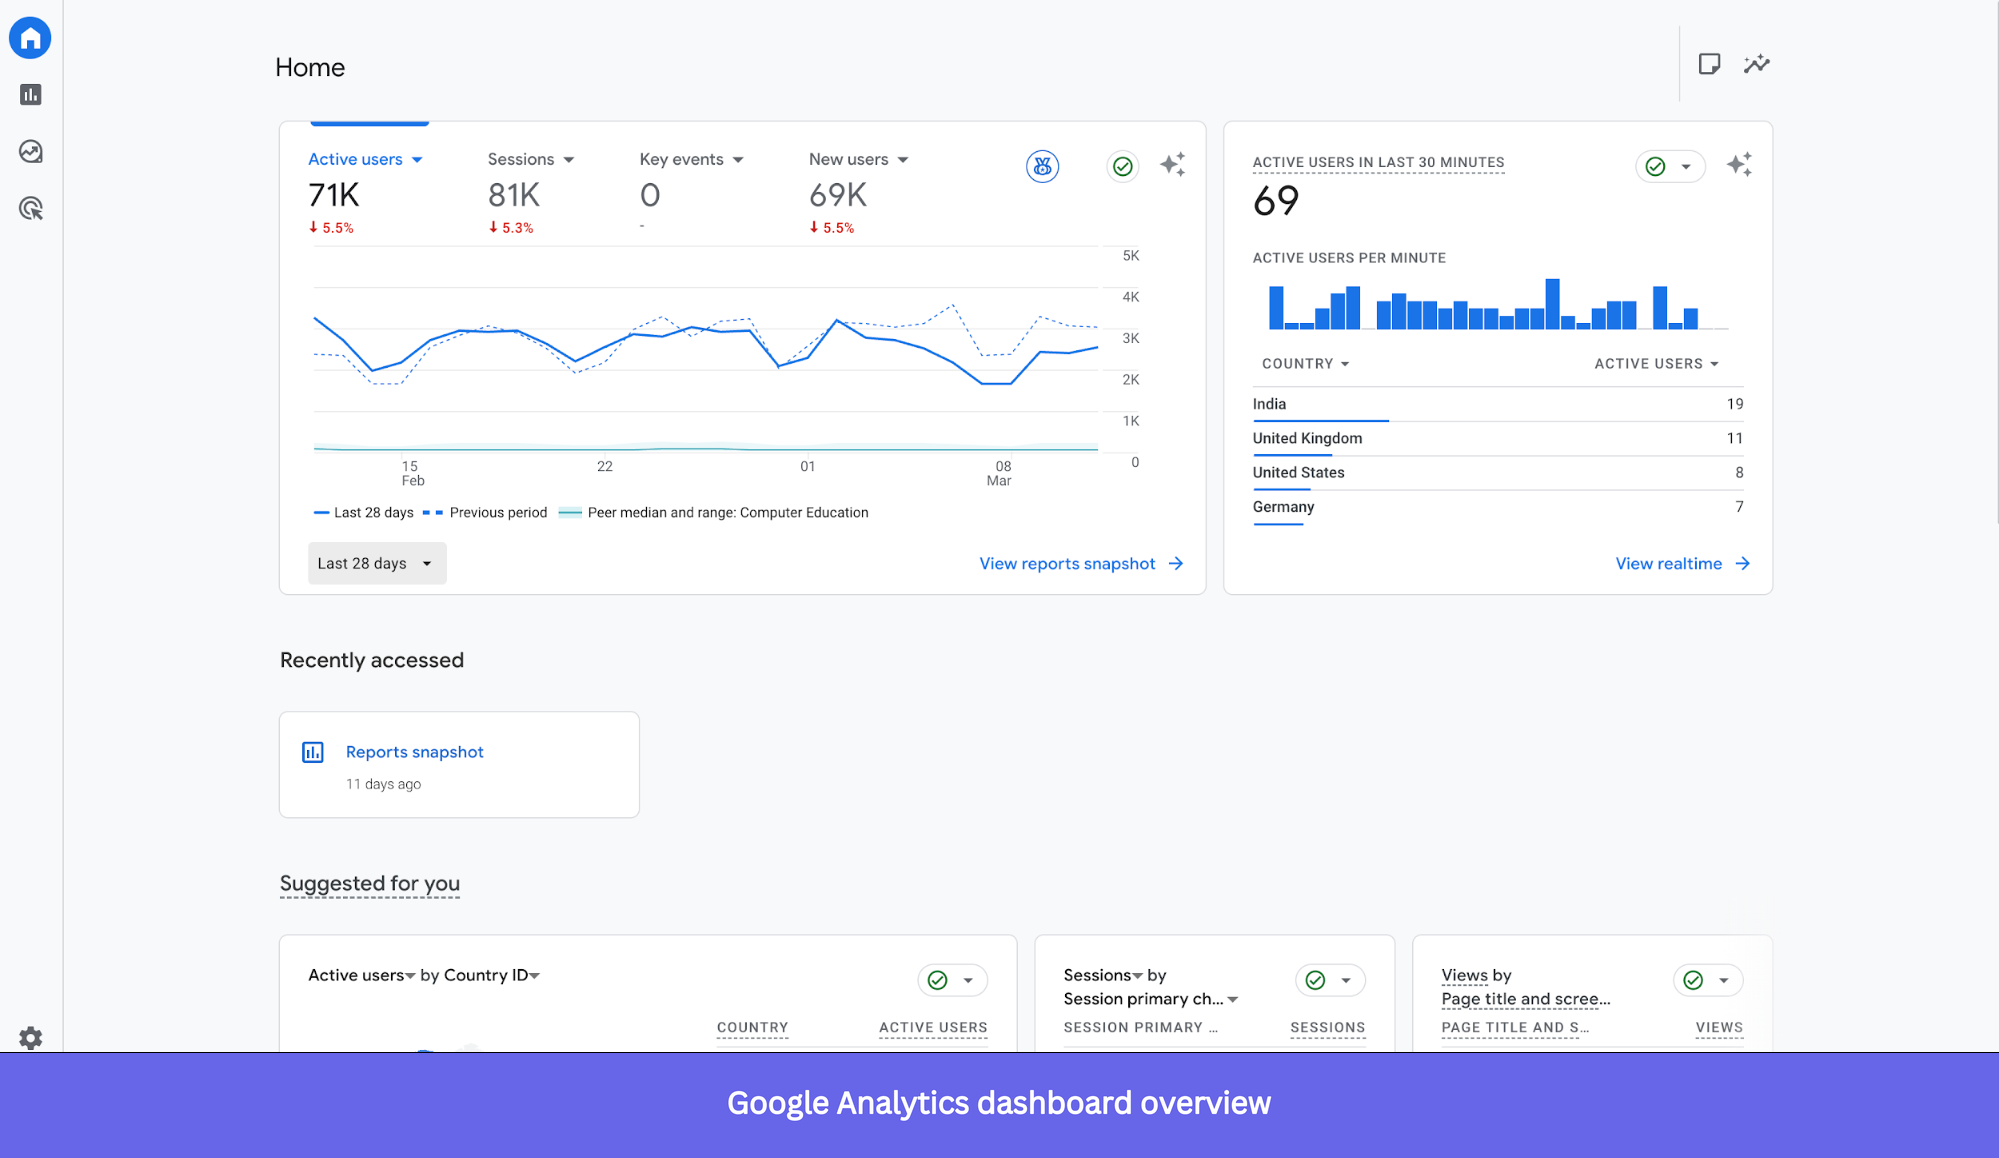
Google Analytics 4
Google Analytics 4 has evolved beyond traditional web analytics to include event tracking capabilities, making it a viable option for teams with simpler product analytics needs. While it doesn’t match Mixpanel’s depth in behavioral analysis, GA4’s zero cost and integration with the broader Google marketing ecosystem make it attractive for businesses already invested in Google’s tools. The learning curve for GA4 can be steep, but teams familiar with the Google Analytics interface may find the transition manageable.
Crazy Egg
Crazy Egg focuses on visual analytics, offering heatmaps, scroll maps, and session recordings through a user-friendly interface. While it doesn’t provide the same depth of event-based analytics as Mixpanel, Crazy Egg excels at quickly identifying usability issues and understanding how users interact with specific pages. For teams that need straightforward insights without extensive technical setup, Crazy Egg’s simplicity can be an advantage.
Hotjar
Hotjar specializes in qualitative insights through heatmaps, session recordings, and feedback tools. The platform helps teams understand the “why” behind user behavior tracking through visual data and direct user feedback. While Hotjar doesn’t offer the quantitative depth of Mixpanel’s event analytics, it provides complementary insights that can validate hypotheses generated from quantitative data. Many teams use Hotjar alongside a product analytics platform to combine behavioral metrics with qualitative understanding.
Userpilot
Userpilot combines product analytics with in-app engagement capabilities, offering a distinct advantage for teams that want to both analyze user behavior and act on those insights within their product. The platform provides autocapture events, detailed analytics reports, customizable dashboards, and session replay functionality.
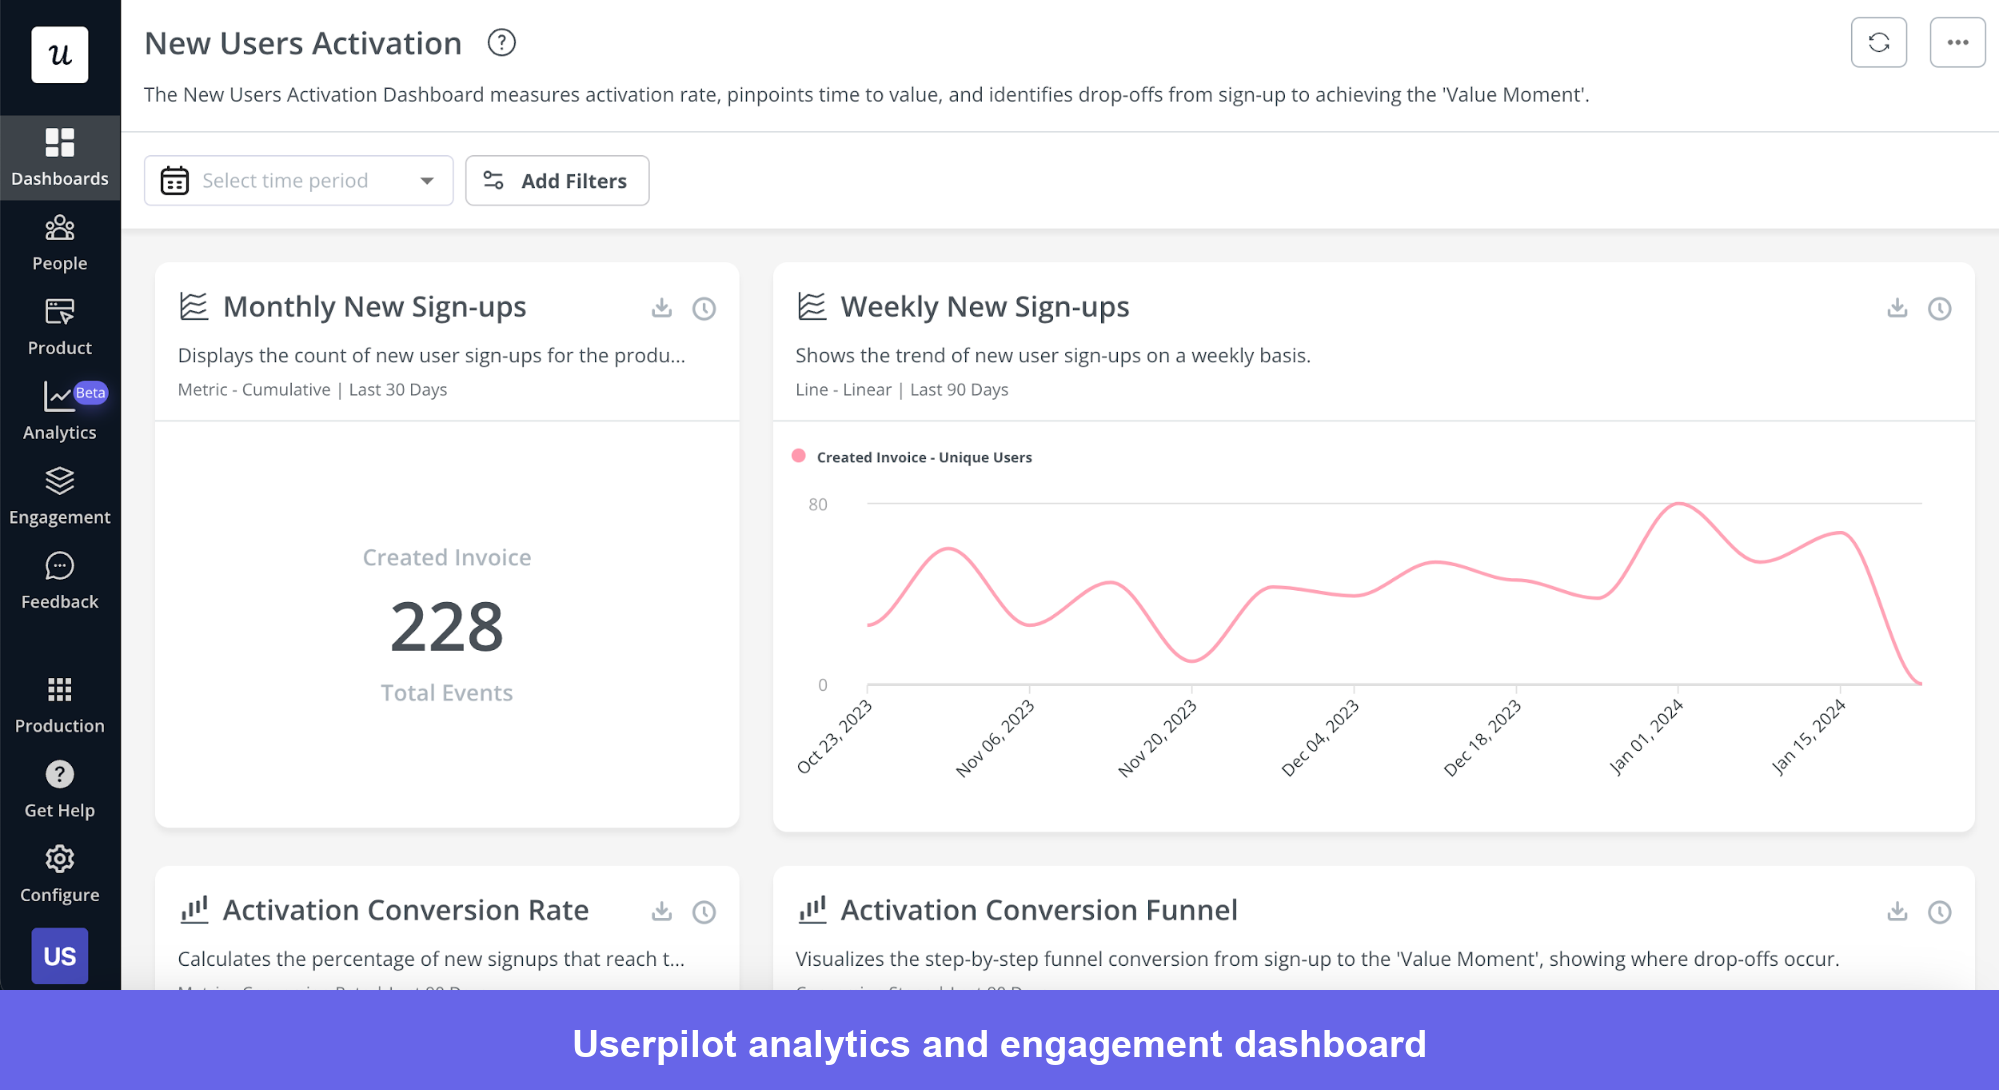
What distinguishes Userpilot is its no-code approach to creating in-app experiences so teams can build onboarding flows, feature announcements, and user surveys without engineering resources. This integration of analytics and engagement makes it particularly valuable for product teams that want to close the loop between insight and action quickly.
The alternative you pick depends on your specific priorities. If you need analytics tightly integrated with engagement tools, Userpilot offers unique value. For teams seeking the deepest possible behavioral analytics with predictive capabilities, Amplitude deserves serious consideration. Organizations with simpler needs or tighter budgets might find Google Analytics 4 sufficient, while those prioritizing visual insights and ease of use should evaluate Crazy Egg or Hotjar.
Is Mixpanel right for your business?
Honestly, the answer depends less on Mixpanel and more on your team’s current state.
If you have a dedicated data analyst or an engineer who owns your event taxonomy, Mixpanel is a good choice. The depth of behavioral analysis it offers, including cohorts, funnel breakdowns, and retention by segment, is hard to match.
If your product-led SaaS team usually asks questions like “which onboarding steps predict 90-day retention?” or “how does feature X adoption correlate with expansion revenue?”, Mixpanel gives you the analytical infrastructure to answer those properly, not just approximately.
Where I’d pump the brakes is if you’re an early-stage team or a product org without dedicated analytics ownership.
The platform rewards upfront investment in your event schema. Get that wrong, and your reports become unreliable fast. I’ve seen teams six months into a Mixpanel implementation still untangling duplicate events and test user contamination. That’s a real cost that doesn’t show up in the pricing calculator.
The other thing worth flagging is that Mixpanel is fundamentally an observation tool. Once you’ve identified that users are dropping off at step three of your onboarding flow, you still need a separate tool to do anything about it. For teams that want to trigger a tooltip, launch a contextual checklist, or run a microsurvey in response to what the data shows, you’re adding another layer to your stack. That’s manageable if you have the bandwidth, but it’s worth factoring in before you commit.
The sweet spot for Mixpanel is mid-market and above: product teams with clear analytical goals, some technical capacity, and enough event volume to justify the investment. For bigger teams or those who want analytics and in-app engagement in one place, there are better alternatives available.
Userpilot strives to provide accurate information to help businesses determine the best solution for their particular needs. Due to the dynamic nature of the industry, the features offered by Userpilot and others often change over time. The statements made in this article are accurate to the best of Userpilot’s knowledge as of its publication/most recent update on March 24th, 2026.
About the author