NPS Metric: What Does NPS Stand For And How To Calculate It?


What does the NPS metric mean? How do I calculate NPS? Is my NPS score good or bad?
If you’ve been asking yourself these questions, you’re in the right place.
Here are the basics of collecting customer feedback using the Net Promoter Score (NPS).
What does the NPS metric stand for?
The Net Promoter Score (NPS) is a widely used metric for measuring customer loyalty and satisfaction. Developed by Fred Reichheld, it helps gauge the likelihood of customers recommending a company’s product or service to others.
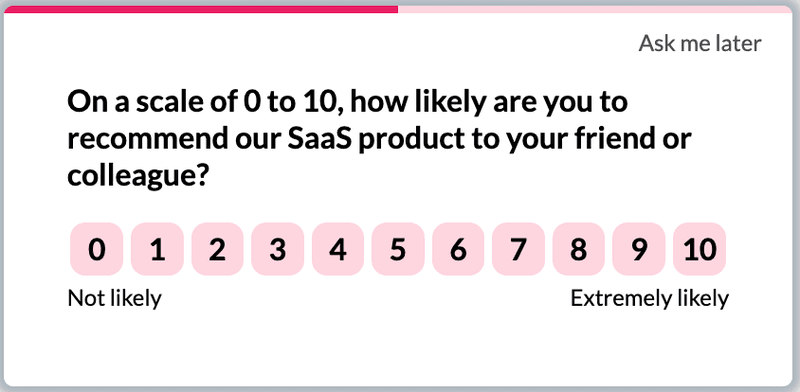
The core question used to calculate the NPS is: “How likely is it that you would recommend our company/product/service to a friend or colleague?”. Respondents typically provide a rating on a scale from 0 to 10.
How to calculate net promoter scores?
To calculate net promoter score, you have to run an NPS survey that asks:
“On a scale from 1 to 10, how likely would you be to recommend product x to a friend or colleague?”
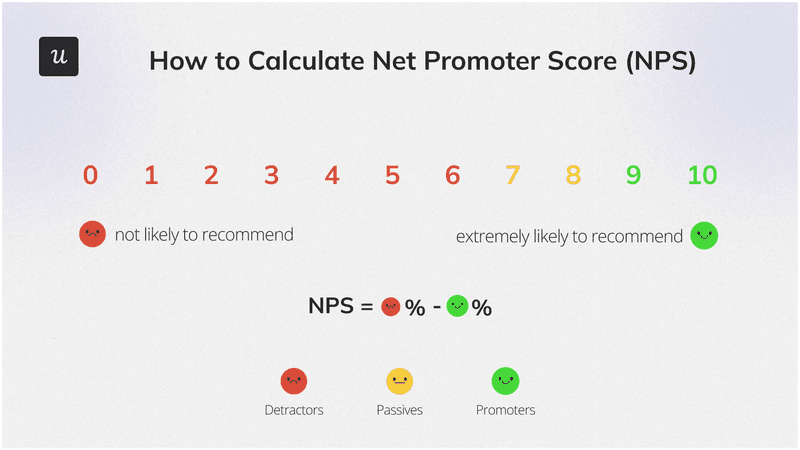
Based on user NPS data, they are categorized as Promoters (score 9-10), Passives (score 7-8), or Detractors (score 0-6).
For the net promoter score calculation, you need to subtract the percentage of detractors from the percentage of promoters.
Your NPS scores can range anywhere between -100 to 100 depending on your promoter-detractor ratio.
You can also use our free NPS calculator here!
NPS metric: Detractors
Detractors are unhappy customers who respond 6 or lower on your NPS survey. They don’t recommend your product and are more likely to spread negative word about it. This is because they are experiencing issues with your product or can’t see the value in it.
Addressing detractor concerns can be the quickest way to reduce your churn rate.
NPS metric: Passives
Passives are users who respond with a score of 7-8 on your NPS survey. They are generally satisfied but not very enthusiastic about the product.
Passives are not included in the NPS metric calculation.
Turn them into promoters by bringing them to the “AHA moment”.
NPS metric: Promoters
Promoters are users who respond with a score of 9-10 on your NPS survey. These are the customers who love your product and are getting continuous value from using your product
These are the users with high loyalty who will continue to use your product and refer new users to the company (thus fueling your revenue growth).
Figure out what they like most about your product and build on those strengths.
How to interpret the NPS metric?
The NPS metric ranges between -100 and 100. Your NPS metric will be negative when you have more detractors than promoters, and positive when the opposite is true.
The NPS score varies across industries and checking what the average is for your industry can give you some insight into what’s a good or bad score.
However, while it’s true that specific industries have an average NPS, you don’t have to rely on comparison to gauge your efficacy. Checking for the average can give you a basic idea of what’s a decent score – just be careful not to lose the bigger picture!
Surpassing the NPS score of your competitors is always nice but it’s more important that you’re consistently improving on your previous performance. Your most important competition is yourself, rather than other businesses.
What is a good NPS metric?
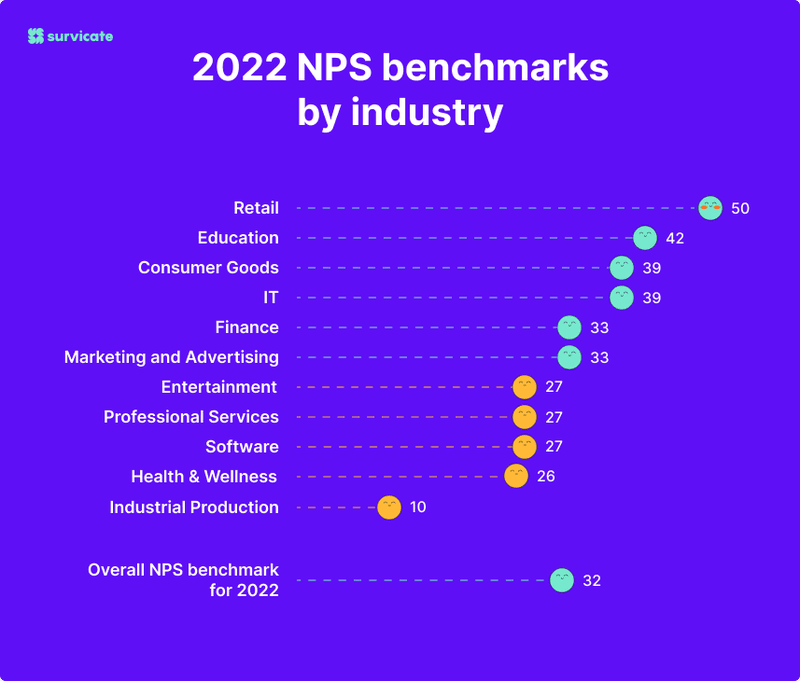
According to Survicate 2022 NPS benchmarks by industry, a good NPS score for SaaS businesses is around 41.
The industry average used to be 30 just three years ago, so it just goes to show that the expectations of customers never stop rising as competition increases.
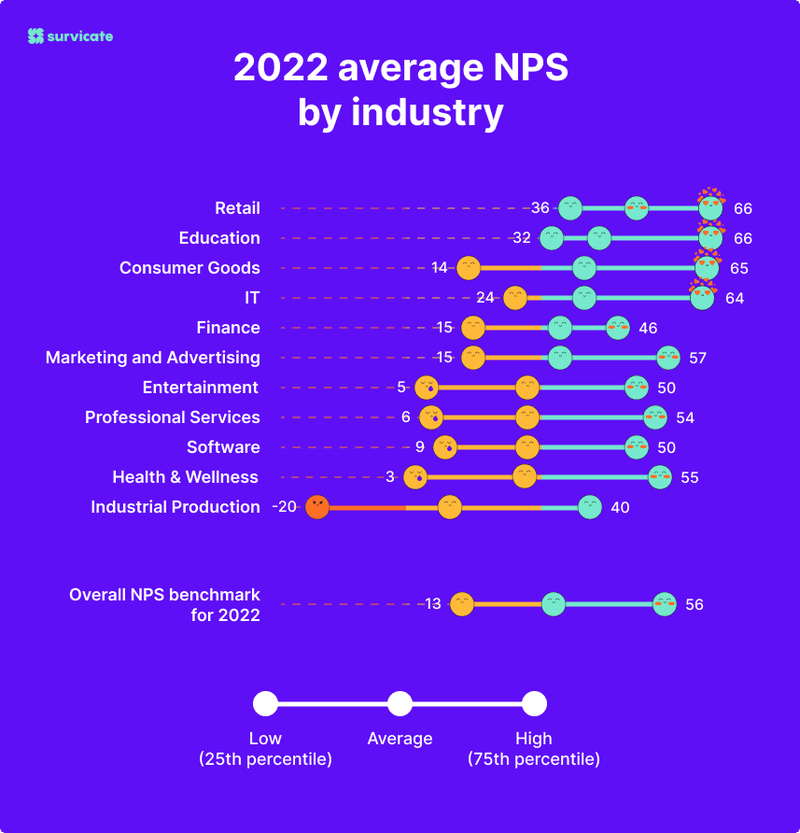
Of course, the industry leaders tend to have NPS metrics that are well above average. The chart below shows the companies with the highest NPS score in their respective niches.
What is a bad NPS metric?
A negative NPS score is bad since it means you have more detractors than promoters. This is an indicator that users don’t see value in your product.
Either your product needs to be improved or you’re targeting the wrong audience. In any case, focus on providing value to your customers rather than getting hung up on benchmarks.
If your product is suffering from low scores then reflect on the reasons why users are dissatisfied and act on them to improve your score. You can gather extra qualitative insights using the follow-up NPS question.
How to run an NPS survey and collect actionable insights?
To effectively run net promoter score surveys and derive actionable insights for your business, here are the key steps to follow:
Determine the type of NPS surveys
Before using NPS surveys, it’s important that you know which type to use. There are two main types: transactional and relational, each used in different scenarios.
- Transactional NPS surveys are designed to capture customer feedback based on specific transactions or interactions. These surveys are particularly useful when you want to assess customer satisfaction immediately after a particular touchpoint in the customer journey (i.e. customer service interaction, onboarding process, etc.)
- Meanwhile, relational NPS surveys focus on the overall, ongoing relationship between existing customers and the product. These surveys provide a holistic view of customer loyalty and satisfaction over time, i.e. on a quarterly or annual basis.
Set up score-based follow-up questions
Setting up score-based follow-up questions in your NPS survey is a crucial step to gathering more detailed insights and guiding strategic decision-making.
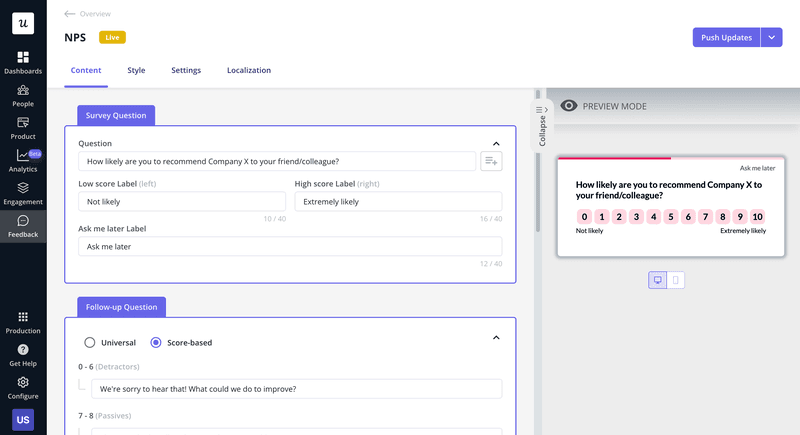
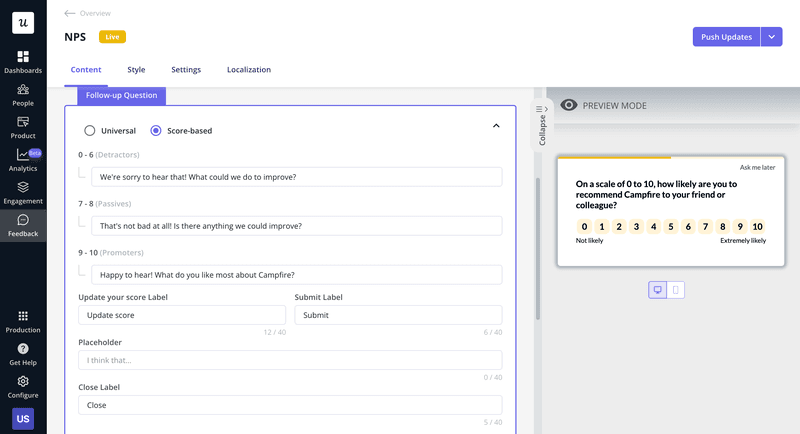
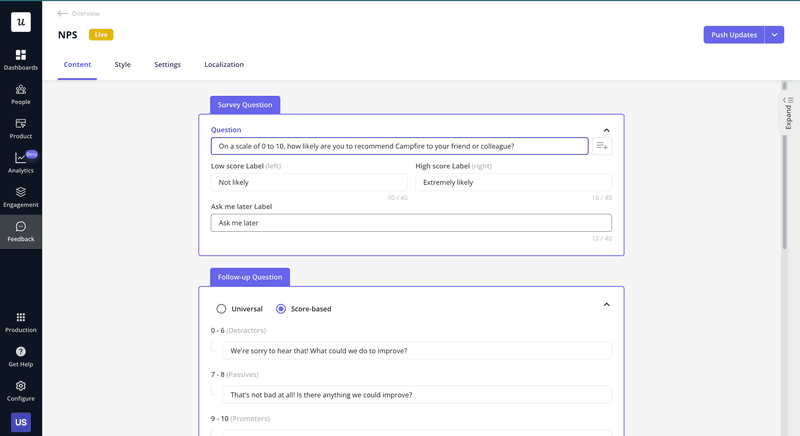
Depending on whether the respondents are Promoters, Passives, or Detractors, you can set up different NPS follow-up questions. For example, in Userpilot, you can easily tailor follow-up questions using score-based settings.
For customers who are Promoters, the survey will take them to Question 2 which helps uncover specific features, experiences, or attributes that contribute to their positive sentiment:
Analyze and act on NPS answers
The process doesn’t end after your customer submits their response. You should follow up with all three categories of users identified using your NPS survey.
Follow up on your promoters to get the most out of their loyalty, on passives to push them over the edge, and on detractors to fix the issue before you lose them.
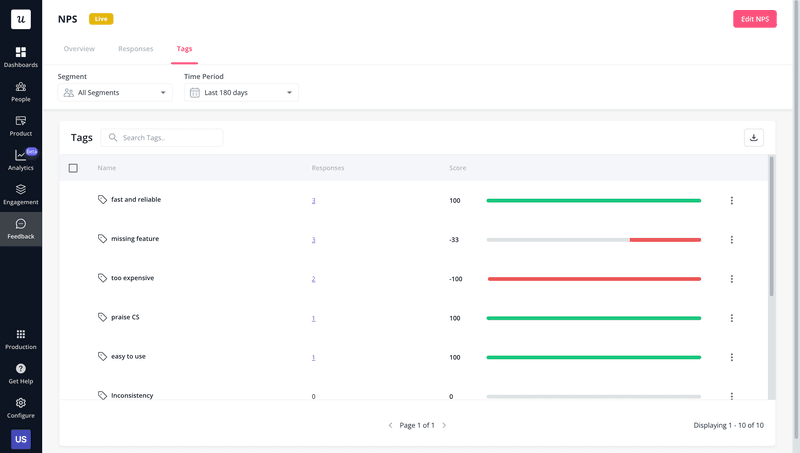
If you use an in-app NPS metric collection tool like Userpilot, you can analyze NPS answers by segmenting users based on their scores. You can also identify common issues among your detractors using answer tags. This helps you address root causes systematically, preventing recurring problems and improving overall customer satisfaction.
Run your net promoter system and drive business growth with Userpilot
Userpilot is a product adoption tool with advanced features to help you automate the net promoter score system, collect feedback, trigger follow-ups, and segment users to analyze their responses.
Here are the Userpilot features you can use when sending NPS surveys:
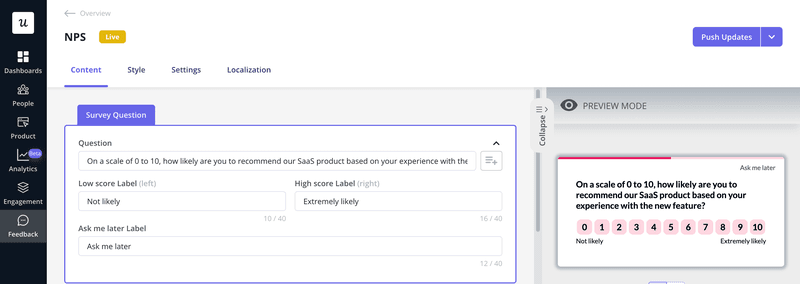
- No-code builder: The survey builder lets you edit the content of your NPS surveys, style the widget to your liking, restrict surveys to specific pages/paths, and use AI-powered localization to change the language of your survey.
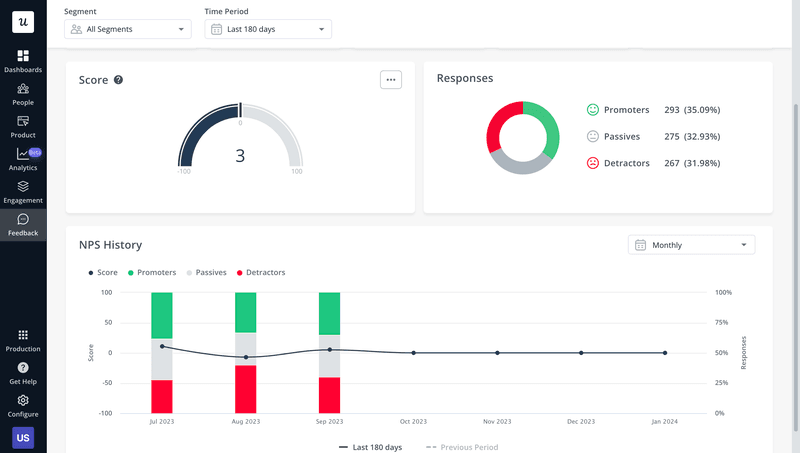
- Analytics dashboard: Userpilot’s dedicated NPS dashboard shows you all the key data gathered from your surveys. These include how many views your NPS surveys have gotten, the number of responses, the overall response rate, and how the score has been trending over time.
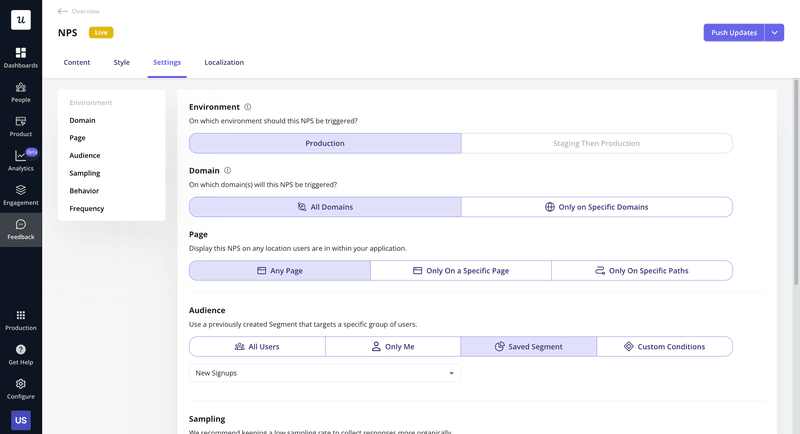
- Audience targeting: Userpilot’s audience targeting features let you choose which users to include in NPS surveys. You could set this to all users, select only me if you’re still in the testing stage, target a particular segment, or set conditions that must be met for a survey to appear.
Userpilot also enables response automation that resonates with each segment’s unique needs. For instance, you can trigger a loyalty program flow to promoters, a value-added offer to passives, or a prompt to assist detractors.
Conclusion
The net promoter score is far more than a fleeting dopamine hit for marketers or just another vanity metric. It is crucial to understanding customer satisfaction and can steer campaigns down the right path.
The NPS metric — when applied properly — can improve your customer experience, boost your brand loyalty, and cut down your customer churn rates. It’s not the be-all-end-all of product marketing, but it’s a good starting point to develop better customer relationships.
Want to start measuring user sentiment with the NPS metric? Get a Userpilot Demo and see how you can do it directly inside your product without needing to code!
About the author