
Product Launch Metrics: How To Measure The Success Of A Product Launch?
Product launch metrics can be easily overlooked while you become busy with product development, marketing efforts, and launch timeline. But tracking these metrics is equally important.
A Harvard Business School study found that a staggering 95 % of around 30,000 newly launched products fail. Although the failure rate differs from one industry to the other, the odds of success are 25 to 1 in general.
So, let’s find out what product launch metrics you can use to ensure successful product marketing and launch.
Try Userpilot Now
See Why 1,000+ Teams Choose Userpilot

What is a product launch in SaaS?
In SaaS, a product launch is a collaborative and coordinated effort to introduce a new solution in the market. It involves multiple teams across the organization, such as the managers, product team, sales team, product marketing, customer support team, and event management.
What are the product launch phases?
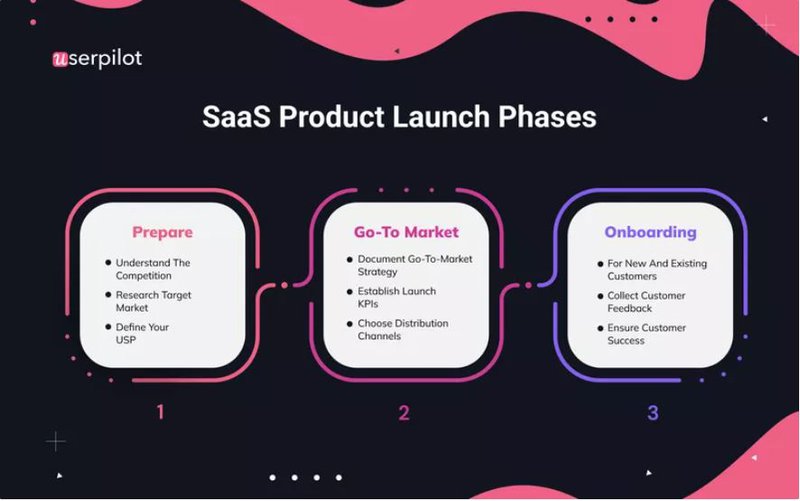
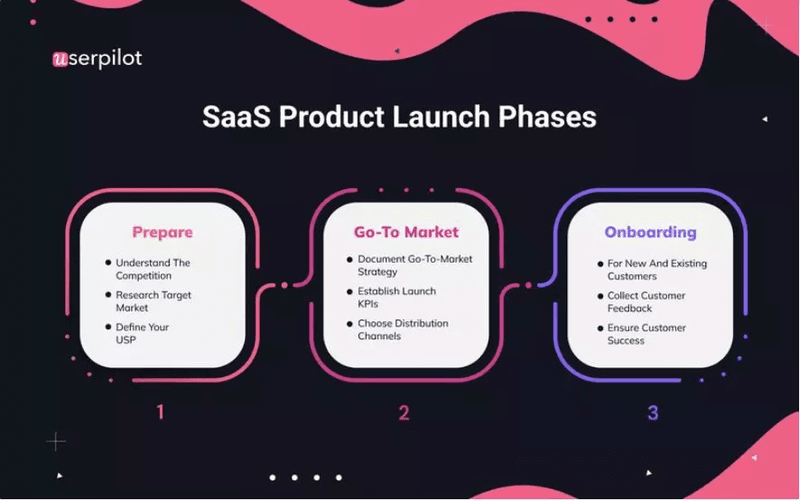
To achieve product launch success, you first need to know the different phases and form your launch strategy accordingly. There are three main phases that act as a short product launch checklist:
- Pre-launch phase: The phase where you prepare for launching the product on the scheduled date.
- Launch phase: The phase where you execute your go-to-market (GTM) strategy.
- Post-launch strategy: The phase where you concentrate on successful user onboarding.
Pre-launch phase
The pre-launch phase is for developing your launch plan and building the foundation for it. Here, you should research and understand your competitors to ensure a good product-market fit. Your product should have a unique selling proposition (USP), which is what distinguishes your product from that of competitors.
This stage is incomplete without determining a target market and mapping out the various user personas. You can categorize user persona based on your audience’s job title, company details, jobs to be done, pain points, your product’s benefits, and team collaboration. This will help you choose the proper marketing media and messaging.
Launch phase
The launch phase involves implementing your go-to-market strategy. This is the most crucial stage where you plan the tactics you will apply for lead generation. There are multiple tactics you can include in your GTM strategy:
- launching your product on Product Hunt
- displaying your product using a demo
- using an SEO content marketing strategy to boost trial signup rates
- recruiting beta testers from existing customers
- using paid advertising.
In the case of an existing product launch, you can use more direct methods of communication such as launch emails and in-app messaging. Moreover, you should set the key performance indicators (KPIs) during this stage to measure product launch success, which we’ll discuss more later on.
Post-launch phase
After user acquisition, you need to focus on user onboarding to get users to sign up for freemium or trial accounts and reach their activation milestones to finally become paying customers. You can use in-app onboarding guidance to direct users across their user journey, from experiencing the initial AHA moment to becoming loyal customers and brand advocates. Onboard and engage mobile app users by creating personalized messaging, push notifications, and surveys.
Here are some steps you can follow to create an engaging onboarding flow:
- Create a welcome screen to segment users based on user role, user behavior, or user state and then build personalized onboarding experiences for each.
- Build checklists to guide users down the steps that will help them reach the activation point faster.
- Use interactive walkthroughs to help users learn about relevant features and thus flatten the learning curve.
- Collect user feedback and make improvements based on their responses.
Product launch types
Here are three product launch types you can choose for your product launch.
- Minimal viable product (MVP): This comes with only the core features and functionalities to give the target audience a “taste/flavor” of your product. It brings your product to life as well as supports product testing with the various target groups. Such tests allow you to figure out whether your product is attracting the target users and make modifications according to their feedback.
- Soft launch: Call it a beta launch or soft launch, it involves releasing the product under special circumstances that exhibit it to only selected audience members. Therefore, a soft launch allows you to use reviews to build anticipation among the general public or make last-minute changes if needed. For instance, you could showcase your product to specific target journalists and customer groups to get valuable feedback and support.
- Full-scale launch: Also known as an official release or a hard launch, going full-scale makes the product completely available to the general public for being bought. Taking an “all or nothing” approach, this type of launch attempts to create a big, lasting impact to drive sales fast.
6 product launch metrics to measure the success
Simply launching a product isn’t enough. To ensure a successful product launch, you should track some key metrics to know whether your tactics are working out.
While these metrics can differ from one SaaS business to another, there are six product launch metrics that are common to all of them. Let’s have a look at them.
A visitor to trial sign up rate
The visitor to trial sign-up rate gives the percentage of visitors to your website/app who signed up for a free trial during a specific period.
In SaaS, a good visitor-to-lead conversion rate is around 7 %. The leads may include both marketing qualified leads (MQLs) and product qualified leads (PQLs). According to Capterra, the closing rate in the industry is 27 %, while the qualification rate is 36 %.
To measure this metric, divide the number of sign-ups by the number of visitors on your sign-up page, and multiply the ratio by 100.
How to improve the visitor sign-up rate?
The visitor to sign-up rate allows you to measure your marketing campaign and site/app’s ability to convert visitors. Multiple channels for driving this conversion rate include signup forms, call-to-actions, trial buttons, and pop-up forms.
Some site pages tend to have higher visitor-to-sign-up rates than others. So, you have to identify the sections and pages that users engage with the most.
Moreover, try to simplify the sign-up page form as much as possible. Ask for only relevant information and decrease the number of fields on the form. Along the user journey, there’ll be several opportunities for you to gather more data, but the sign-up flow is the first of them.
Thus, to create a mind share among the users with your first appearance, determine the minimum data you need for users to create an account.

Trial to paid conversion rate
The trial to paid conversion rate measures the percentage of trial users who become paying customers after their trial run is over.
It’s equal to the ratio of the number of free trial users who converted within a specific period to the total number of free trial users present within that period, multiplied by 100.
How to improve the trial to paid conversion rate?
The higher your trial to paid conversion rate, the lower your customer acquisition cost and the faster your revenue growth.
All of your active trial users are your PQLs, who are much easier to convert than MQLs. Thus a low trial to paid conversion rate suggests you should improve your user engagement and product-led sales strategy.
An engaging user onboarding flow is the key to boosting the trial to paid conversion rate. There are several ways to achieve that.
- Use a welcome screen to segment users and personalize the experience based on their specific needs.
- Create checklists to shorten the path to the activation milestone.
- Promote the “learn by doing” approach with interactive walkthroughs to guide users on only relevant features without dumping unnecessary information on them.
- Use A/B testing to optimize the in-app experiences you build with checklists, tooltips, modals, and other onboarding elements.
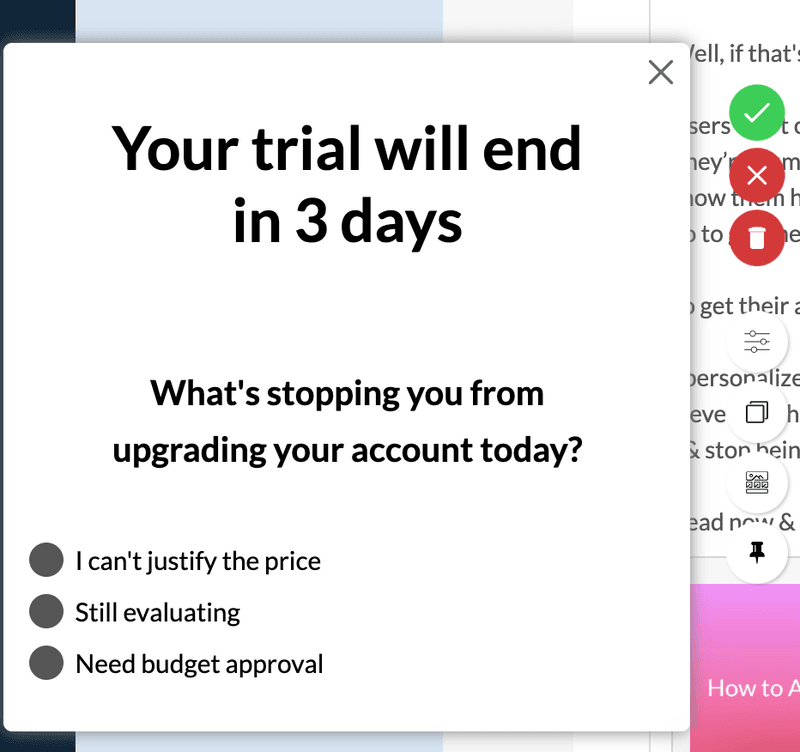
- Use churn surveys at the end of the trial to pinpoint why users don’t convert and make improvements based on the feedback. Here’s an example below.
Customer activation rate
Once your users have converted, you should check the rate at which they reach the activation point to finally experience the value of your product.
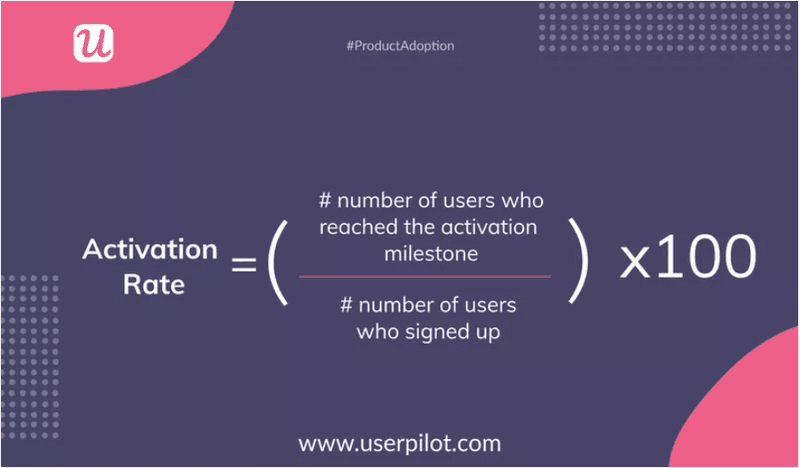
To calculate the activation rate, divide the numbers of users who started a trial and reach the activation point by the number of users who initially signed up, and multiply the result by 100.
How to improve the customer activation rate?
Before calculating this metric, you must define the in-app events that specific users need to undergo to get value from your product. From there, you can find the number of users who performed all these events within a given period.
You should segment new users into cohorts depending on their user personas and use cases. Then, track the activation rate for every cohort separately. It will help you understand user behavior better and, thus, build behavioral and personalized onboarding experiences.
Furthermore, as previously mentioned, you should A/B test the different in-app experiences to evaluate the success of each product experiment. This way, you can identify the ones that lead to greater activation rates.

Customer engagement score
The customer engagement score (CES) is a measure of how engaging your product is to free trial prospects and paying customers. It reflects every user’s engagement based on their actions or passiveness.
The CES metric is measured individually for every user. This can help you personalize strategies to improve retention and inspire loyalty.
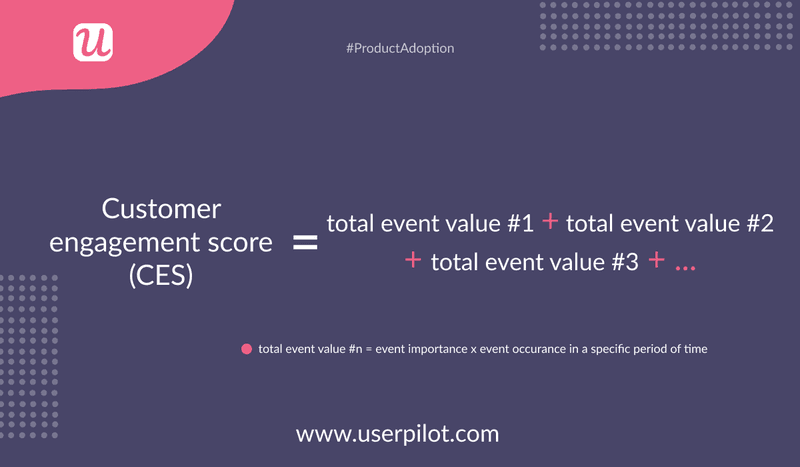
To get an accurate result, you need to account for multiple engagement events, such as product usage frequency and specific in-app actions. Assign a score, on a scale of 1-10, to each key event depending on its importance to the user persona and product.
Then multiply this score by the frequency of the event in the last x days. This gives the total event value, and the sum of all the event values results in the customer engagement score.
How to improve the customer engagement score?
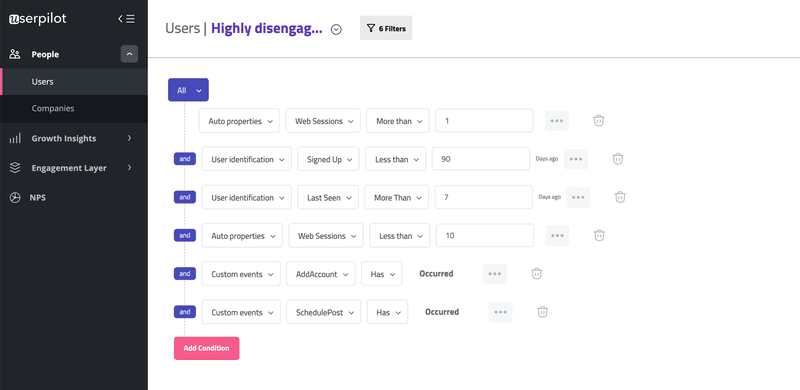
Track disengaged users with low CES scores and cross-reference data with other product usage analytics. This will help you discover friction points and remove them to improve your product experiences.
On the other hand, you should even track highly engaged users and cross-reference data with other product usage analytics to find scopes for account expansion. You can boost your monthly recurring revenue via upsells, cross-sells, and add-ons.
Feature usage rate
A key product usage metric is the feature usage rate, which is the percentage of customers using a particular product feature.
This metric is equal to the ratio of the number of feature monthly active users (MAUs) to the number of user logins multiplied by 100.

How to improve the feature usage rate?
Again, it’s best to track the feature usage rate of separate cohorts to understand what features are relevant to each user persona. This makes it easier to personalize onboarding.
With Userpilot, you don’t need separate tools for tracking in-app engagement and product analytics. It enables you to monitor feature engagement without coding. Just tag any feature using the product’s UI and track it without setting custom events.
Moreover, you can set particular goals and use elements like walkthroughs and checklists to boost engagement.

Customer churn rate
Why are users leaving despite your product launch efforts? Tracking the customer churn rate helps you know that.
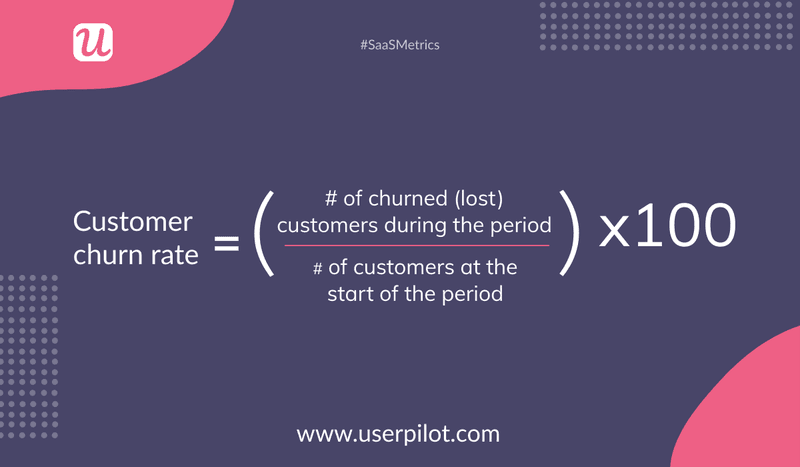
Calculate this metric by dividing the number of customers lost during a given period by the number present at the start of that period, then multiply the ratio by 100.
How to reduce the customer churn rate?
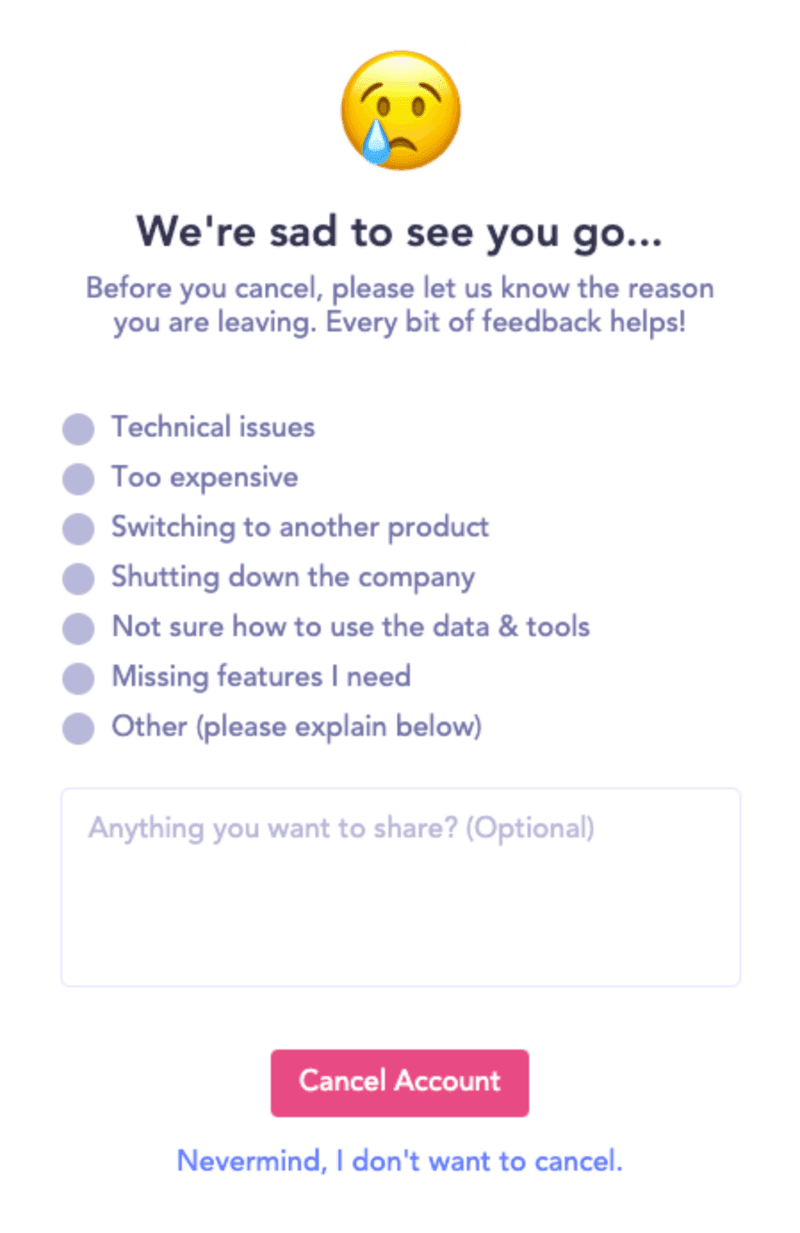
The next step is to reduce churn by using in-app churn surveys to know why your customers are leaving.
Such micro surveys not only let you suggest alternative options like pausing the account but also help you be proactive in discovering potential churn customers before they really leave.
Below is an example of a churn survey that is triggered upon clicking the cancel subscription button. It provides an optional box for adding more grievances a user might have.
Summing it up
The six metrics we discussed are critical to ensuring a successful launch.
Incorporating the insights from these metrics into your product launch marketing plan will help you distinguish your product from that of competitors and drive sales using your unique selling point.
Want to get invaluable insights on your product launch? Get a Userpilot demo and see how you can get the most out of your product launch.


![What are Release Notes? Definition, Best Practices & Examples [+ Release Note Template] cover](https://blog-static.userpilot.com/blog/wp-content/uploads/2026/02/what-are-release-notes-definition-best-practices-examples-release-note-template_1b727da8d60969c39acdb09f617eb616_2000-1024x670.png)


