Try Userpilot Now
See Why 1,000+ Teams Choose Userpilot

What are quantitative metrics?
Quantitative metrics are numerical data points used to evaluate a product’s performance. These metrics are often visualized through charts and graphs, making it easier for professionals to interpret them and make data-driven decisions.
Quantitative and qualitative metrics: What’s the difference
Quantitative and qualitative metrics differ in a number of ways, including:
- Definition: Quantitative data gives you the numbers—showing what is happening—while qualitative data adds context, explaining why it’s happening.
- Use cases: Quantitative metrics are used for setting benchmarks and tracking progress, while qualitative metrics are used to understand user behaviors, motivations, and experiences.
- Collection methods: Quantitative metrics are collected through structured methods like close-ended survey questions and event tracking tools, qualitative metrics, on the other hand, are collected through unstructured or semi-structured methods such as interviews, focus groups, and open-ended surveys.
- Analysis: Quantitative metrics are analyzed using statistical methods, data visualization, and predictive modeling to uncover patterns in the data. In contrast, qualitative metrics are examined through techniques like thematic coding, content analysis, or sentiment analysis to identify recurring themes and retract actionable insights.
Neither quantitative nor qualitative metrics are particularly actionable on their own. They complement each other and enable businesses to fill the gaps, get the full picture, and put their insights to use.
Why should SaaS companies track quantitative metrics?
Quantitative metrics provide a way to assess different aspects of your business, from measuring the effectiveness of marketing efforts to gauging the success of newly launched features. Equipped with this objective numerical data, you can identify growth opportunities and optimize your product for success.
Most importantly, quantitative metrics allow businesses to compare their performance against industry benchmarks and understand where they stand in the market.
To get started, check this SaaS product metrics benchmark report our team at Userpilot created based on quantitative metrics from 547 companies.

12 Key quantitative metrics SaaS companies should track
Now, that we’ve got the basics covered, let’s explore some of the most important quantitative metrics out there and discuss the benefits that comes with tracking them.
Quantitative product metrics
Quantitative product metrics provide valuable insights into your product’s performance. Let’s look at some of them.
1. Trial-to-paid conversion rate
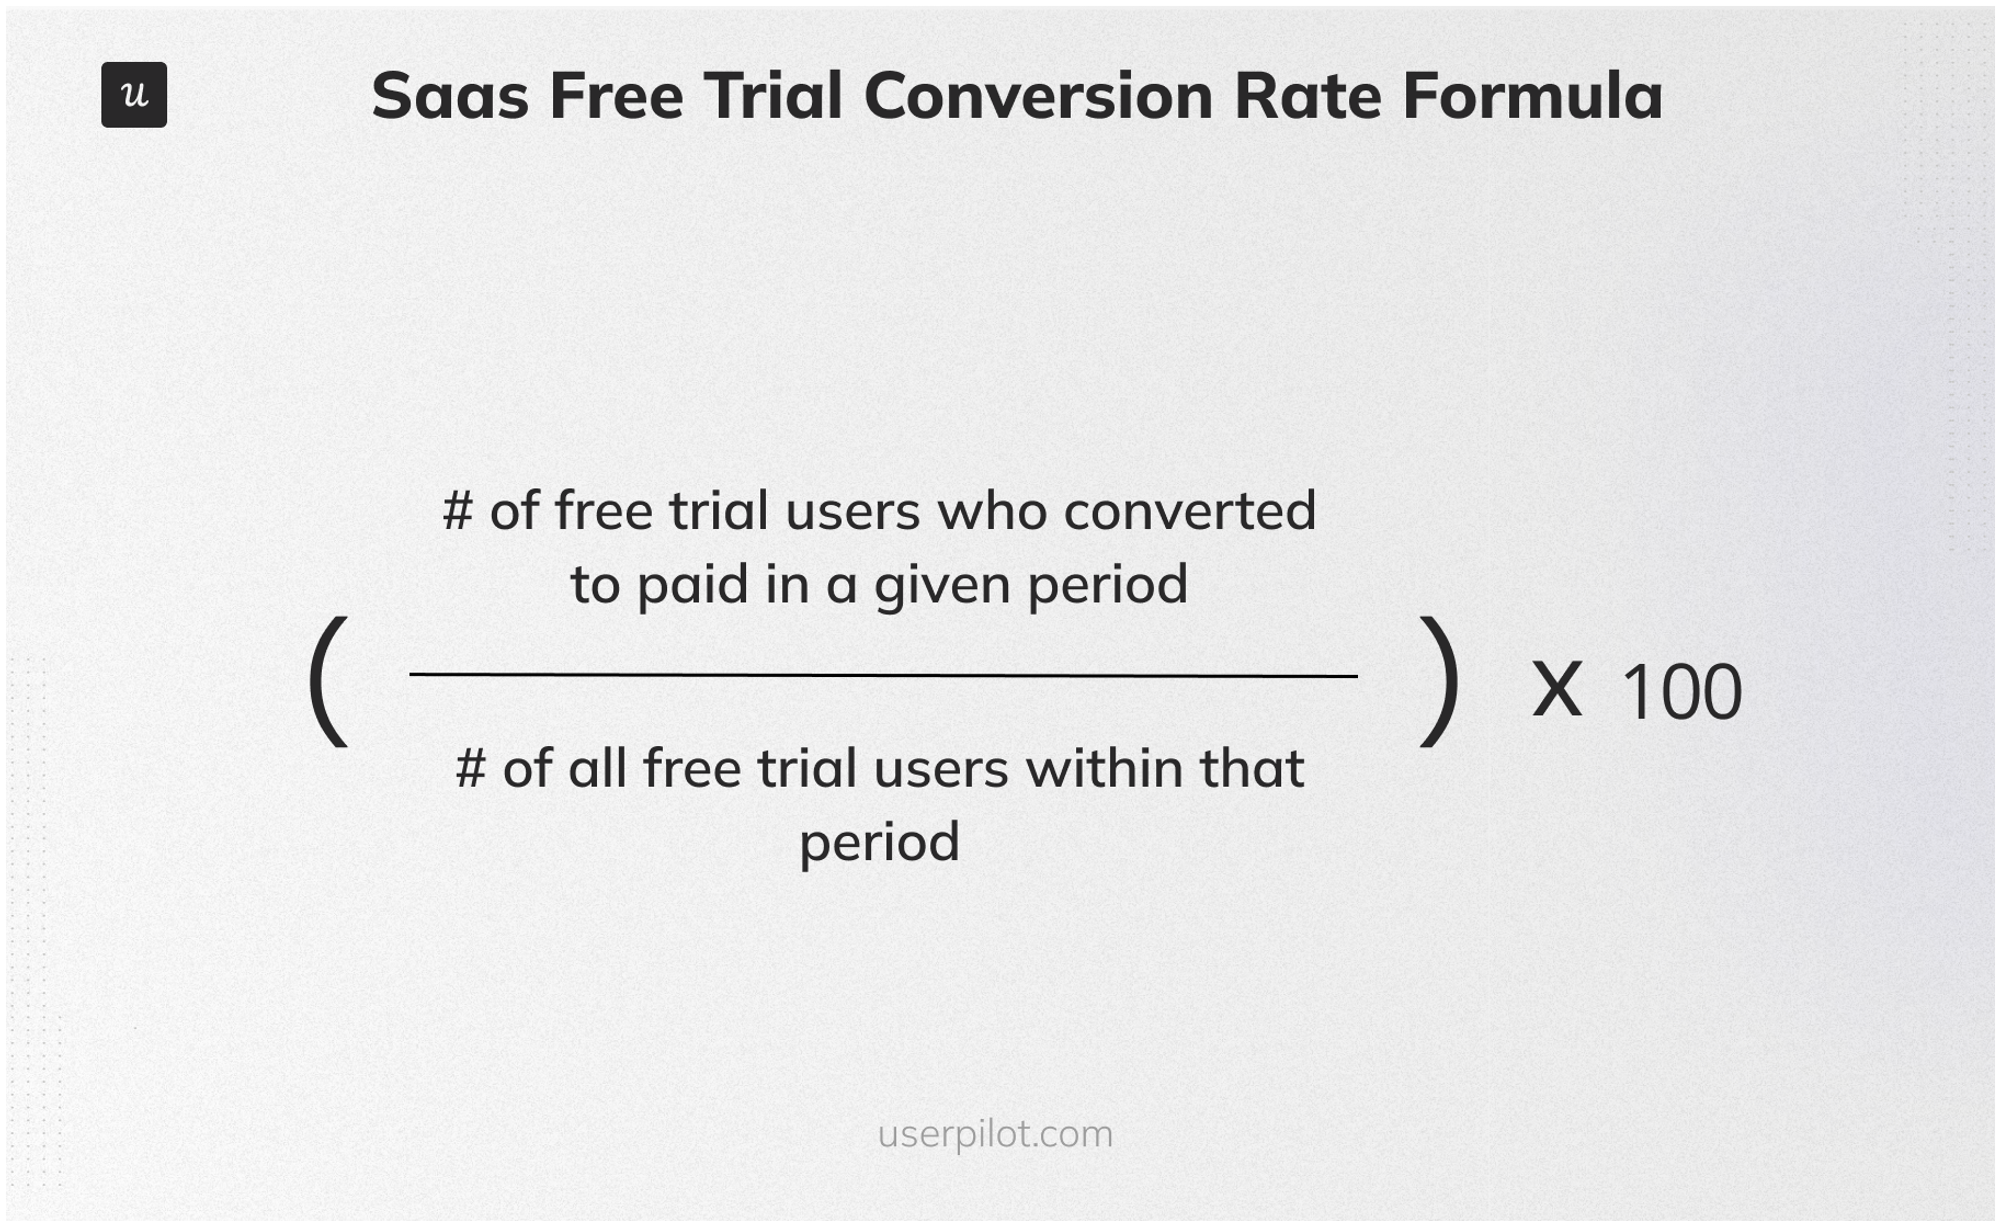
Trial-to-paid conversion rate is the percentage of users who upgrade to a paid account after the trial period expires. This metric measures your efforts to convert trial users into paying customers.
To calculate it, divide the total number of conversions by the number of free trial users in the same period and multiply by 100.
Suppose you had 200 conversions out of 1,000 free trial users last month. Your trial-to-paid conversion rate was (200/1,000)*100, or 20%.
2. Average session duration
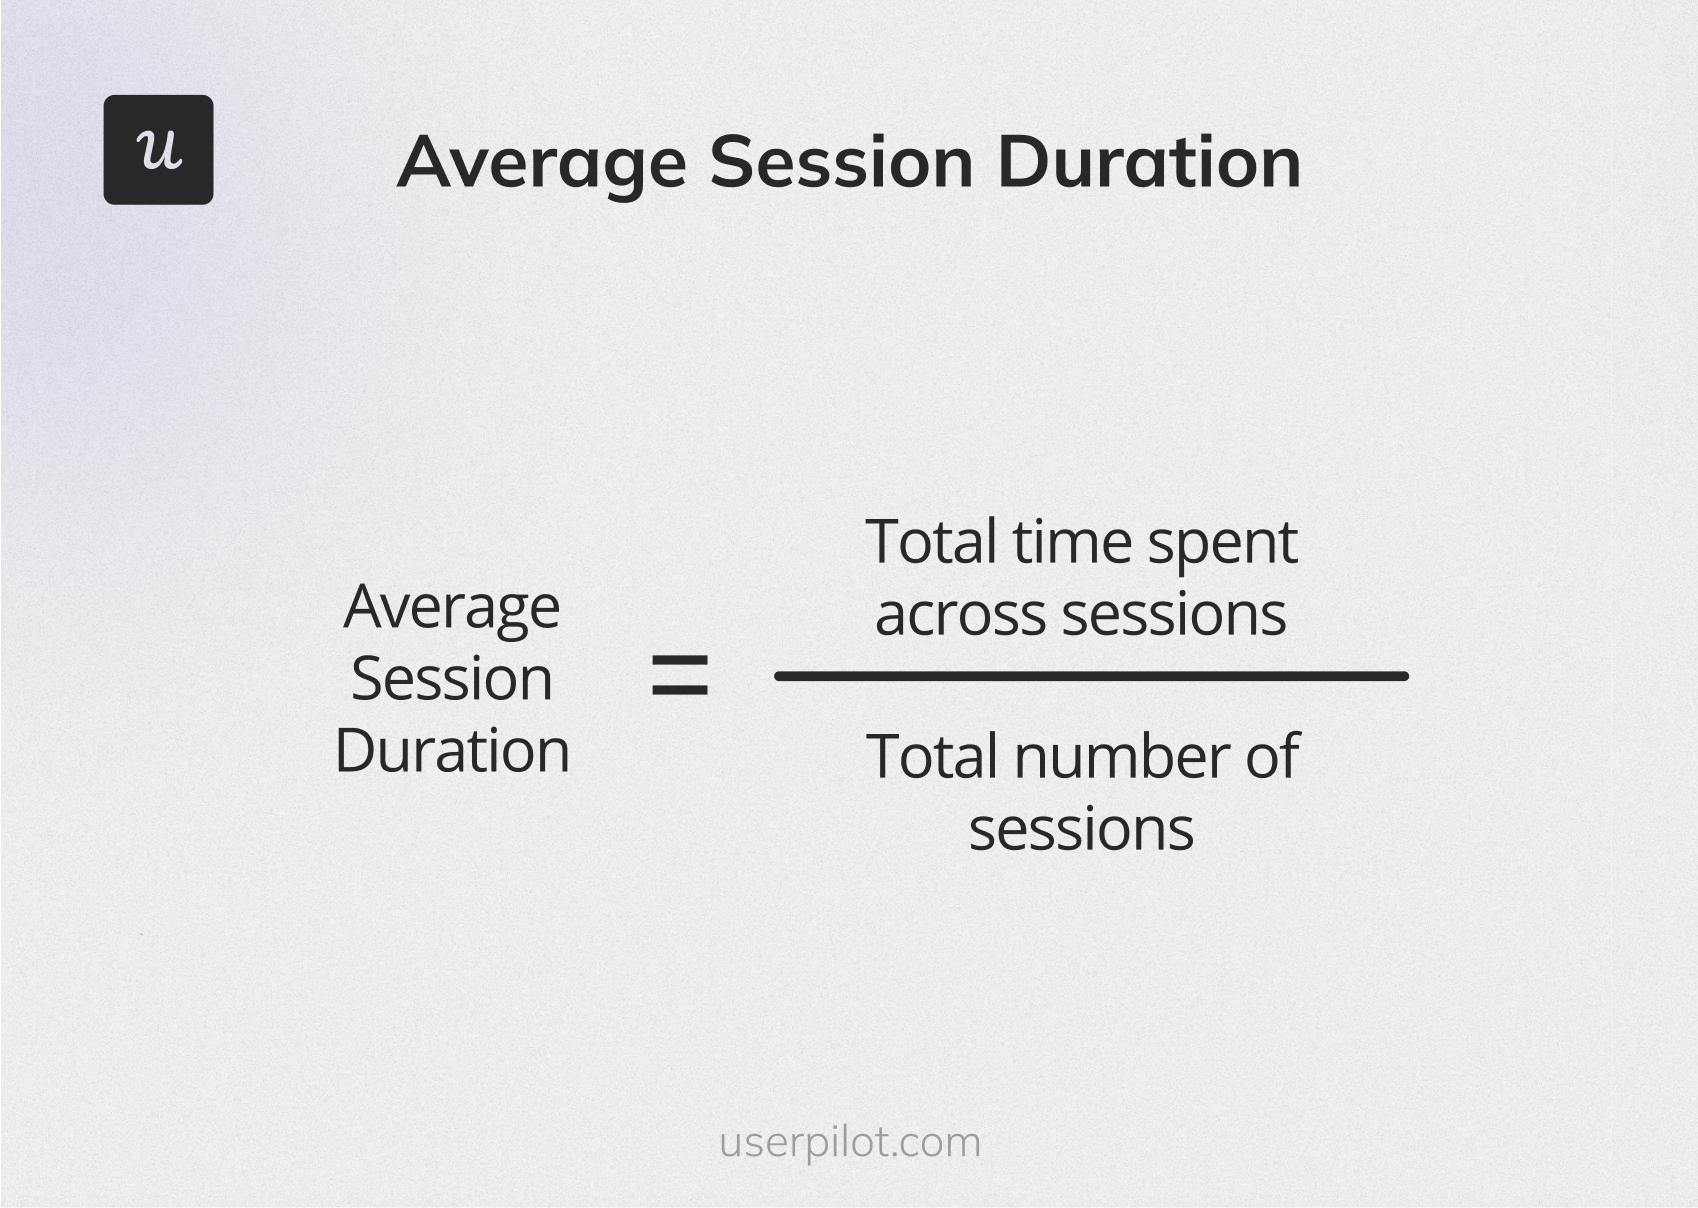
Average session duration measures the amount of time users spend on an application during a single session.
It’s calculated by dividing the total duration of all sessions by the number of sessions within a specific period.
This metric is important because it helps gauge user engagement and assess how effectively a site or app retains visitors. A longer average session duration often indicates engaging content or features, while shorter durations may suggest usability issues. By monitoring this metric, companies can make data-driven improvements to enhance the user experience and keep users engaged.
3. Feature usage rate
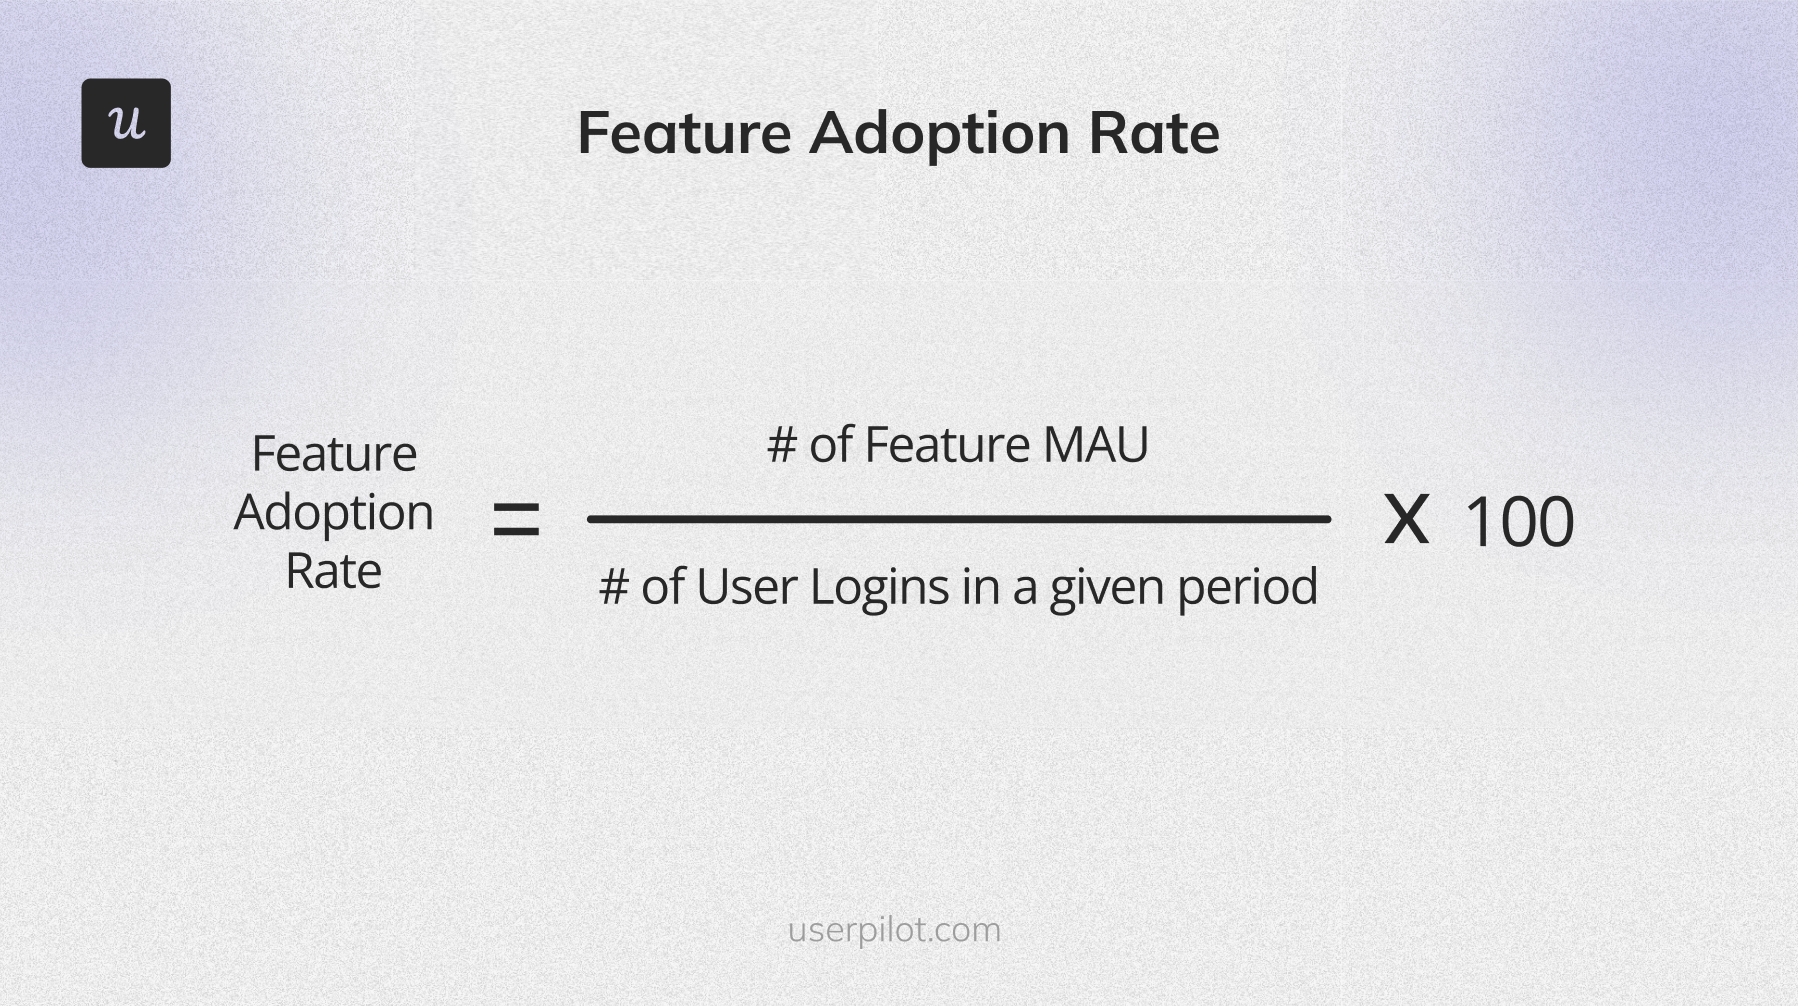
Feature usage rate is the percentage of active users utilizing a specific product feature. It gives you insights into the features that bring in or retain more customers.
You can calculate it by dividing the number of feature monthly active users (MAUs) by the number of user logins in a specific period and multiplying it by 100.
For example, you have total MAUs for a feature of 2,000 and total user logins of 20,000 this month. Then your feature usage rate is (2,000/20,000)*100, or 10%.
4. Product adoption rate
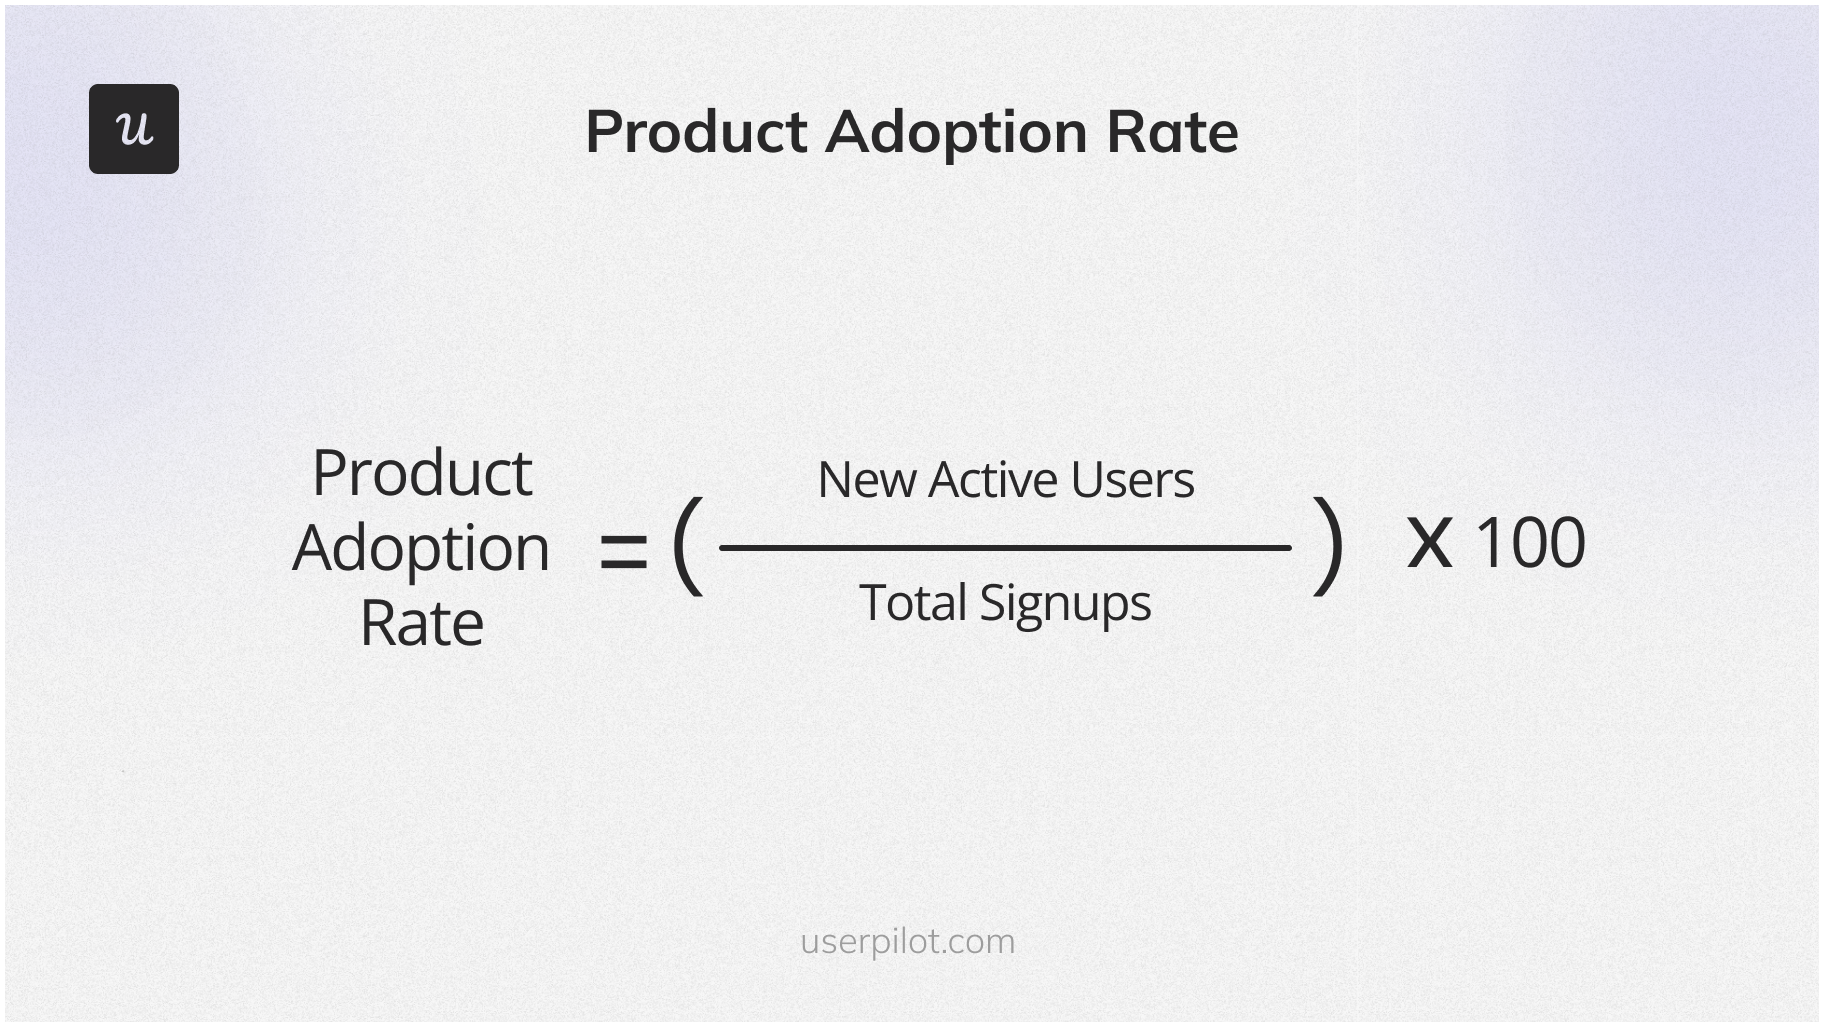
Product adoption rate refers to the percentage of new active users among total signups who adopt your product within a given period. It helps you understand your product’s performance by measuring how quickly customers adopt and use it.
You can calculate this product analytics metric by dividing the total number of new active users by the number of signups in the same period and multiplying by 100.
Suppose you have 500 active users now, compared to 4,000 signups this month. In this case your product adoption rate is (500/4,000)*100, or 12.5%.
Quantitative customer success metrics
Here are 4 quantitative customer success metrics that will help you track your customer success team’s performance to give customers consistent value while they use your SaaS.
5. Customer satisfaction rate
The customer satisfaction score (CSAT) measures how satisfied users are with specific aspects of your product or service. It usually involves asking customers to rate their satisfaction on a scale, often from 1 to 5.
CSAT provides direct feedback on user satisfaction and helps identify areas for improvement. It’s a quick and straightforward way to gauge customer sentiment and overall product satisfaction.
To calculate CSAT, divide the number of satisfied responses (typically 4 or 5 on a 5-point scale) by the total number of responses, and multiply by 100.
For instance, if you have 400 satisfied responses out of 500 total responses, your CSAT is 80%.
CSAT = (400/500) × 100 = 80%

6. Customer acquisition cost
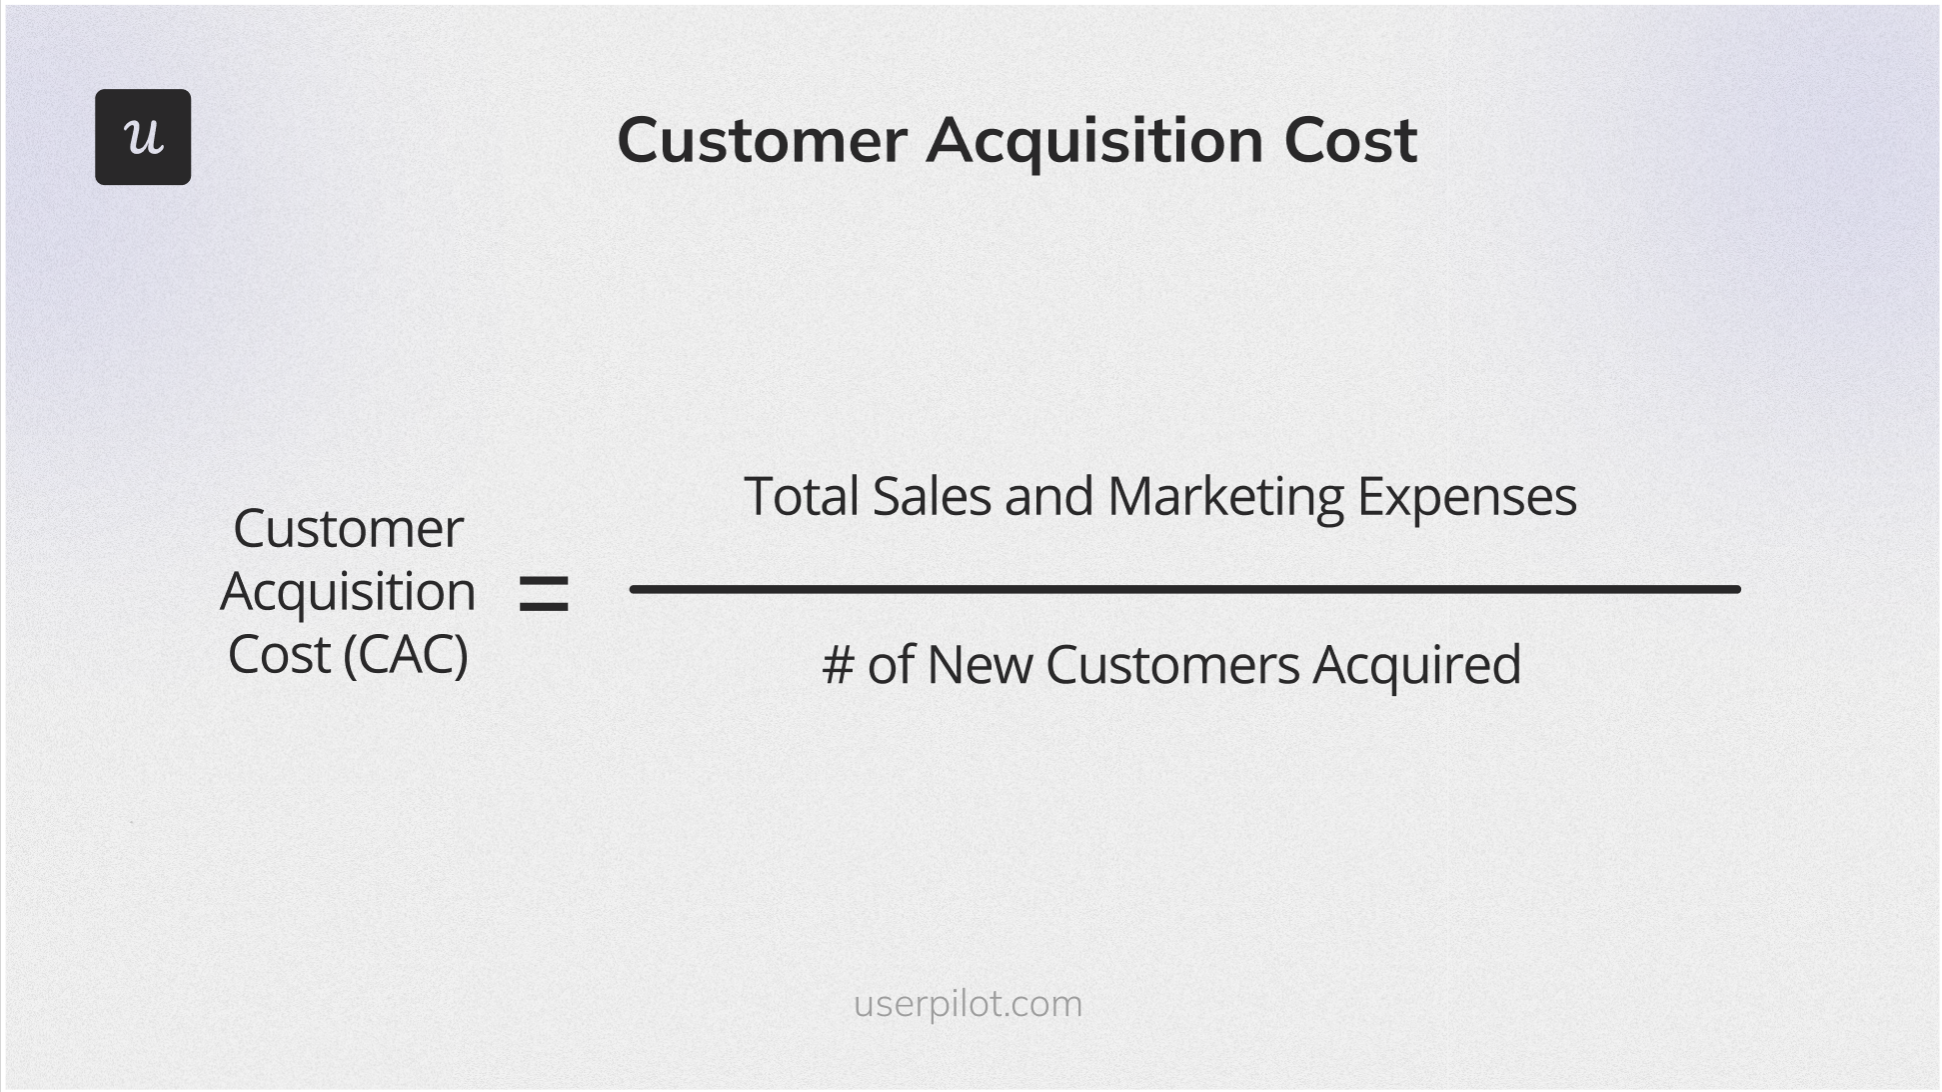
Customer acquisition cost (CAC) is an estimated measurement of how much it costs to get a new customer through your sales and marketing efforts.
To calculate it, divide the total sales and marketing expenses by the number of new customers you acquired in that same period.
Let’s consider you spent $205,000 on sales and marketing in your last business process and acquired 125 new customers. Your CAC would be $1,640.
7. Customer retention rate
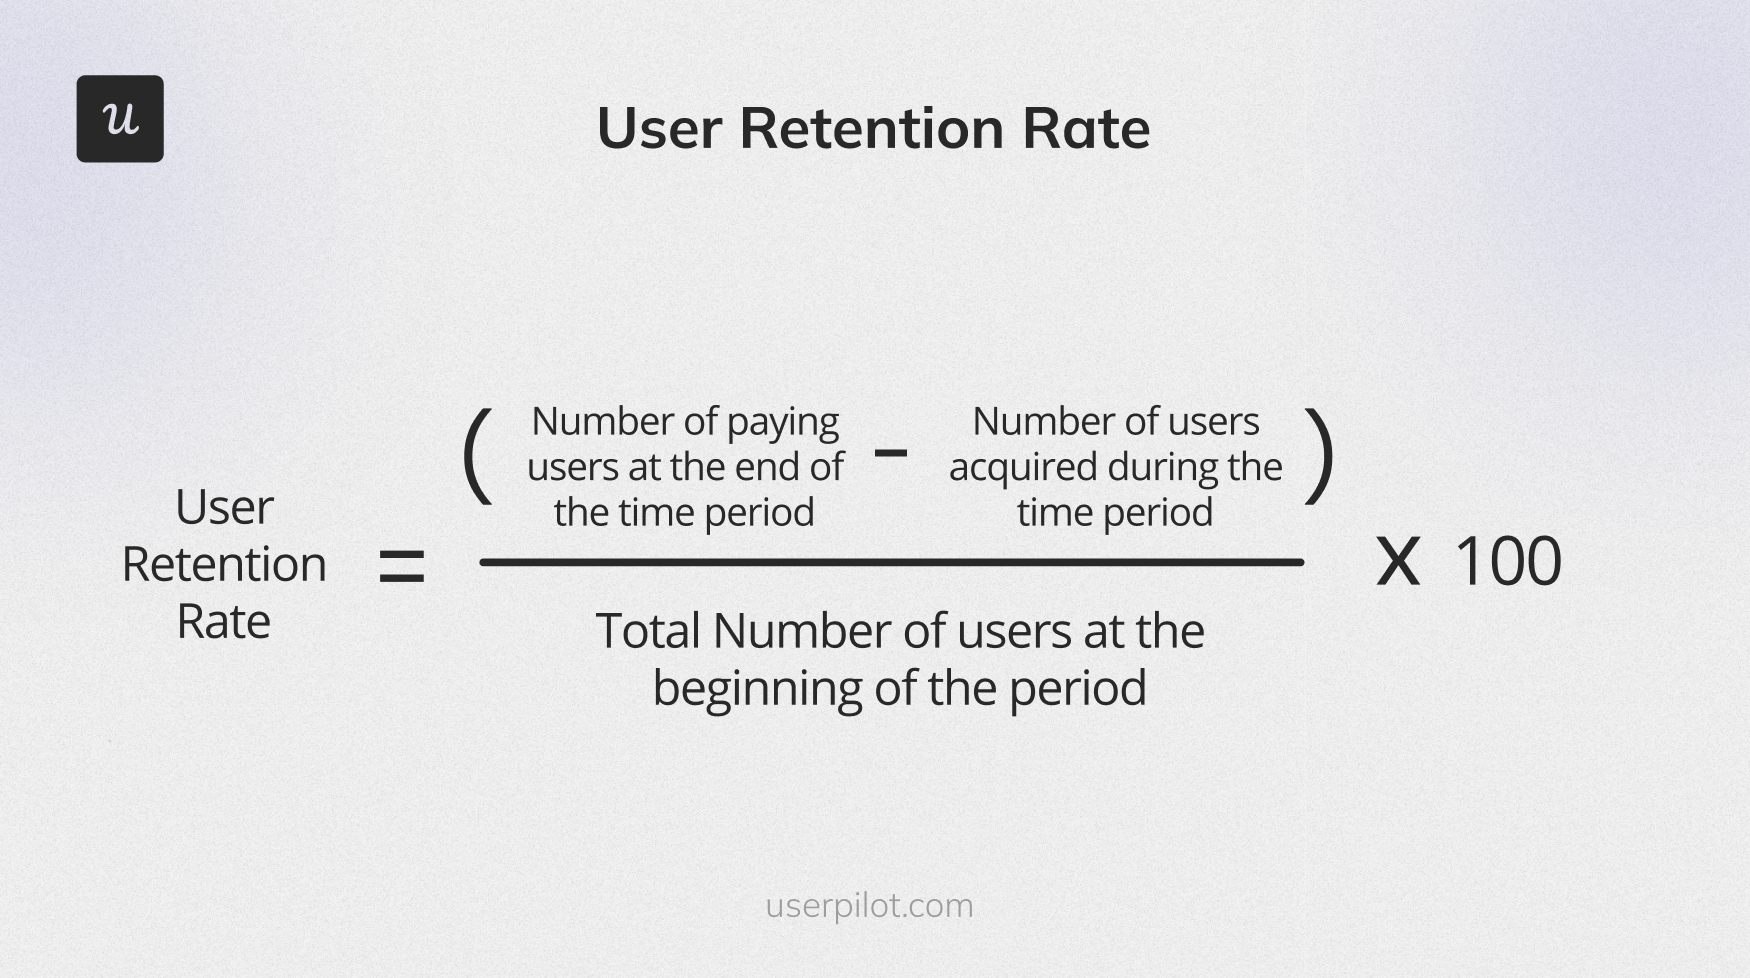
Retention rate is the percentage of customers you retain at the end of a particular period. It helps you understand customer satisfaction and improve various aspects of your products to attain greater customer success.
You can calculate this quantitative metric by dividing the number of paying customers at the end of a period by the total number of customers at the beginning and multiplying by 100.
Suppose you had 2,000 customers at the beginning of this month and have 450 paying customers now. Your retention rate is (450/2,000)*100, or 22.5%.
8. Product engagement score
The product engagement score (PES) provides a holistic view of how users interact with your product. It is a composite score that combines three key indicators – adoption, stickiness, and growth rates.
By calculating the average of these three metrics, the PES score reflects the overall engagement level of your users.
This high-level overview of engagement trends provides a singular insight into how users are interacting or engaging with your product. It can, thus, be a major contributor to product development decisions.

9.Customer churn rate
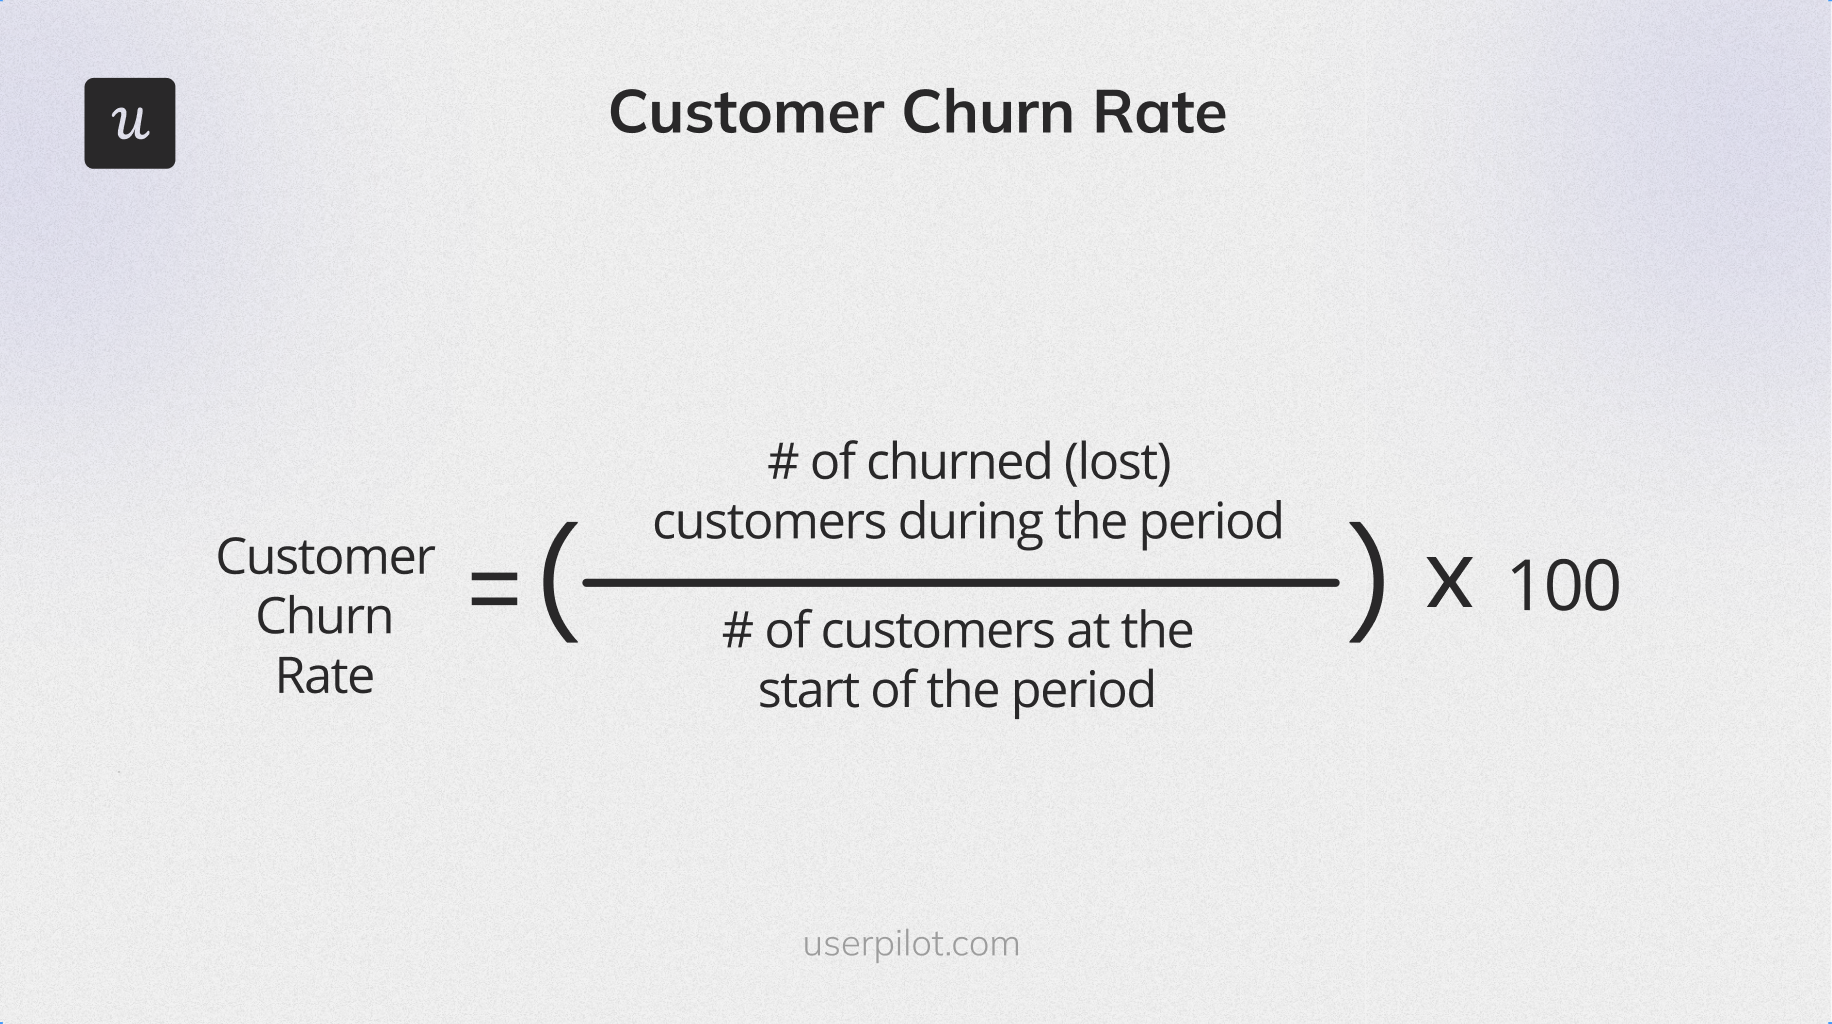
Churn rate is the percentage of customers who “churn” or leave your product during a given period. This metric can help you identify the pain points and weaknesses that cause customers to leave and then improve them.
You can calculate it by dividing the number of users who churned during a period by the number of users at the beginning and multiplying by 100.
Suppose you had 10,000 customers at the beginning of January and 9,800 at the end. The churn rate is {(10,000-9,800)/10,000}*100, or 2%.
Quantitative revenue metrics
Let’s go through some key quantitative revenue metrics that will help you monitor the revenue performance and find areas for improvement.
10. Customer lifetime value
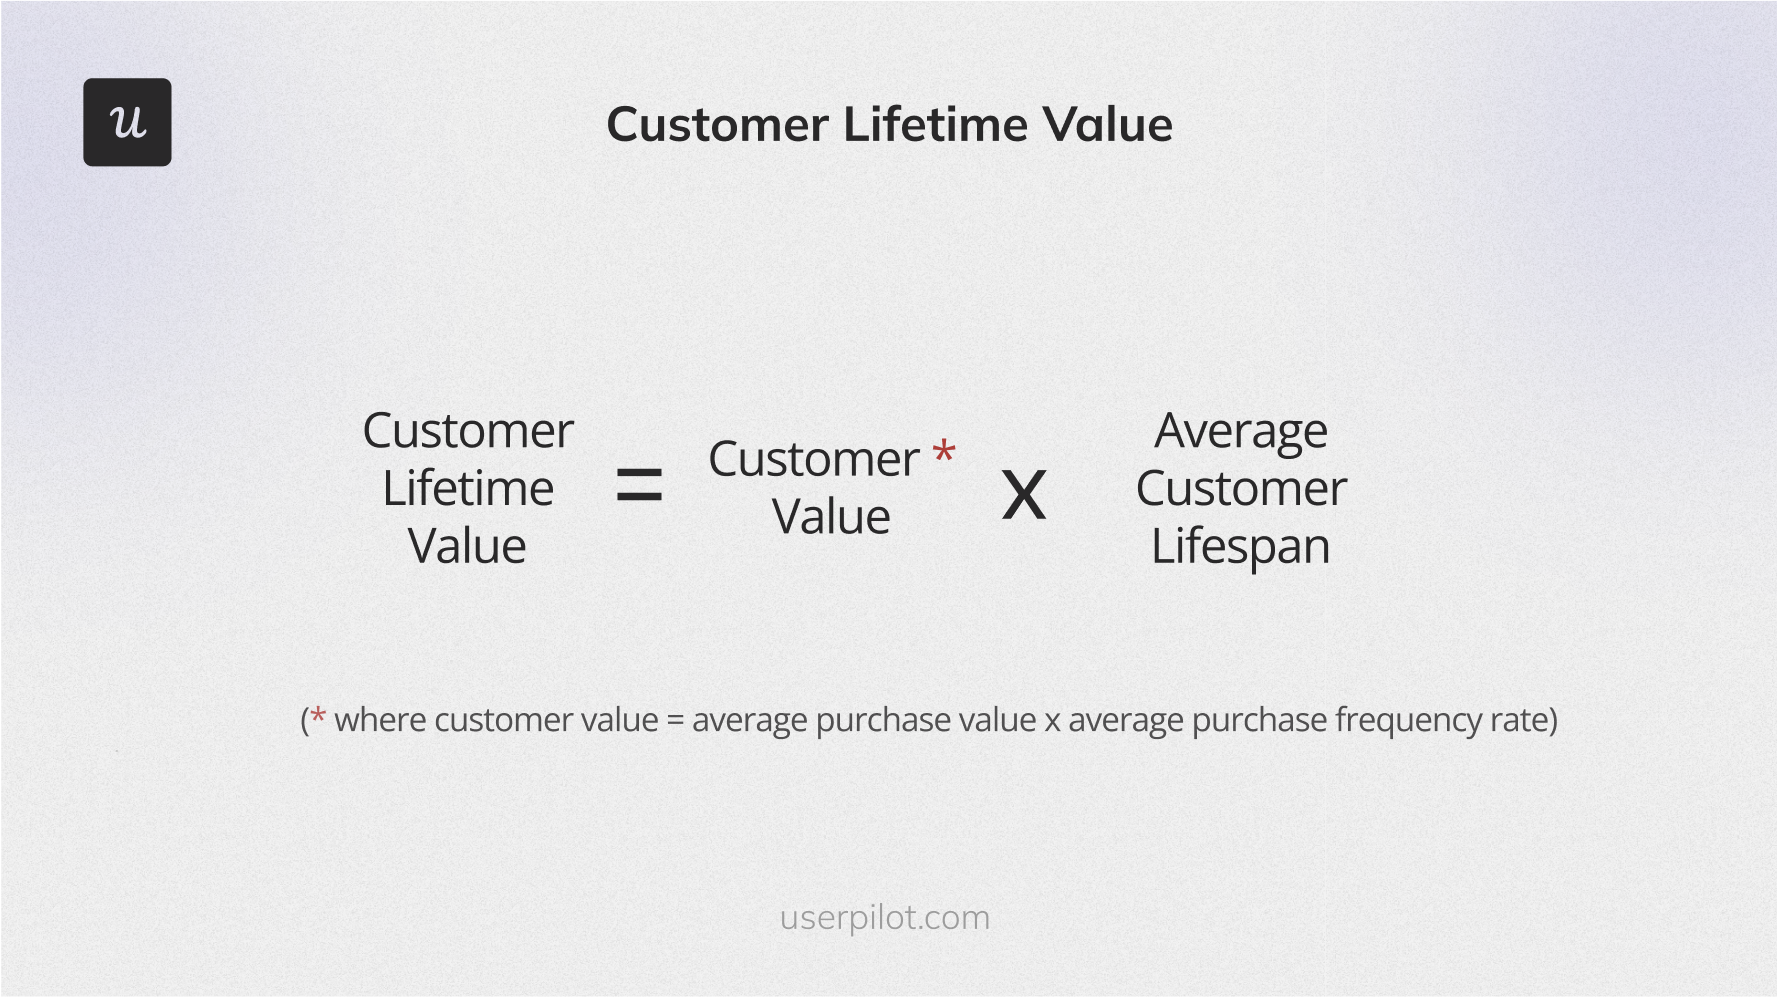
Customer lifetime value (CLV or LTV) refers to the average amount of money your business earns from an average customer until they remain a paying customer. It helps you determine how much value a customer brings and strategize plans to retain more customers accordingly.
You can calculate CLV by dividing the average revenue per account (ARPA) by the customer churn rate for a period.
Suppose your ARPA is $1,000, and your customer churn rate is 5%. Then your CLV is (1000/.05), or $20,000.
11. Net profit margin
Net profit margin measures how much profit a company makes from its products and services after subtracting all expenses. It tells creditors and investors about the financial health of your business more than gross margin does.
Before investors commit their resources to any business, they refer to its net profit to determine whether it is worth their money.
Net profit margin can be calculated by deducting all company expenses from its total revenue; dividing the value by the total revenue and multiplying by 100.

12. Monthly recurring revenue
The MRR measures your predictable total revenue each month. It gives you a short-term view of your revenue trends and can be a great predictor of cash flow and financial health.
The MRR is calculated by multiplying the average revenue per user (ARPU) by the total number of users in a month. To get a longer-term view of revenue trends, calculate the annual recurring revenue.
Suppose your business’ ARPU is $150, and the number of accounts in a month is 200. Then, the MRR would be (150 x 200), or $30,000.

How can Userpilot help you track quantitative metrics?
A comprehensive product growth tool like Userpilot makes tracking and analyzing quantitative metrics a breeze!
Here are some of the Userpilot features that can assist you in this process:
Collect and analyze quantitative customer feedback data
Userpilot’s in-app surveys are a reliable method for collecting quantitative data on user sentiment and overall satisfaction.
You can use different templates o and trigger them at relevant touchpoints to measure metrics like NPS, CSAT, and CES.

Use analytics dashboards for tracking key metrics at a glance
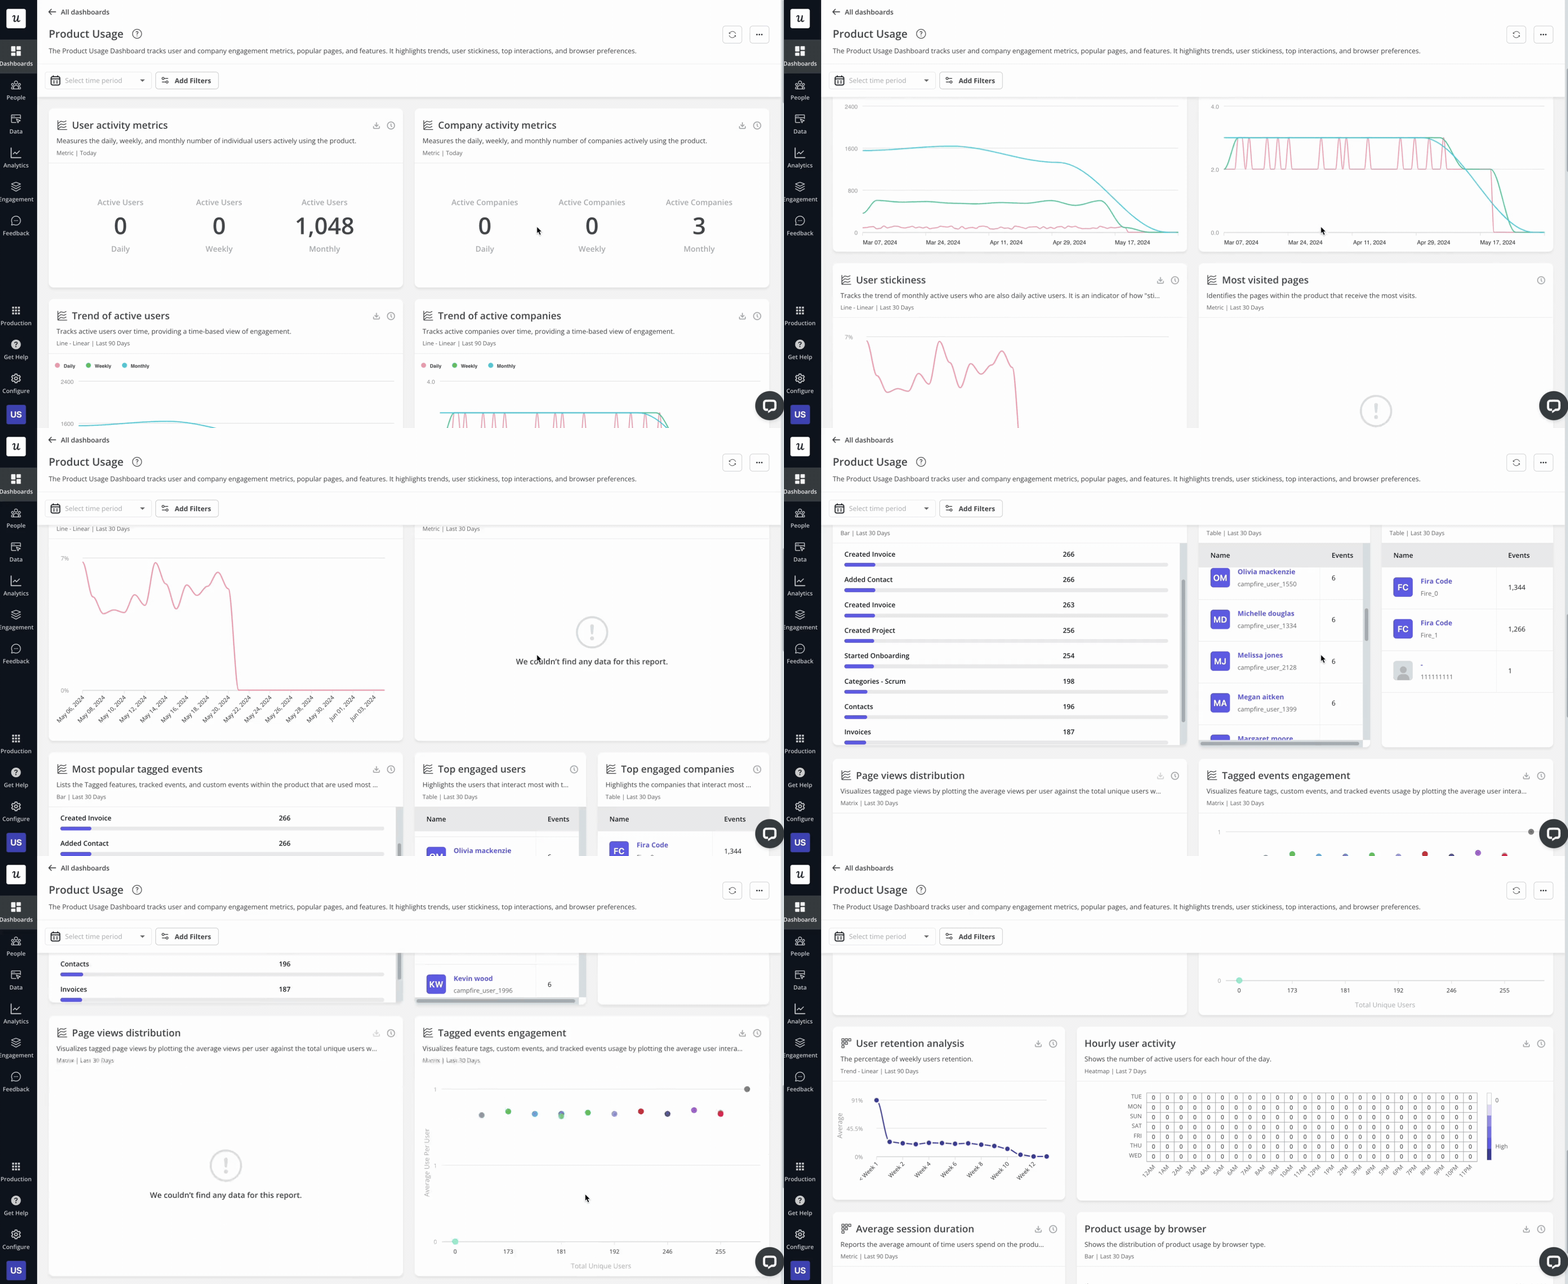
Userpilot comes with template analytics dashboards, such as product usage dashboard, new user activation dashboards or customer engagement dashboards.
You can also create custom dashboards and reports to keep track of metrics that are relevant to your business in real-time.
For instance, you could build a customer retention analytics dashboard and include all metrics that you find relevant, such as customer stickiness, NPS, or last accessed date.
Create cohort analysis reports to analyze retention rates
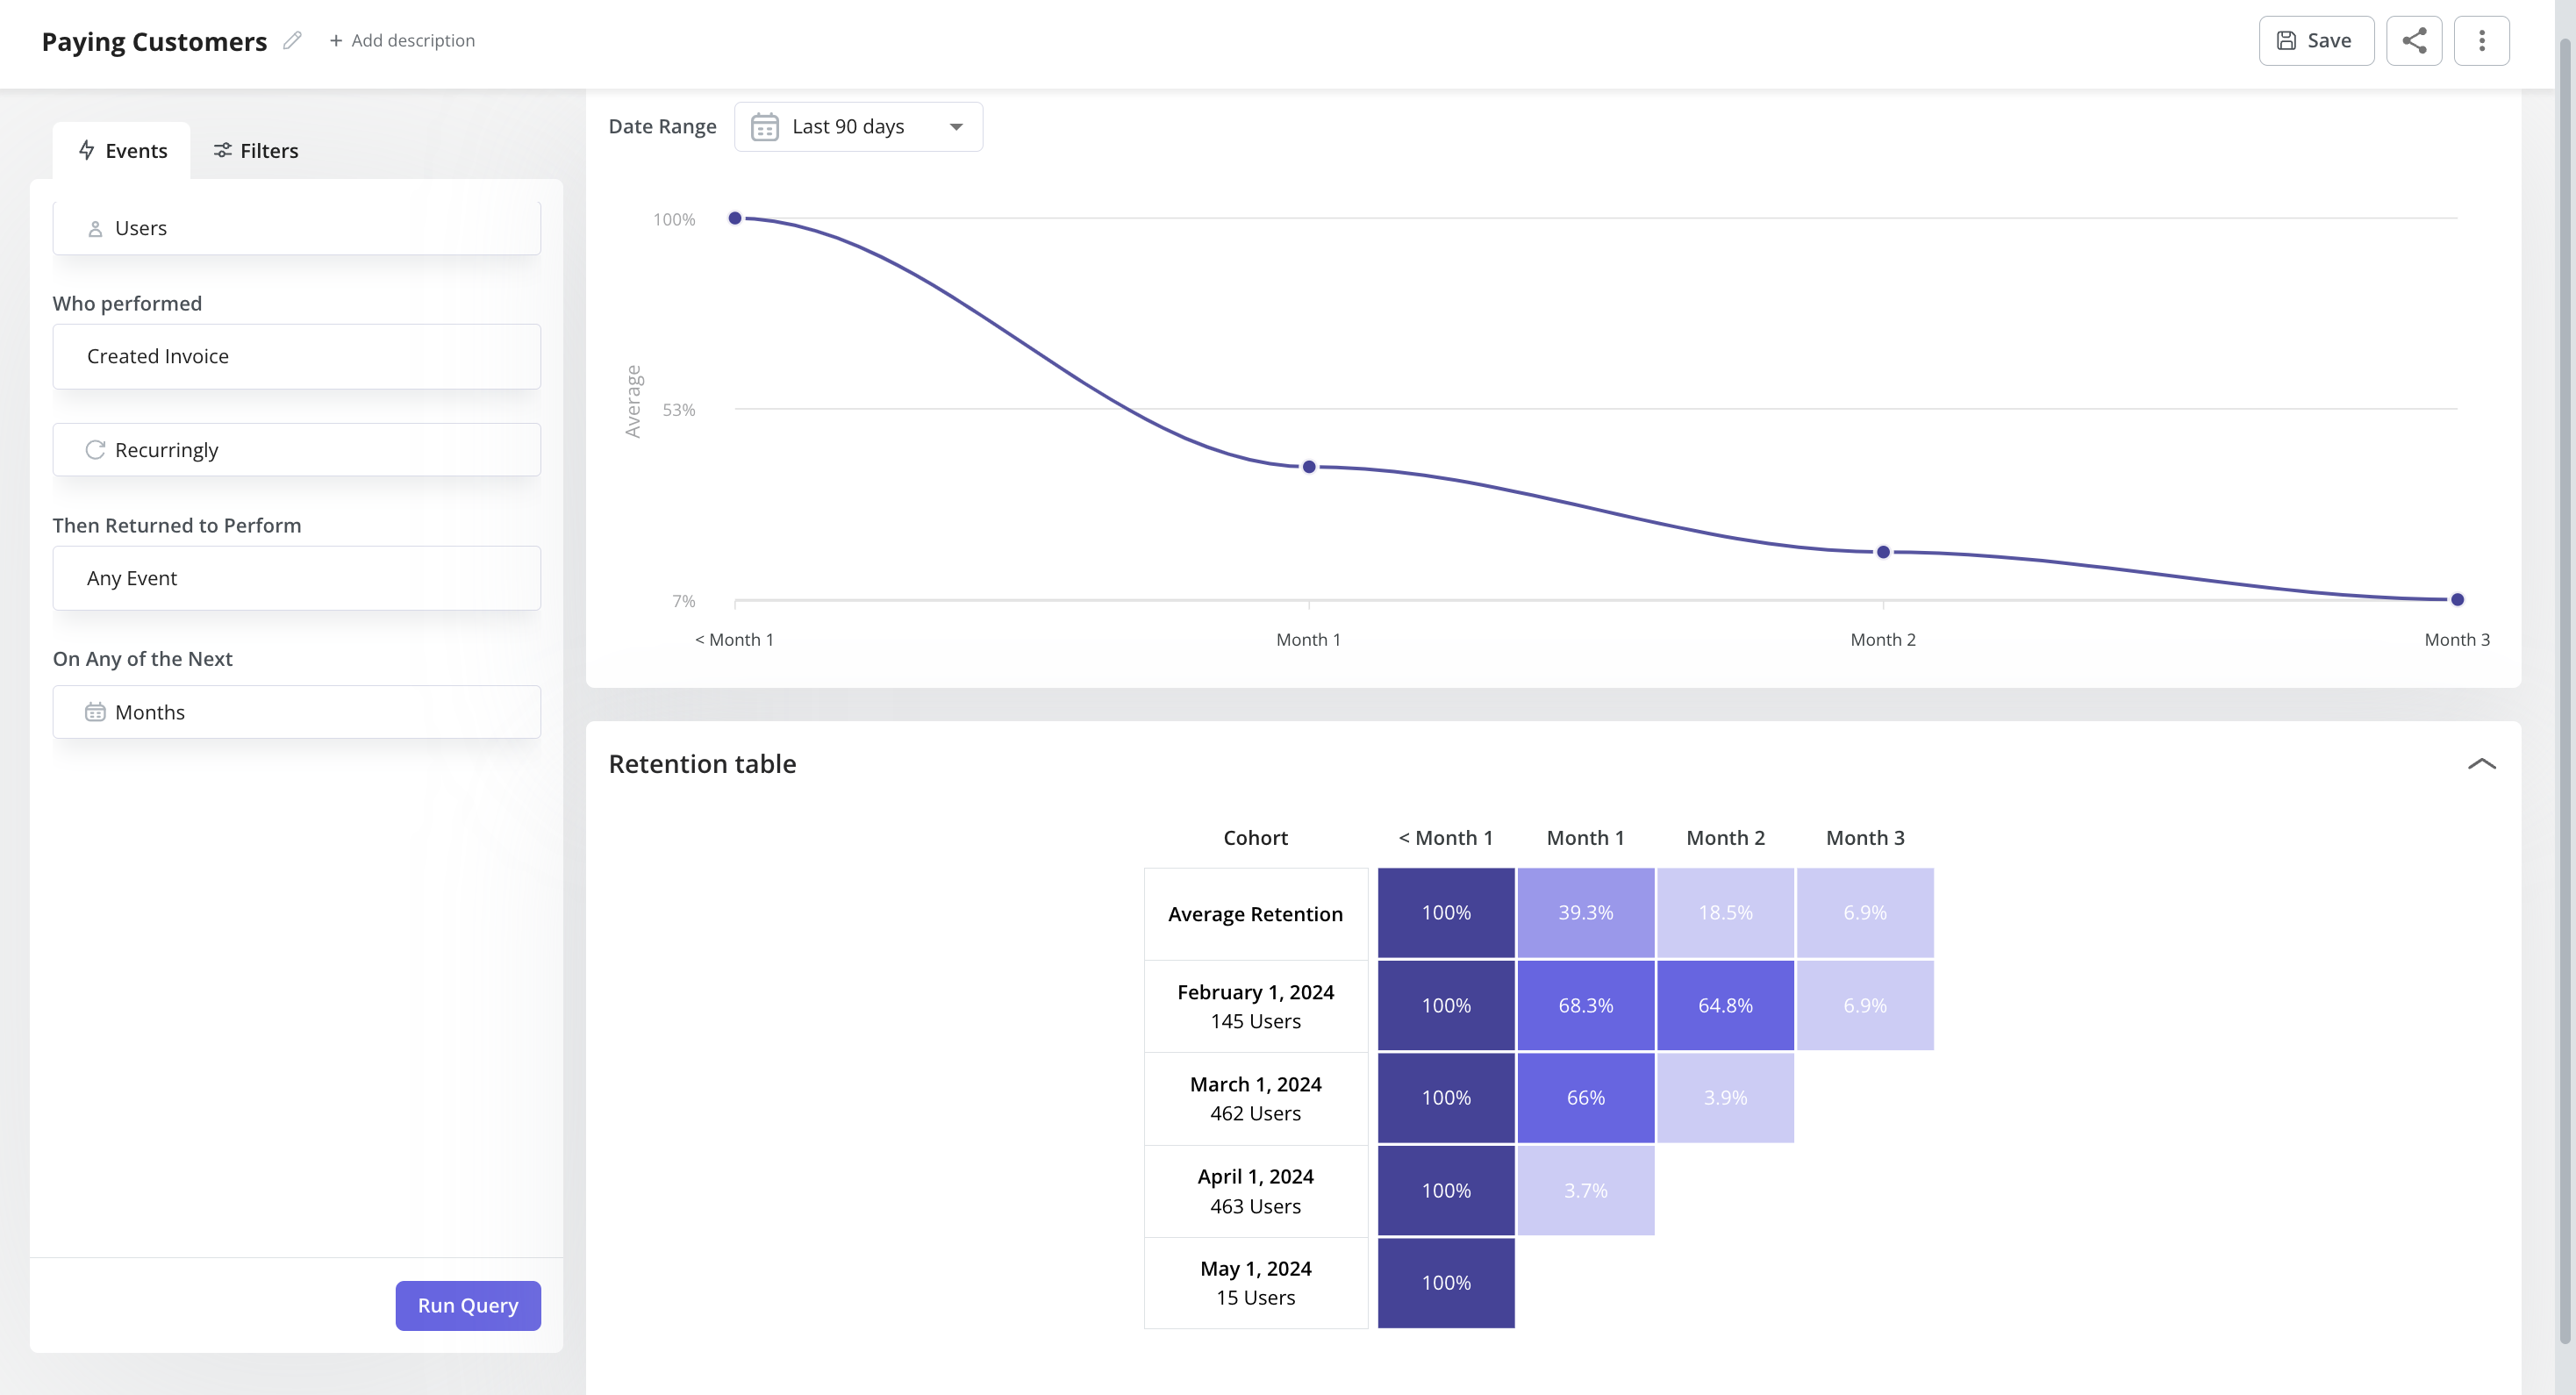
Cohort analysis lets you group users based on shared characteristics or experiences, allowing you to analyze their behavior over time and identify trends, patterns, and the long-term impact of changes on user behavior.
For example, let’s say you recently released a feature and want to measure its impact on user retention. Via a cohort table, you can group users who started using your product after the update and compare their retention rates to previous cohorts.
Conclusion
By regularly monitoring key quantitative metrics, SaaS companies can identify growth opportunities, address challenges early, and optimize their product to stay ahead of the competition.
Want to track and analyze quantitative metrics code-free?
Get a Userpilot demo to learn more about how our comprehensive analytics features can assist you in this process.


