RFM Analysis (Recency, Frequency, Monetary) in SaaS: The Product Manager’s Guide
What is RFM analysis? How relevant is it to SaaS product management?
These are just a couple of questions we’re answering in the article.
We also look at how to carry out the RFM analysis and some SaaS-specific examples.
Intrigued? Great, let’s get right to it!
Try Userpilot Now
See Why 1,000+ Teams Choose Userpilot

What is the RFM analysis (recency, frequency, and monetary)?
RFM analysis is a tool that allows marketing, sales, and product teams to segment users to improve product engagement, and customer retention, and increase their lifetime value (CLTV).
RMF segmentation uses real-life user behavior data for quantitative ranking of customers on three dimensions: recency, frequency, and monetary value.
RFM metrics explained
What we mean by recency, frequency, and monetary value very much depends on your role in the organization and your objectives.
RFM analysis: recency score
The recency score depends on the last time the customer interacted with the product.
For the marketing or sales teams, the interaction could be the last time they purchased the product, renewed the subscription, or bought an add-on. This matters because users who purchased something recently are more likely to do it again.
Product managers will focus on the last time the customer used the product or a particular feature.
Recent customers, scoring high on this dimension, could be a good group to approach with interview requests or surveys because the interaction is still fresh in their minds.
RFM analysis: frequency score
The frequency score is determined by how often the customer interacts with the product.
For sales or marketing teams, the frequency of interactions will be how often the customer makes a purchase within a period of time. Customers scoring high on this dimension are valuable because they are likely to buy again.
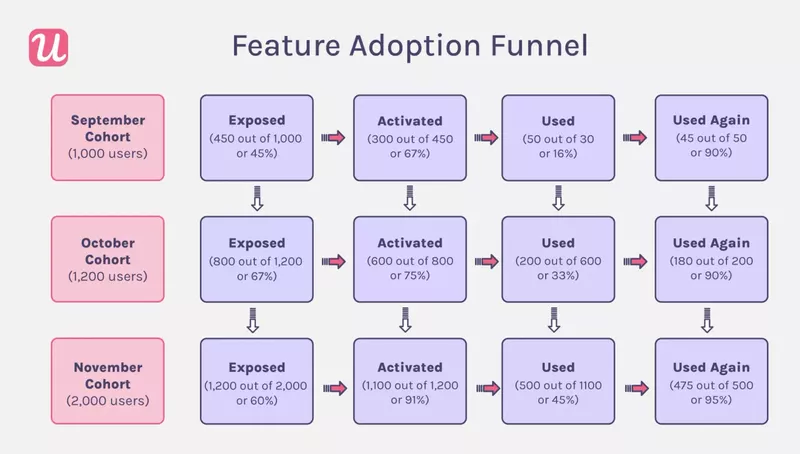
Product managers, on the other hand, will be interested in how often customers use the product or feature. Frequency is important because it’s an indication of the adoption rate among existing customers.
RFM analysis: monetary value
What makes up monetary value is dependent on the product.
For many businesses, which sell products or services directly to the customers, it is the Customer Lifetime Value (CLTV). It is how much money the customer brings to the business over the duration of the business relationship.
So in commerce, this could be the total value of all purchases over a period of time. In SaaS, that’s the money generated through subscription renewals and upgrades.
Of course, the customers who spend the most are the most valuable group. What’s more, they are more likely to spend even more in the future.
For organizations whose revenue doesn’t come from direct customer payments may use engagement metrics instead of monetary ones for RFM segmentation. For example, you could rank your customers based on the number of website visits.
How does the RFM analysis help product managers?
RFM allows product managers to make data-driven product decisions, and improve adoption rates.
Identify repeat customers’ behavior
RMF analysis allows you to identify the customers that bring the most value to the business.
Apart from their monetary value, tracking their behavior can give you valuable insights into product usage.
For example, you may be able to identify the features that drive the most value for your users. Next, you can prioritize the features and invest in their incremental innovation to deliver even more value.
Increase product adoption
What you learn about your most valuable customers also helps you boost product adoption among other customer segments.
Users who get good value from the product tend to be competent users. Analysis of their interactions with the product can help you identify successful usage patterns.
Once you know their happy paths to value, you can easily guide the other user cohorts with similar JTBDs and shorten their time to value.
Predicting future customer behavior
The RFM model helps teams predict future customer behavior.
For example, customers who have made a recent purchase are more likely to buy again in the near future. Similarly, historical spending behavior can be an indication of future spending.
In SaaS products, the most active users are more likely to engage with your product again whereas new customers who don’t engage with the product enough will most likely churn.
However, be aware of the limitations of using historical user behavior data to predict future behavior. For example, it doesn’t take into account past promotions, seasonality of user behavior, or unique circumstances that might not occur again.
Steps to perform an RFM analysis
The RFM analysis consists of 4 main stages.
Define your model
To start with, you need to choose a KPI for each dimension that you will use to rank the customers. The choice will depend on your product and your goals.
For example, for recency, this could be the date of the last purchase or the last interaction with the feature.
For frequency, these could be sessions/visits or the number of conversions. Monetary value could be measured via CTLV or based on the pricing plans customers use.
Next, you need to design a scoring system for each of the three dimensions. To this, you need a scale, like 1-10, and criteria for assigning the values.
For example, when looking at frequency, an hourly use could be 10, daily – 3, weekly – 5, and so on. This will very much depend on the product.
For a language learning app like Duolingo, daily usage would be the norm, whereas for accounting software it could be monthly.
Alternatively, you could divide your users into 3-4 groups based on their performance in each of the criteria. For example, the top 33% would be 3, the middle 33% would be 2, and the bottom 33% would be 1.
Choosing the right scale is not easy.
If you use a 1-10 scale, that’s 1000 unique segments (10x10x10=1000). Such detailed segmentation doesn’t make sense unless you are able to differentiate your approach for each of them.
1-3 scale, on the other hand, gives only 27 segments (3x3x3=27) so it’s easier to accommodate them but may be too general for relevant and personalized communication.
Identify your groups based on RFM scores
Once you have your model defined, it’s time to segment the users.
To be able to do that, you will use product usage data. Sales teams can easily pull it from their CRMs, while product managers can leverage user behavior data collected with analytics tools like Userpilot, Amplitude, or Heap.
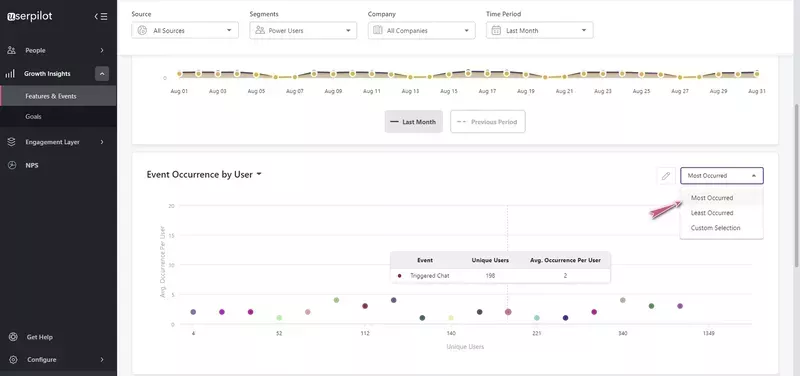
The raw data on user engagement allows you to score your customers on each of these dimensions, and run the RMF analysis. You can do it in a spreadsheet like Excel or Google docs.
Averaging all the recency, frequency, and monetary values together is an easy way to identify the most and least valuable customers.
However, depending on your goals, you may choose to weigh some of the values differently. For example, the frequency may be more important in certain situations and that’s what you can prioritize.
What’s more, it’s useful to segment users on just one of the axis, for example, recency.
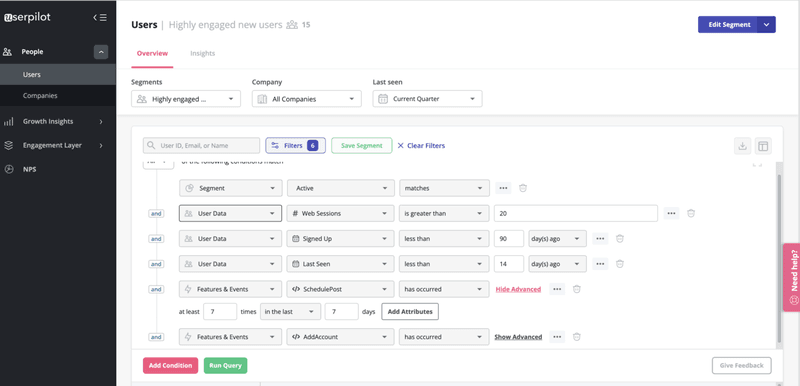
Select the segment to focus on
Now that you have divided your customers into segments, you need to choose the ones to concentrate on to realize your objectives.
For example, the power users, who score high in frequency and recency, can help you identify the most successful behavior patterns in the product.
At the same time, their high and regular engagement means they are satisfied with your product. If you’re concerned about high churn rates, this user segment may not be your biggest priority. Unless you get really complacent, there’s little risk of losing them.
So instead, you can focus your energy and resources on re-engaging users that have churned.
When you do so, you may want to prioritize the users who brought higher monetary value. Or those who churned only recently because there’s a greater chance of winning them back.
Build an engagement playbook
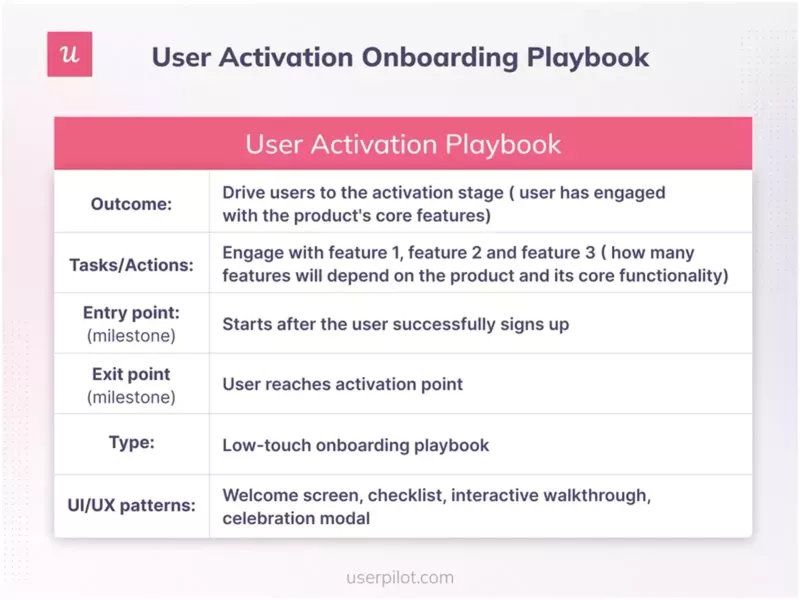
After segmenting your users and identifying the key ones, build a playbook for each of them.
The playbook should define your goals or outcomes for each customer group. More importantly, it needs to outline how you are going to engage them to realize your goals.
For example, you can use loyalty programs to further boost the loyalty of your best customers. For the churned customers, on the other hand, you may want to deploy a re-engagement strategy built around emails.
To complement these strategies on mobile, Userpilot helps you onboard and engage mobile app users by creating personalized messaging, push notifications, and surveys.
RFM customer segmentation examples
Let’s look at a few examples of typical SaaS user segments, their characteristics, and different approaches to their engagement.
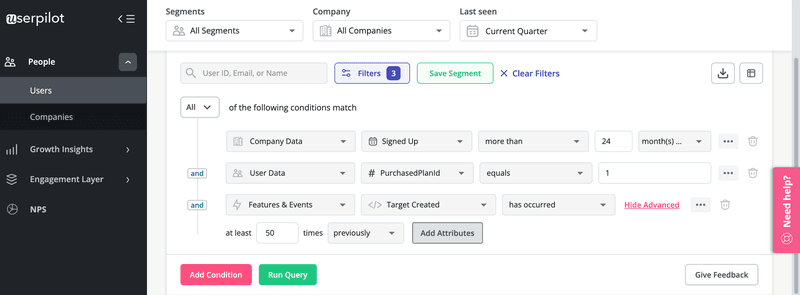
Loyal customers
Loyal customers score high on the frequency and recency metrics.
Even if they are not on the highest plan, their repeated subscription renewals add up over time and result in high lifetime value.
Apart from bringing a steady income, loyal customers are great for SaaS businesses because they make ideal beta testers and are likely to promote your product via referral schemes or word-of-mouth marketing.
What’s more, their retention requires relatively little effort. Schemes rewarding them for their loyalty, like early access to new functionality will do the job. Of course, that’s as long as you keep innovating and adding value to the product.
Valuable customers
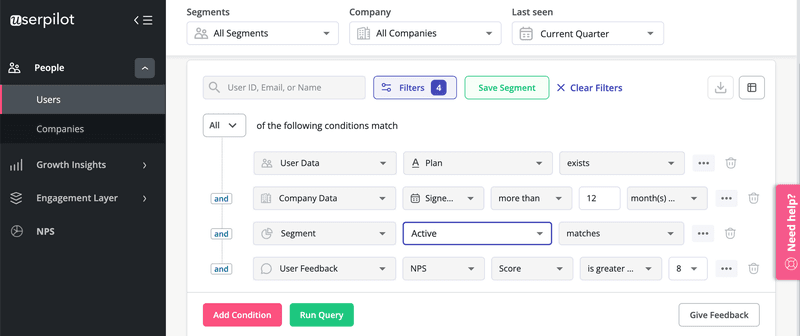
Valuable customers are highly active and have long retention just like the loyal customer segment. However, they also bring the most money because they are on the highest plans.
They could be a small group, 20% or so, but they bring as much as 80% of all business.
Apart from the high monetary value, tracking their product usage can reveal insights into successful users’ behavior. The fact that they are ready to spend their money on premium functionality means that they get a lot of value from it.
If you can identify the trends, you can find new upsell opportunities for other customers on lower plans. If not, making them emulate the behavior of successful users will drive adoption.
As these users are bringing you a lot of revenue, you must keep them constantly engaged and make them feel valued. You can do it by providing them with higher levels of customization or dedicated customer support.
Low-spending active customers
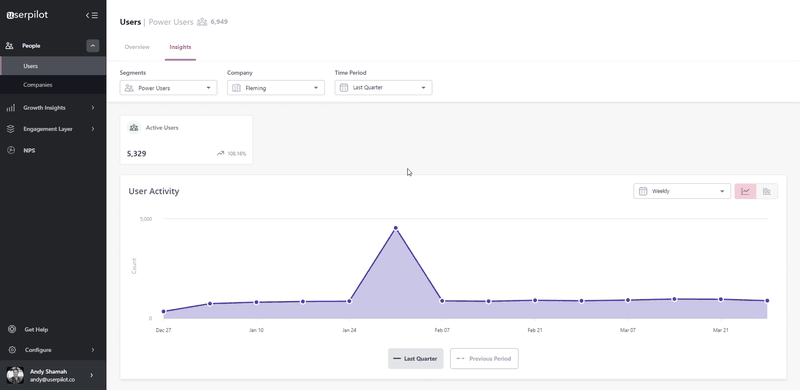
Active customers use your product frequently and score high on recency too, just like the other segments, but they bring less income. That’s because they are on the free or lowest plans.
Your playbook for this group should focus on rewarding these users for their loyalty while encouraging them to upgrade to higher plans and spend more. You could achieve that by offering them exclusive offers or referral schemes.
At-risk customers
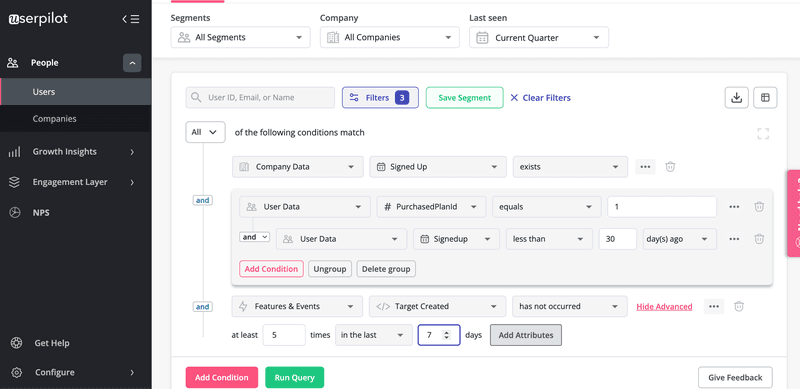
At-risk customers are inactive and their subscription is about to expire.
As they are not experiencing value from the product, they are not likely to renew their subscriptions. If you don’t want to lose them, you need to re-engage them and lure them back to the product.
You can do this by offering them discounts or exclusive offers. Make sure they know about new feature releases as lacking functionality could be a reason for their churn.
Even if you don’t manage to win them back, such users can be a source of valuable insights into how you can improve the product for others, so always reach out to them with feedback requests.
Conclusion
RMF analysis is a valuable tool whose primary use is to segment users for targeted engagement. Product teams can also use it to identify the most valuable functionality and make informed decisions about their development in the future.
If you would like to see how Userpilot can help you conduct RMF analysis and segment your users, book the demo!




![What are Release Notes? Definition, Best Practices & Examples [+ Release Note Template] cover](https://blog-static.userpilot.com/blog/wp-content/uploads/2026/02/what-are-release-notes-definition-best-practices-examples-release-note-template_1b727da8d60969c39acdb09f617eb616_2000-1024x670.png)