If you don’t measure churn, you can’t fix it. And if you’re not fixing it, you’re leaving serious money on the table.
The companies that succeed are the ones that perform thorough churn analytics to identify the warning signs and patterns associated with churn and take proactive measures to address them.
In this guide, we’ll go beyond basic churn rates and into advanced analytics, covering:
✔️ How to accurately analyze churn;
✔️ Predictive models to spot at-risk customers before they leave;
✔️ Actionable strategies to reduce churn and improve retention.
Try Userpilot Now
See Why 1,000+ Teams Choose Userpilot

What is churn analytics?
Churn analytics, also known as customer churn analytics or customer attrition analytics, refers to the process of analyzing and understanding why your existing customers are leaving the product.
The goal of interpreting customer churn data is to pinpoint the factors that lead to attrition so that you can take proactive measures to retain customers and improve customer loyalty.
Is your churn analytics strategy proactive or reactive?
Don’t wait for customers to leave. Take this 4-step assessment to see if you’re effectively using churn analytics to retain revenue.
Why is it important to track churn analytics data?
Analyzing customer churn will allow you to detect and eliminate the main pain points in the user journey and provide a better user experience.
More specifically, churn analytics will help you to:
- Improve customer experience: The sooner you perform churn analysis, the quicker you will receive user feedback and uncover what hurts your customers most. As a result, you will improve the overall customer experience across your product and reduce customer churn.
- Identify friction points: As you track user behavior across the customer journey for churn analytics, you can detect critical technical issues, bugs, and friction points that your customers encounter so that you can prioritize and fix them ASAP.
- Optimize the product: A customer churn analysis will give you data to optimize your products, whether your UX was misleading or your onboarding wasn’t up to par.
- Increase customer retention: Taking proactive measures towards preventing churn will help you increase retention and drive growth when you can increase customer lifetime value.
What are the reasons for customer churn?
Here are the most common reasons why customers stop paying for your product, according to the Zopka study:
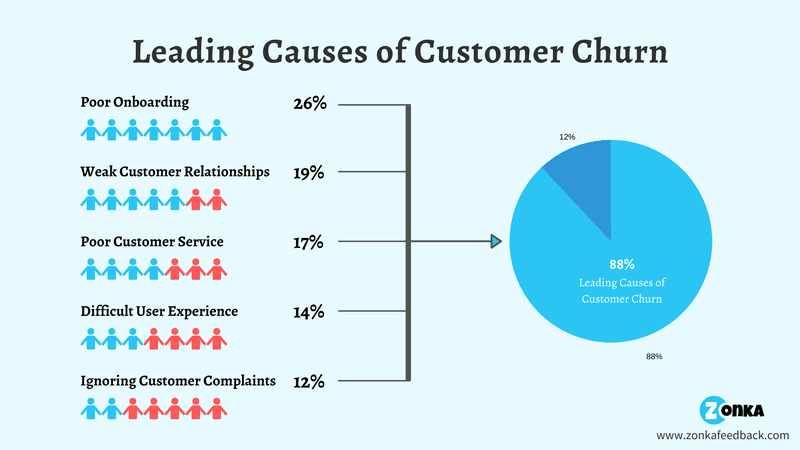
- Poor onboarding: Long non-personalized product tours and a lack of in-app guidance can confuse users and prompt them to churn when a good in-app onboarding gets customers to the “Aha!” moment in the fastest way possible and decreases the likelihood of customers churning.
- Poor customer service: Excellent and timely customer support is key to customer satisfaction. Insufficient customer support and a lack of in-app help centers, articles, and other tutorials can cause customers to say goodbye.
- Unfulfilled expectations: When it comes to acquiring new customers, the worst thing you can do is lie to them and set unrealistic expectations. Check your website copy for fluff and make sure your product works as it is described. Also, get your sales team to a mutual understanding regarding this issue.
- High pricing can also result in customer churn and a lost revenue stream. Particularly if your product does not boast a “killer” feature that everyone is willing to pay top dollar for. Try to adjust your pricing line to the market and see if it works.
How to perform customer churn analysis?
Here we will go through methods that help you analyze customer churn and identify reasons why you are losing customers.
Analyze NPS data to identify reasons for customer dissatisfaction
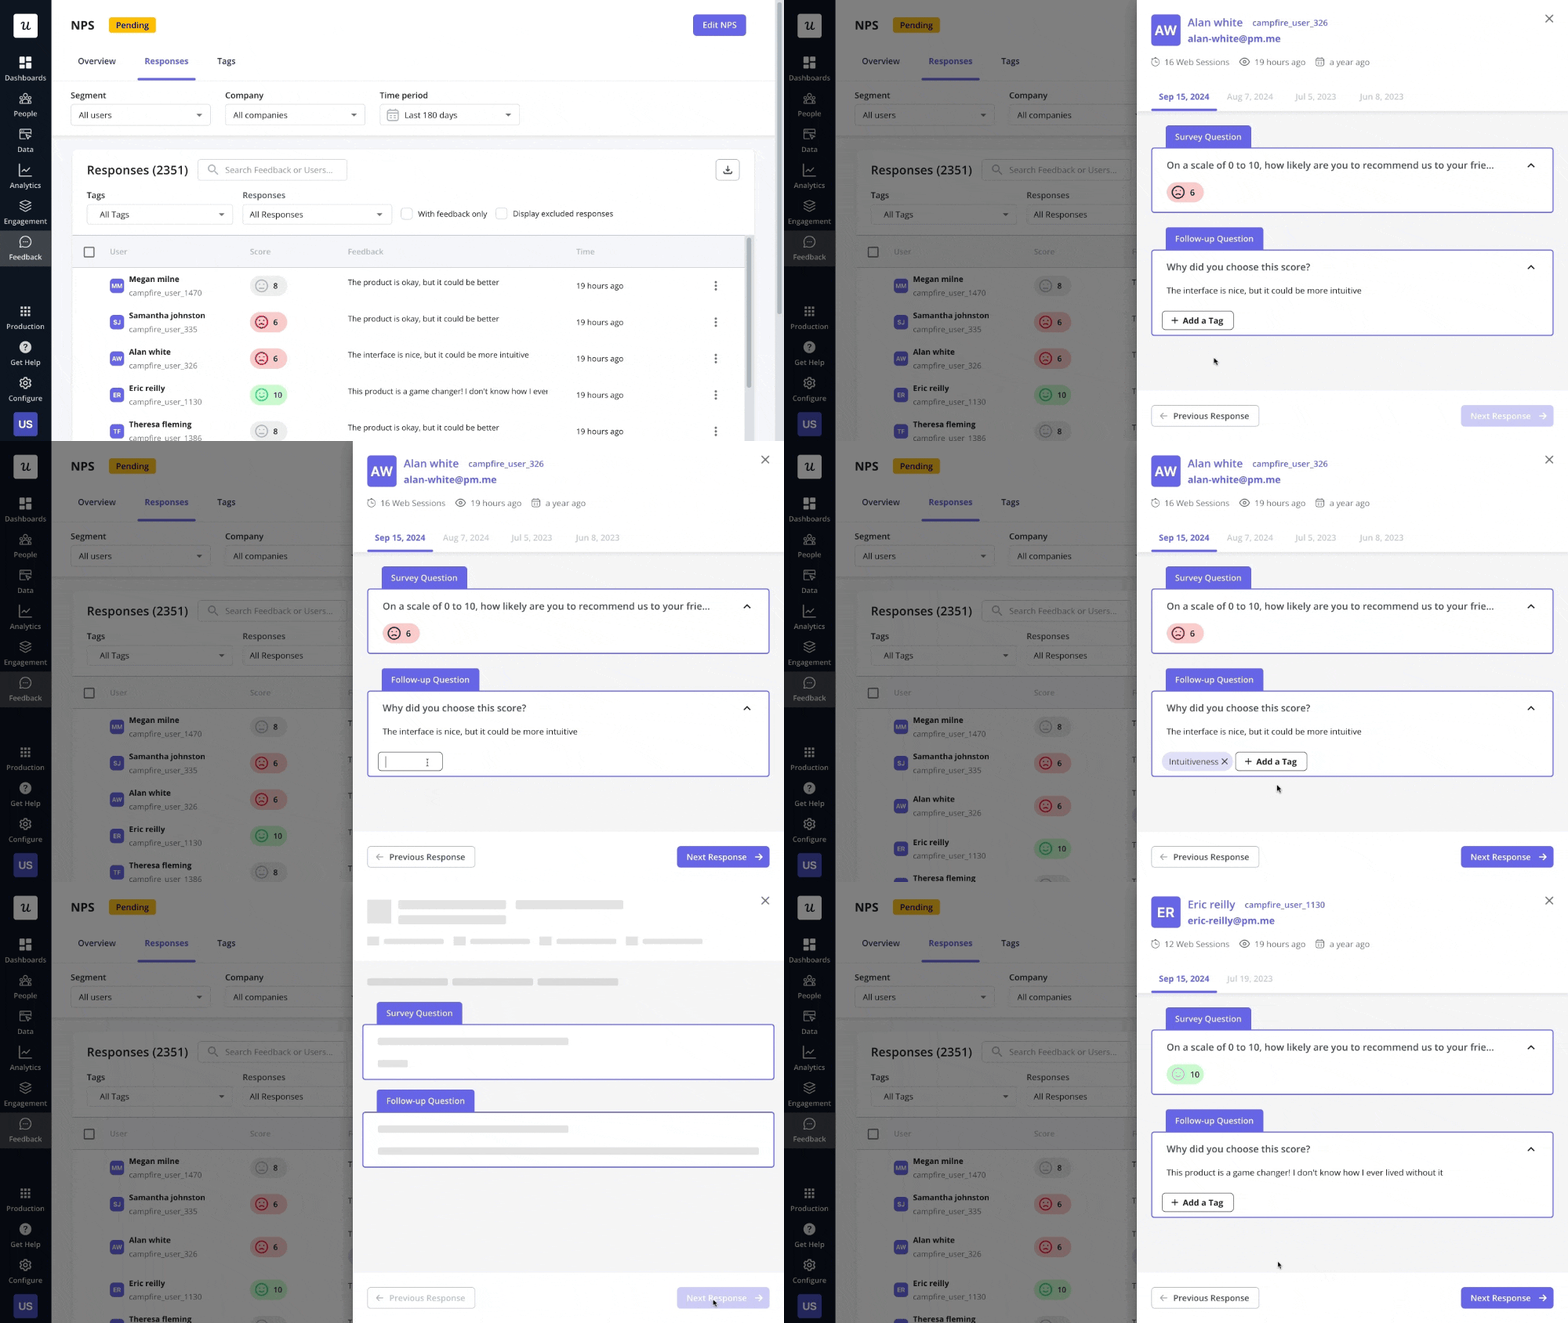
While NPS scores are a reliable measure of how high customer loyalty is, they can also reveal actionable insights into what part of your product experiences cause friction.
For one, you can monitor NPS scores over time to see if there are any correlations between product updates and score drops. For example, if you see your NPS decrease a week after a new feature release, it can signal a bug that’s causing user frustration and potentially leading to churn.
Apart from monitoring your NPS score pattern, you can also look at qualitative responses from follow-up questions. By tagging NPS responses, you will be able to see common issues among passives and detractors, and what made a user give you a low score.
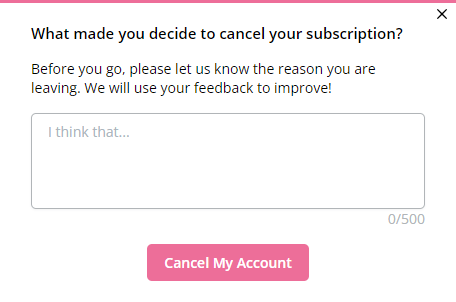
Use exit surveys to collect feedback from churned customers
Is there a better way to understand why users churn than asking them? Probably not.
Most successful companies like Asana and Slack realize this and that’s why they have a churn survey built into their cancellation flows.
This method isn’t only insightful but also very effective – in-app surveys are pretty easy to implement and scale using specialized customer feedback tools like Userpilot.
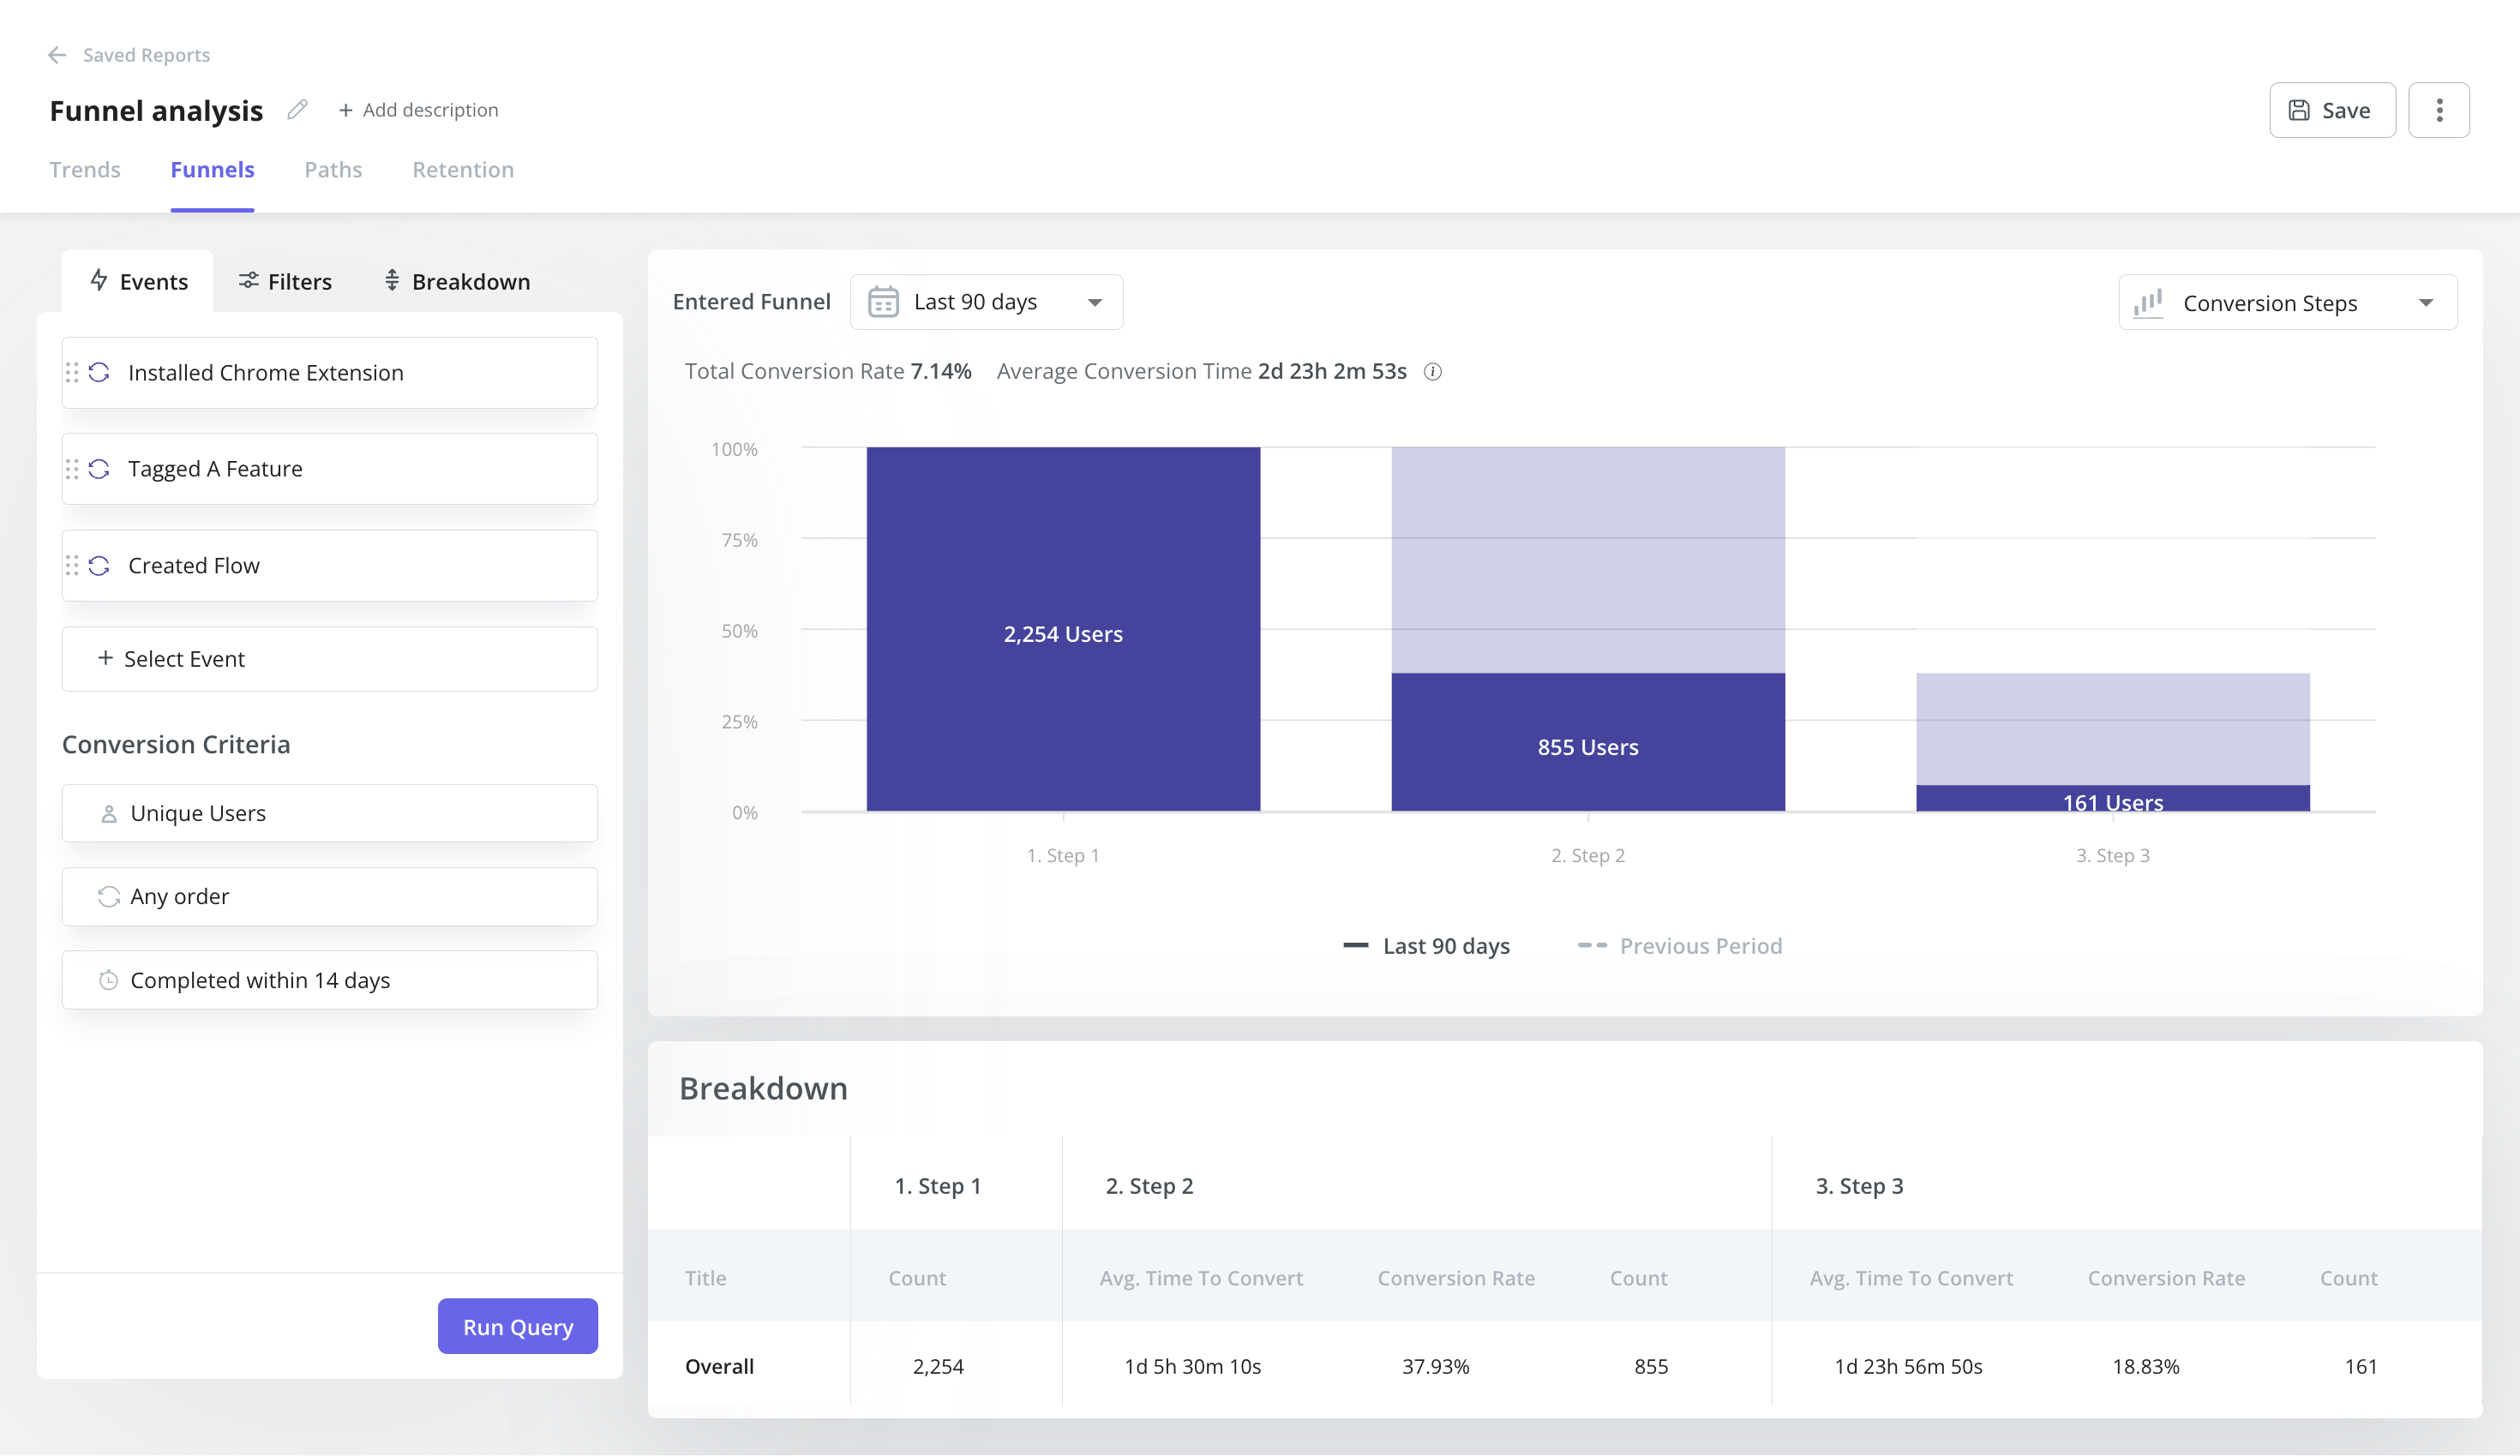
Monitor user behavior with funnels to identify drop-off points
Another way to analyze churn is to monitor user behavior and see if your customers are experiencing friction using funnels.
You can define important touch points across your customer journey, and track how your users make progress.
If there are drop off points, customers may be struggling or there are issues with your product. Then you can cross-check with customer behavior with that specific touchpoint to pinpoint the root cause.
For example, you notice traffic leakage at trial stage, you can go back to check if users have trouble finishing onboarding or if there is not enough onboarding guidance to drive adoption.
How to improve customer retention and reduce churn?
Detecting churn is important but taking measures to address customer issues and improve customer retention is also necessary. Here are the ways that you can reduce customer churn.
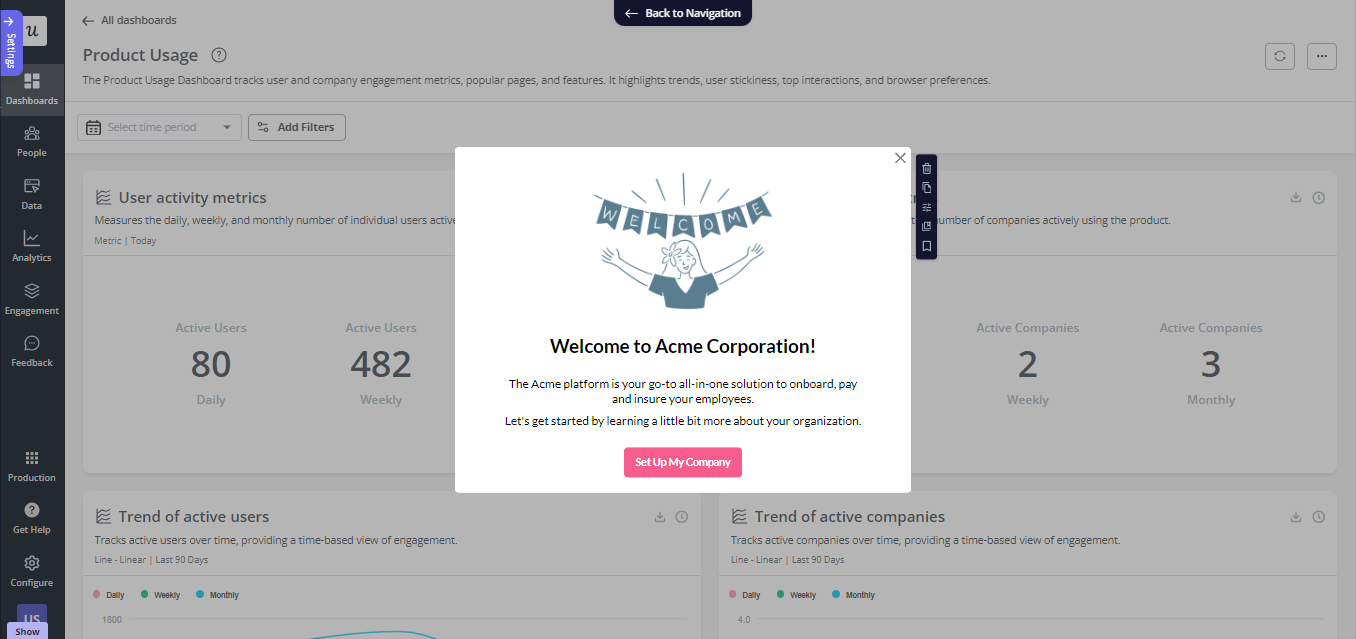
Personalize customer experience from the start
Personalizing the customer experience from the very beginning is a strategic method for preventing churn. By implementing a welcome survey during the onboarding process, you can gather valuable customer data regarding their preferences, needs, and expectations.
This data serves as a foundation for tailoring interactions and offerings to match individual tastes, effectively building a strong initial connection.
Trigger in app messages to address customer issues
You save at-risk customers by triggering in-app messages using automation to reach out to specific segments of users who are exhibiting churn behaviors.
By identifying these users and proactively addressing their concerns through targeted messages, you can significantly reduce the likelihood of them churning and reengage these customers.
For example, when certain users display patterns such as decreased engagement, infrequent logins, or a decline in feature usage, you can trigger tooltips to drive feature adoption.
Study loyal customers and replicate their happy paths
Studying the navigation paths and interactions of your loyal customers is also a potent churn prevention method.
By analyzing the behaviors of customers who have consistently engaged with your product, you can extract valuable insights to create optimized “happy paths” for all users, thereby enhancing their experience and reducing churn risks.
You can structure the experience around these paths, you guide new and at-risk users toward the same positive outcomes that your happy customers have achieved.
A/B test to optimize experience across the entire customer journey
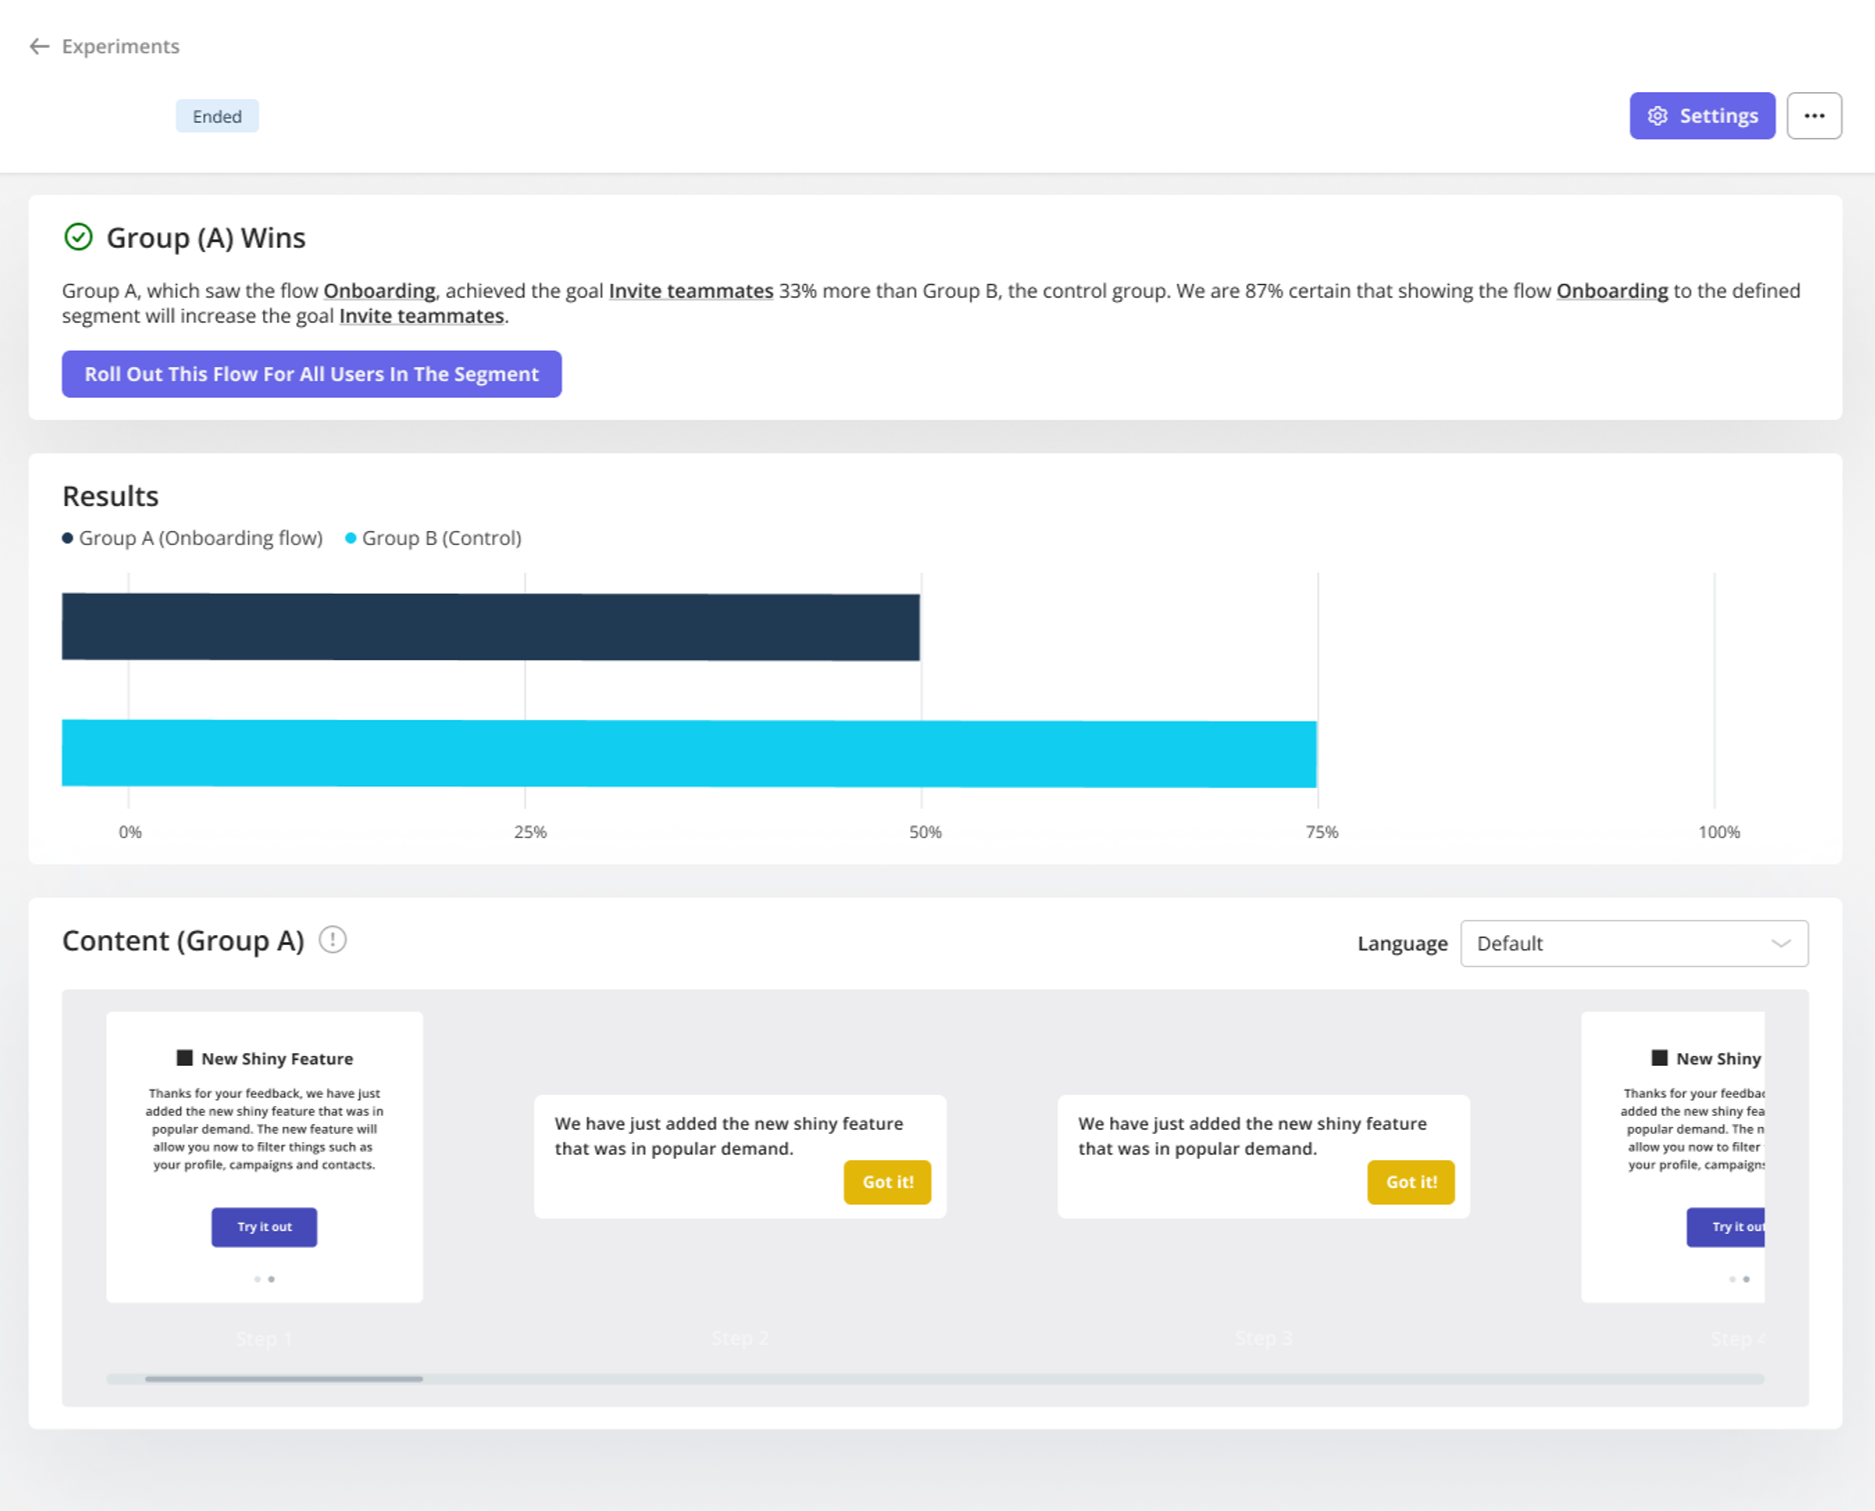
Leveraging A/B testing to optimize the entire customer journey is a powerful churn prevention technique. You can either use controlled A/B test or head to head A/B test to identify impactful changes that help customers adopt your product.
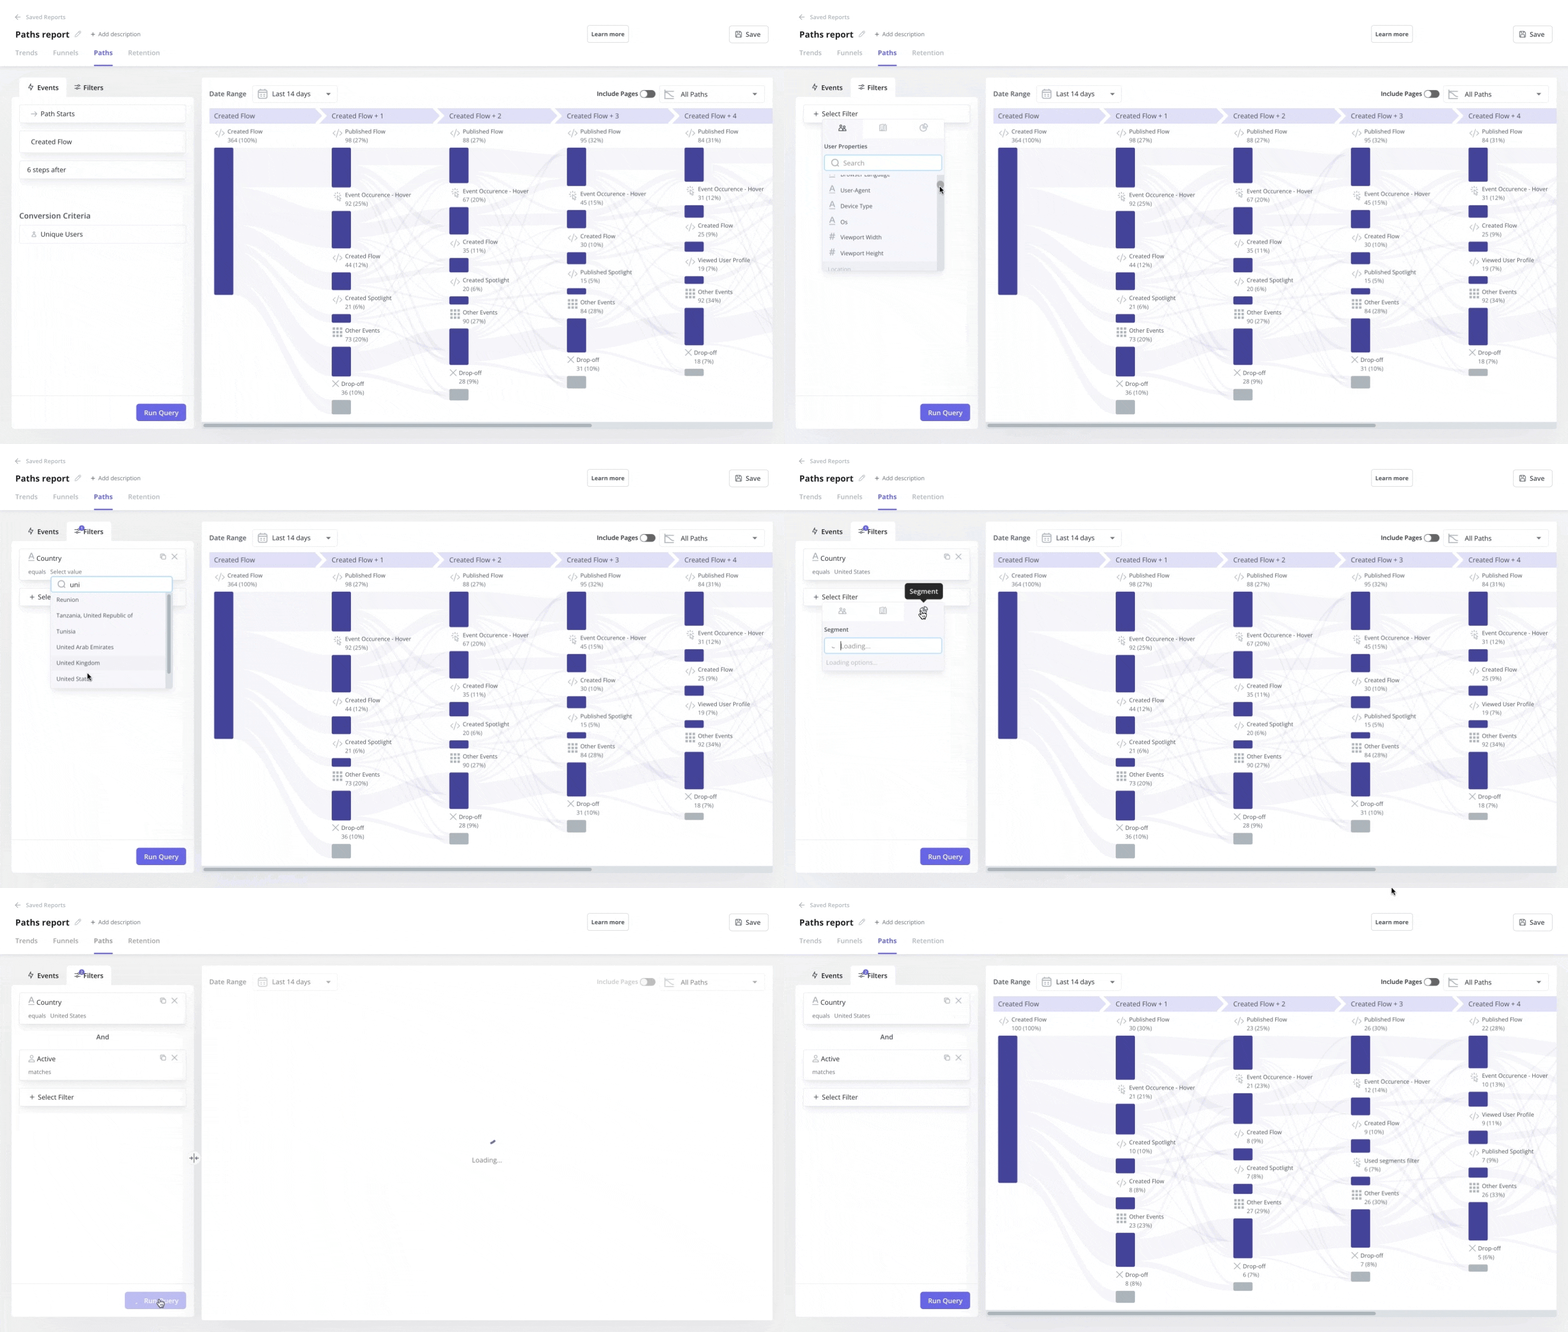
- In a controlled A/B test, you can roll out a new experience to 50% of your users while keeping the remaining 50% in a controlled group with nothing showing.
- In a head-to-head A/B test, you can create parallel experiences with the same underlying flows but differing features. For instance, you can provide an interactive walkthrough to 50% of users and tooltips to the other 50%. By analyzing how each group responds, you can compare the effectiveness of these features in helping users make progress and preventing churn.
Important customer churn metrics to track
Now let’s walk through the juicy part of the churn analytics journey and learn what churn metrics you should take care of.
- Customer churn rate: It shows what percentage of paying customers you lose every month.To find out your churn rate, take the number of lost customers over a particular period (a month) and divide it by the number of users at the beginning of that period. Multiply the result by 100.
- Customer retention rate: It works directly opposite and provides you with a percentage of how many customers stay with us from month to month.
- A customer health score is a metric used to understand the likelihood of a particular customer segment to grow, stay consistent, or churn.
- Customer engagement rate analyzes customer behavior and explains how often your users interact with your product and how many product features they engage with during the time period. This data enables you to recognize product onboarding issues and spot shortcomings in the product adoption flow.
- Customer satisfaction score: Discover what features your customers dislike and why.
- NPS score: Gauge the NPS score to identify at-risk customers and try to retain them.
Conclusion
Thoroughly performed, churn analysis is the one and only way to understand why users drop off. Hence, you can decrease the customer attrition rate and boost your company’s growth.
Want to get valuable insights into churn analytics? Don’t put it on hold! Get a Userpilot Demo and see how you can prevent impending customer churn.

