Want to know why users stick with your product or why they leave? You will need customer behavior analysis.
It is the process of collecting and interpreting user interaction data to uncover patterns and insights. This information lets you make informed decisions, improve your product, and boost retention.
So, in this guide, I’ll include everything from identifying user segments and collecting data to using these insights to improve your product!
Try Userpilot Now
See Why 1,000+ Teams Choose Userpilot

What is a customer behavior analysis?
Customer behavior analysis involves collecting customer data to obtain valuable insights into how users engage with your product.
By conducting customer behavior analysis, you can understand different customer segments’ preferences and develop well-informed marketing strategies to personalize their customer experience accordingly.
Moreover, by enhancing user experiences based on these insights, you can boost customer retention rates, ultimately increasing the customer lifetime value.
Why is customer behavior analysis important?
As product managers, you’re not just building features, you’re trying to solve problems for people. And to do that well, you need insights into what makes them tick. Therefore, here’s why analyzing customer behavior is a must:
- Identify trends to make predictions for future behavior: When you look at how users act, you start to see patterns. This enables you to identify high-value users, refine your product roadmap, and implement targeted retention strategies.
- Improve customer satisfaction and customer loyalty: Figure out what your existing customers like and don’t like, and fix the problems. Once you know what makes them happy, you can make those changes. That’s how you get loyal customers and increase customer lifetime value.
- Personalize customer experience to enhance retention: With behavioral data, you can spot at-risk users and understand the underlying causes of their dissatisfaction. From there, try to offer personalized experiences, such as contextual in-app guidance. Execute this effectively, and you’ll see improved retention rates.
How to perform a consumer behavior analysis in 6 steps
Performing consumer behavior analysis can sound daunting, but here’s how to perform it in six quick steps.
1. Identify your segments
To conduct a customer behavior analysis, you’ll first need to identify your customer segments. Here are some common ways to segment users:
- User properties such as demographics, interests, jobs to be done, goals, or pain points
- Company properties such as industry or company size
- Usage patterns, such as number of logins or most frequently used features
But the most important segment is always your ideal customer profile. These are users that get the most value out of your product and are the main drivers of revenue. They have the highest level of customer satisfaction and customer lifetime value.
Product growth is possible when you’re able to grow this segment and send more people down similar paths to higher customer satisfaction.
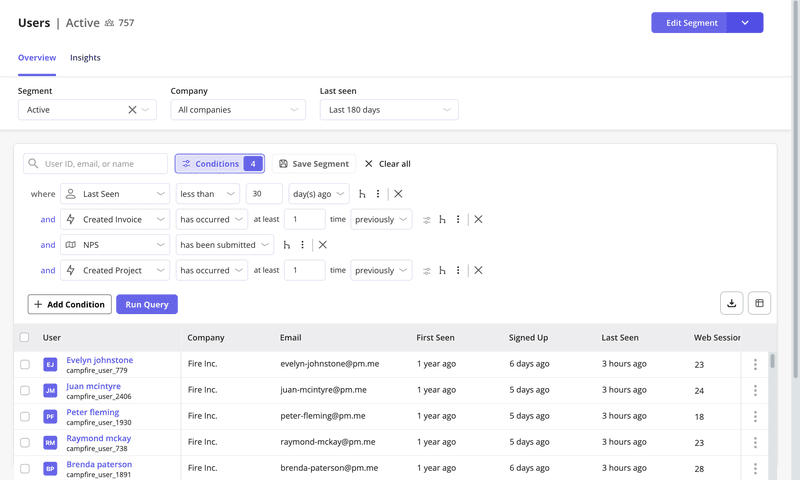
The second most important segment is at-risk customers. This is business you’re very close to losing. It’s essential to understand what might be leading them to abandonment and what you can do to make them stay.
Do you know the “Why” behind your user’s actions?
Tracking clicks isn’t enough. To drive retention, you need to understand behavior. Take this 4-step assessment to audit your customer behavior analysis strategy.
2. Identify how each segment benefits from your product
With your segments created, you can start analyzing consumer behavior to understand how important segments behave. This will help you flag features or experiences that lead to increased user satisfaction.
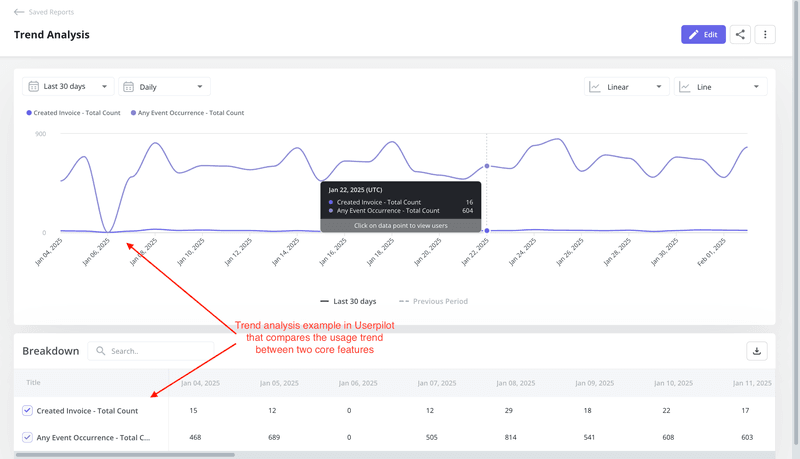
Customer analytics reports such as trend reports help you filter the view for your segments so you’re able to identify popular features and events for each user type. These can be integral for driving habitual buying behavior.
3. Collect qualitative and quantitative data to identify patterns
Access deeper insights with feedback from quantitative and qualitative data to answer the following questions:
- What do customers value most about your product?
- How do power users interact with different product features?
- Do they require additional training in your product or other forms of support?
- Which additional features do customers want, and are there areas of friction?
These will enable you to further boost product adoption and customer retention.
How to collect quantitative data
Use tools such as session replays and funnel analysis to collect quantitative data.
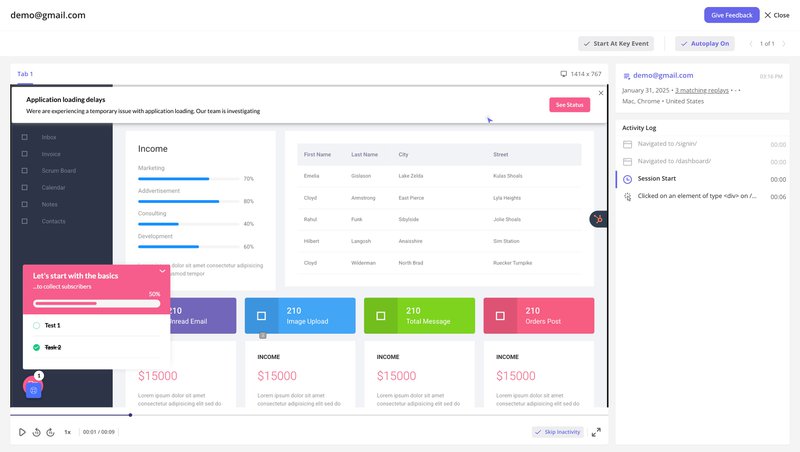
With session replays, you gain a first-hand view of how users interact with your product. You can observe their actions, identify points of friction, and understand their behavior in context.
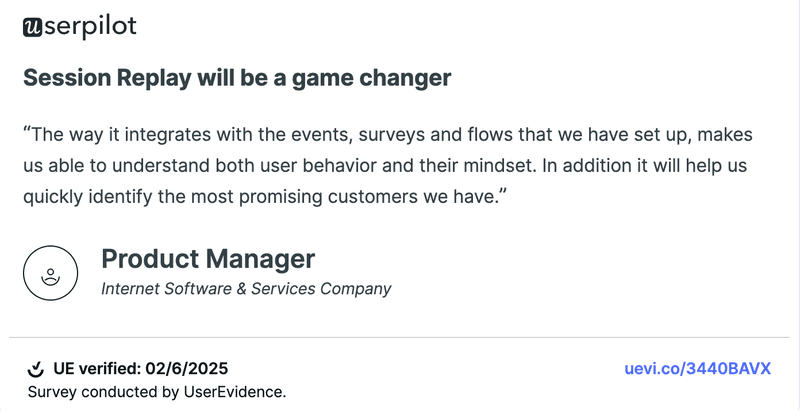
As our customers put it:
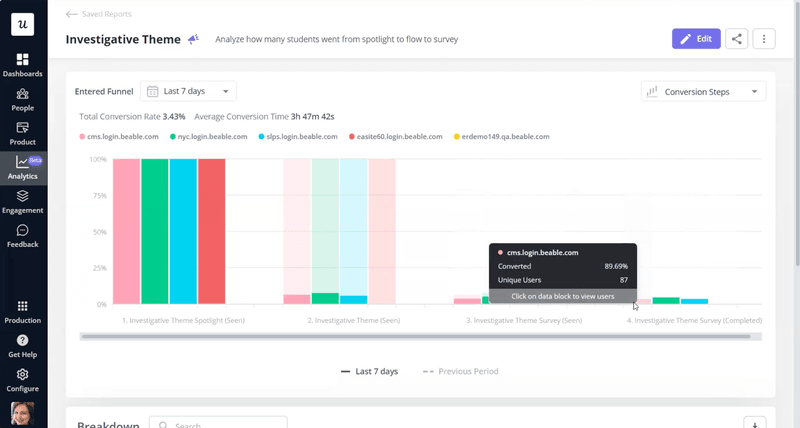
In addition, a funnel analytics report shows you how users progress through a customer journey and where they drop off. These drop-off points indicate friction that can be further investigated and improved.
💡 For example, Beable Education, an e-learning platform, uses Userpilot’s funnel reports to track student engagement with their content. They set up funnels to monitor how students interact with specific elements, such as clicking on spotlights, watching videos, and completing surveys.
By breaking down these results by customer sites, Beable gains detailed insights into content engagement and identifies areas for improvement. This allows them to optimize their content delivery and enhance the overall learning experience.
How to collect qualitative data
You can collect qualitative data through surveys and by talking to your support team.
Depending on your goals, collect user feedback from one or many in-app surveys, such as welcome surveys, NPS and CSAT surveys, and churn surveys. Trigger them contextually during the customer journey so they aren’t disruptive towards the user experience.

Additionally, your customer support team can offer insights into consumer behavior as they frequently speak to your users. They’re usually aware of trending user preferences and external factors influencing buying behavior. These are often insights that a survey can’t reveal.
4. Use your customer behavior insights to boost new sign-ups
The first thing we recommend is to target the low-hanging fruit. Identify what’s working for high-value customers and use these insights to encourage new sign-ups.
Here are a few examples of the improvements you could make to grow your user base:
- Share personalized marketing campaigns for your segments to offer relevant benefits and solutions.
- Promote features used by high-value customers in your marketing campaigns.
- Personalize to showcase features of relevance for each new user.
5. Improve your customer journey map with newly found insights
Next, identify what can be improved in the existing process to increase retention. The behavioral data can highlight how customers interact with your product and showcase the improvements needed to optimize your customer journey.
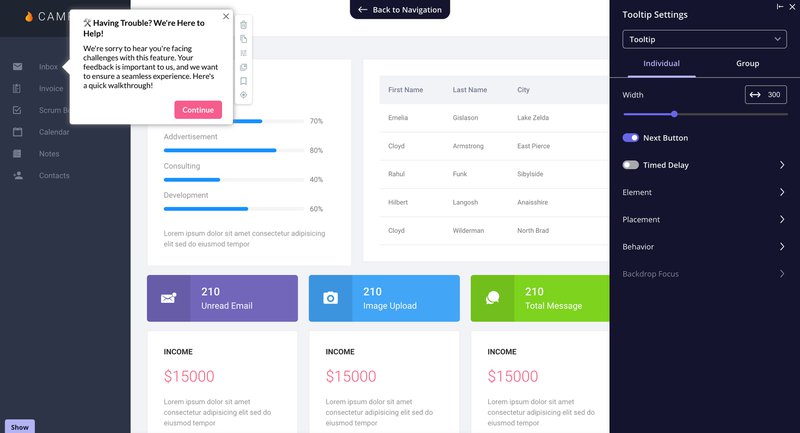
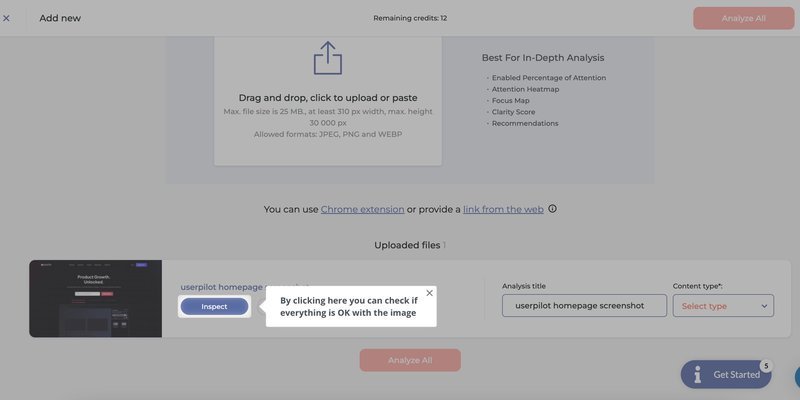
For instance, if you spot a point in the user journey, try adding a tooltip at the specific touchpoint to guide users.
6. Analyze the results and repeat
Customer behavior analysis isn’t something that you do once and forget about. It’s an ongoing process as your product and customer preferences evolve. Rinse and repeat periodically so your product stays aligned with changing user needs.
3 customer behavior analytics tools to track consumer behavior
There is a range of analytics tools that can assist you in conducting customer behavior analysis. Here are three industry leaders you can explore.
1. Userpilot
Userpilot is a product growth platform that mixes real-user insights with solid analytics and feedback. Basically, it’s about giving you the whole picture and then giving you the tools to make that picture better.
So, let’s talk about how Userpilot helps you find those little (or big) roadblocks your users are hitting and how you can smooth them out.
Key features for customer behavior analysis:
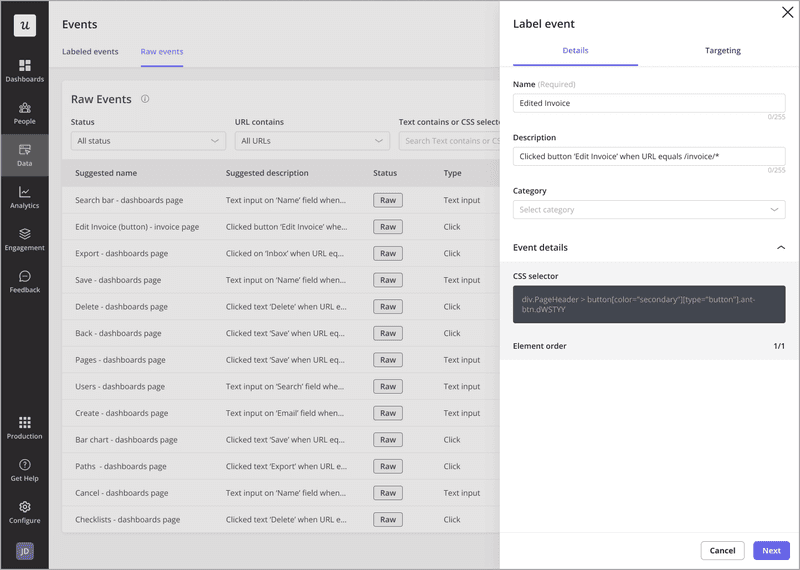
- Autocapture: Userpilot just picks it all up automatically – clicks, forms, text inputs – so you’ve got the data without the headache.
- Session replays: Ever wish you could just see what your users are actually doing? Session replays let you do just that. Spot friction points, see where things get confusing, and catch those “rage clicks” in real time. And, you can filter to find exactly the sessions you need.
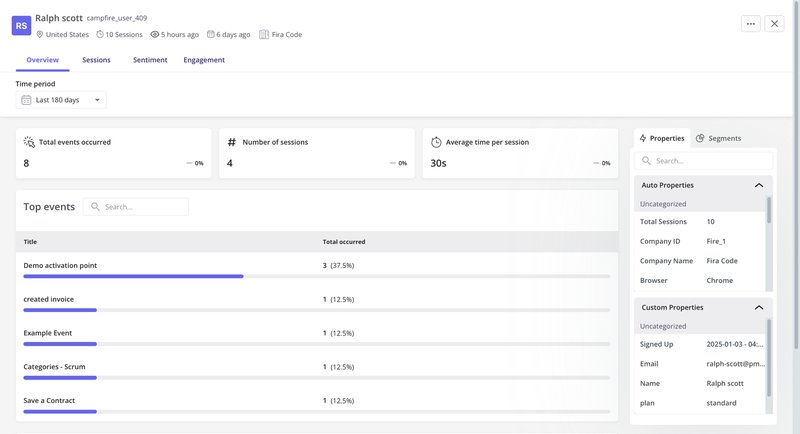
- User and company profiles: You can see their activity, see their demographics, understand their company, etc., in one place.
- Analytics dashboards: You can set up dashboards to see the key metrics that matter to you, like where users are dropping off in your funnels, what paths they’re taking, how retention trends are looking, and more. It’s about seeing the story the data is telling.
- NPS and in-app surveys: You can measure satisfaction with NPS and use customizable in-app surveys to gather qualitative insights on specific features or experiences.
And here’s the thing: Userpilot also helps you act on those insights.
It’s not just about seeing the problems; it’s about fixing them. Userpilot comes with engagement tools that let you build personalized onboarding flows, trigger in-app messages based on user behavior, and even collect feedback right inside your app.
So, if you see users struggling, you can jump in with targeted help. If you notice churn signals, you can launch a re-engagement campaign.

2. Hotjar
Hotjar is a comprehensive web analytics and user feedback tool designed to assist website owners and digital marketers in better understanding user interactions on their websites.
One of Hotjar’s key features is heatmaps, which analyze and record user activity on selected web pages, recording interactions such as mouse movements, hovers, taps, and scrolls. These help identify areas of high and low popularity.
Hotjar also provides session recordings, allowing you to watch real-time replays of individual user sessions. You’re also able to collect customer feedback with user feedback surveys.
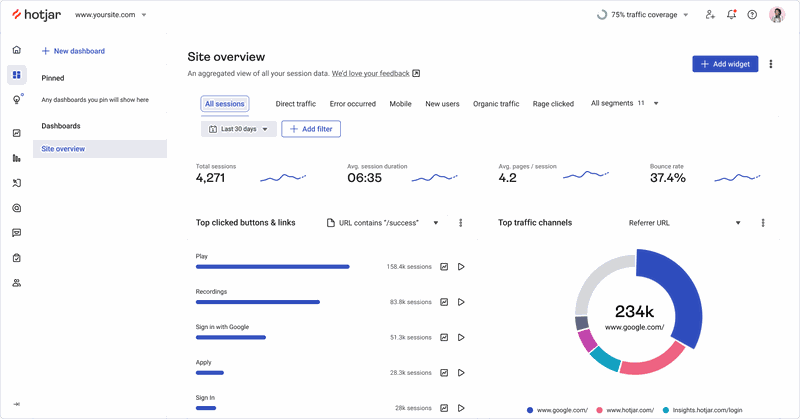
A session replay in Hotjar
3. Mixpanel
Mixpanel is a product analytics platform that enables businesses to analyze user behavior and make data-driven decisions. It offers insights into user engagement and tracks product events, such as button clicks and form submissions.
Mixpanel can also help with the following:
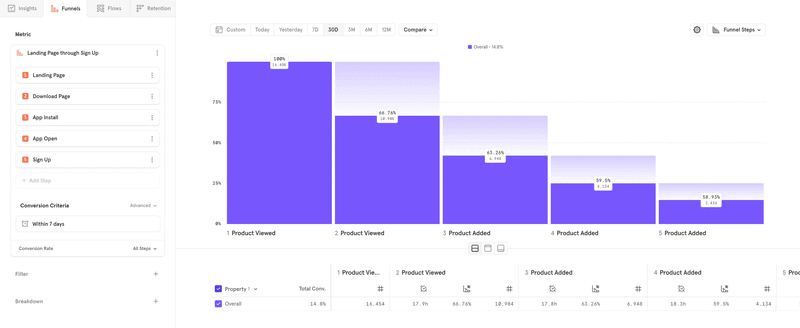
- Funnel analysis: Identify where users drop off and optimize user flows for better conversion rates.
- User segmentation: Analyze different user groups based on attributes and behaviors.
- A/B testing: Optimize user experiences by experimenting with different product versions.
- Retention analysis: Measure user loyalty over time with data visualization and reporting tools.
Looking for a customer behavior analysis tool?
You need more than just talking to your users to understand customer behavior. Product teams need to capture and analyze their behavior patterns in order to improve the customer experience and increase retention.
Want to get started with customer behavior analysis? Get a Userpilot demo and see how you can collect the data you need and analyze it easily.
FAQ
What is customer behavior?
Customer behavior data encompasses all customer interactions with your product from the beginning of the customer journey until they continue to use it.
These interactions can include activities like engaging with the onboarding checklist, clicking on different elements, hovering over specific features, and even canceling a subscription.
Product teams gather and analyze this data to gain insights into customers’ behavioral patterns. These insights enable them to take appropriate actions and make informed decisions.
What are the 4 types of customer behavior?
Customer buying behavior can be categorized into four types:
- Complex buying: High involvement, significant brand differences. This is prevalent in SaaS when businesses evaluate enterprise-level solutions, focusing on integration, scalability, and ROI.
- Dissonance-reducing buying: High involvement, few brand differences. Customers mitigate risk by choosing familiar vendors or recommended solutions, which is common in selecting cloud storage or project management tools.
- Habitual buying: Low involvement, few brand differences. This applies to essential, routinely used SaaS tools like basic productivity or communication platforms.
- Variety-seeking buying: Low involvement, significant brand differences. Customers explore new SaaS tools to find better features or user experiences, particularly in rapidly evolving categories like design or marketing software.


