A Customer Effort Score (CES) survey is a powerful tool for assessing how easy it is for customers to interact with your product.
It helps you identify areas for improvement and enhance the user experience.
In this comprehensive guide, we’ll walk you through:
- How to implement a CES survey and collect valuable feedback.
- The best times to launch your CES surveys.
- Customer effort score calculation.
- Other survey types to implement for rounded insights.
Try Userpilot Now
See Why 1,000+ Teams Choose Userpilot

What is a Customer Effort Score (CES)?
Customer Effort Score (CES) gauges how easily customers interact with your products, services, or support.
It’s usually measured through a post-interaction survey in which customers rate their experience on a scale (e.g., “very hard” to “very easy”).
Example:
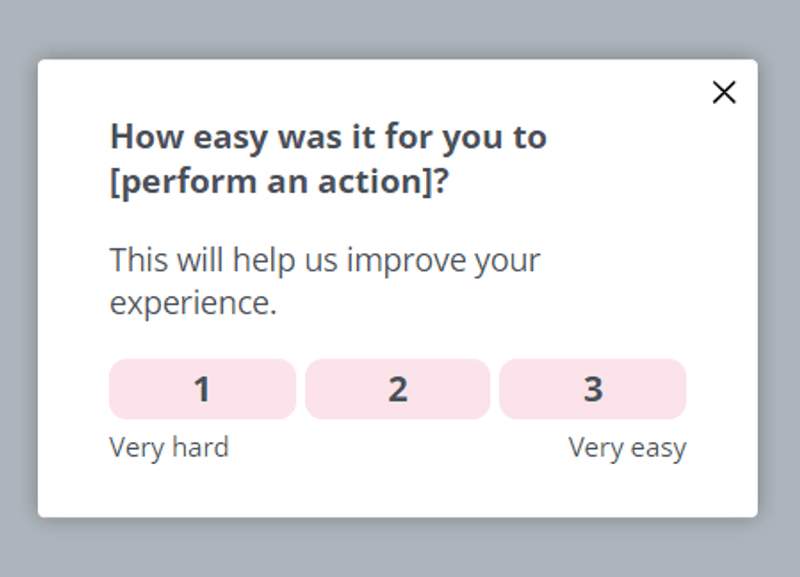
CES survey.
Customer effort score calculation is simple: take the number of customers who rated their experience as “easy” or “very easy” and divide it by the total number of survey responses.
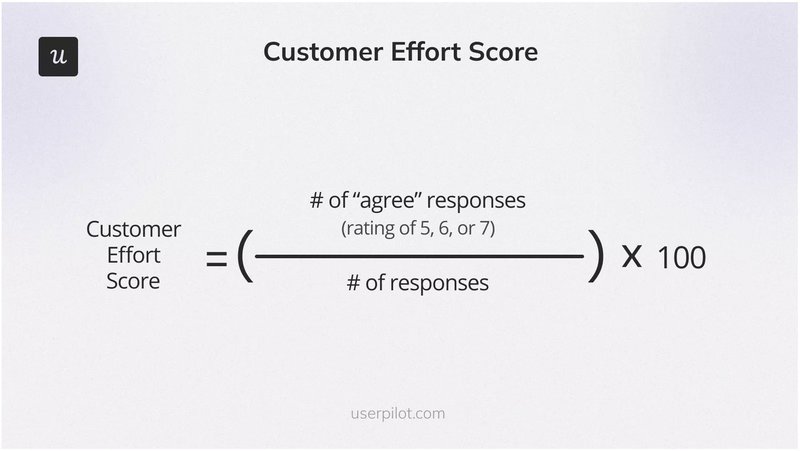
For example, if 65 out of 100 customers rated their experience as easy or very easy, the CES would be 65%.
What is a customer effort score survey?
The customer effort score survey is a feedback tool that lets you measure how much effort a customer has to put in to resolve an issue, complete a transaction, or achieve their goal while interacting with your product or service.
Customer effort score surveys can be delivered through various channels, including email, website pop-ups, SMS, or in-app messages.
Channel choice depends on your preferences, but in-app surveys work best for B2B SaaS as they help you collect quick and contextual data.
For example, by triggering an automated in-app survey each time a user interacts with your resource center, you’ll easily identify a high-effort service interaction and make changes to improve the customer experience.
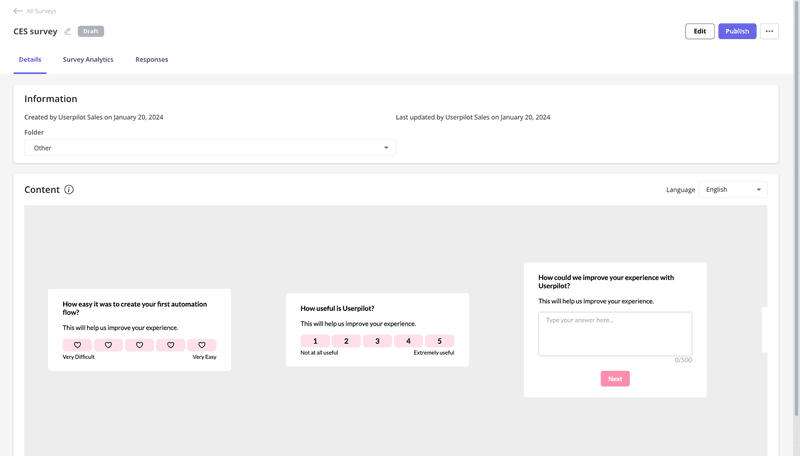
Top benefits of conducting CES surveys
Conducting, analyzing, and acting on CES surveys has many benefits. By doing so, you can:
- Pinpoint problem areas: Effort score surveys focus on specific customer interactions, allowing you to identify pain points and friction areas within your processes. This granular feedback lets you make targeted improvements and enhance the customer journey.
- Improve customer satisfaction: Reducing the effort required for customers to achieve their goals directly enhances their satisfaction. When customers find interactions straightforward, their overall perception of your company improves, leading them to engage more frequently.
- Boost customer loyalty: Easy and efficient experiences foster retention and loyalty because customers appreciate convenience. In addition, satisfied customers are more inclined to recommend your company to others, helping you acquire customers organically.
Best times to launch your customer effort score survey
CES surveys yield the most valuable insights when triggered immediately after users complete specific actions. Let’s explore some of these key actions:
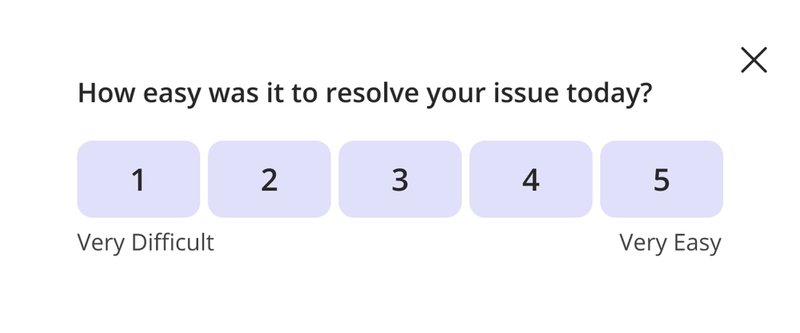
After customer service interactions
Conducting a CES survey after an interaction with your customer service team provides real-time feedback on the support experience. This timing allows you to capture the customer’s immediate reaction to the help they received, whether it was through a call, chat, or email.
If the issue wasn’t resolved in the first interaction, you could send another CES survey after the resolution to understand how customers felt about the whole experience.
Following product or service delivery
Trigger a CES survey after an online or in-store purchase to gauge the ease of that interaction.
Send another survey post-delivery or installation to assess the ease of the delivery process, clarity of communication during delivery, and the actual handover of the product.
This second survey allows customers to provide feedback on the entire process and their experience with the product.
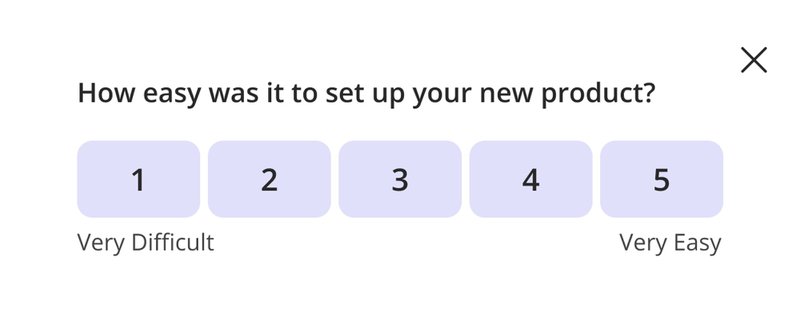
During key customer journey touchpoints
Key touchpoints in the customer journey, such as account registration, product setup, or onboarding, are critical moments where customer effort should be minimal.
By surveying customers at these crucial points, you can gather insights into their initial experiences with your product or service.
This feedback is invaluable for refining onboarding processes, improving user guides, and ensuring customers have a smooth start.

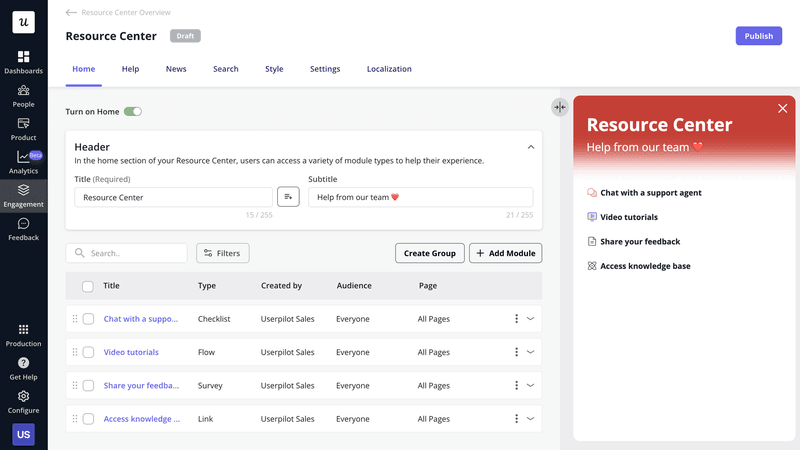
After self-service interactions
Self-service tools like knowledge bases, resource centers, and chatbots are designed to provide quick and easy solutions without direct contact with customer service reps.
Survey customers immediately after they use these tools to measure how well your support resources meet customer needs and identify areas for improvement.
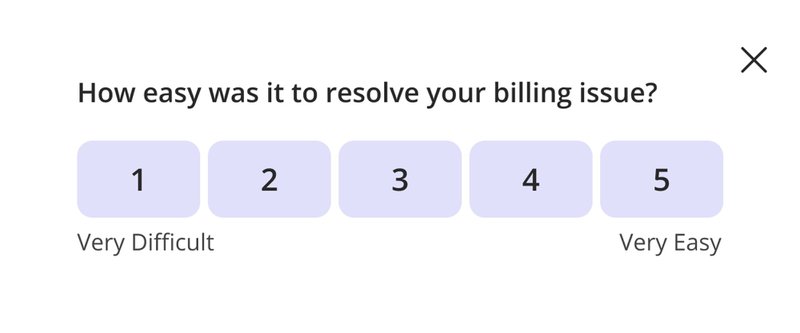
During account management interactions
Account management interactions involve tasks like updating personal information, managing subscriptions (renewal/cancellation), or changing payment methods. If not designed properly, these interactions can be complex and frustrating.
Trigger a CES survey after each account management interaction to track customer effort and ensure your processes are easy to use. (You don’t want to be losing customers to complex user flows).
How to implement a CES survey
1. Define your objectives and scope
Clearly outline what you aim to achieve with the CES survey.
Are you trying to identify pain points in a specific process, evaluate a new feature, improve your support process, or measure overall customer effort across various touchpoints?
Your goals will determine the target audience and survey timing.
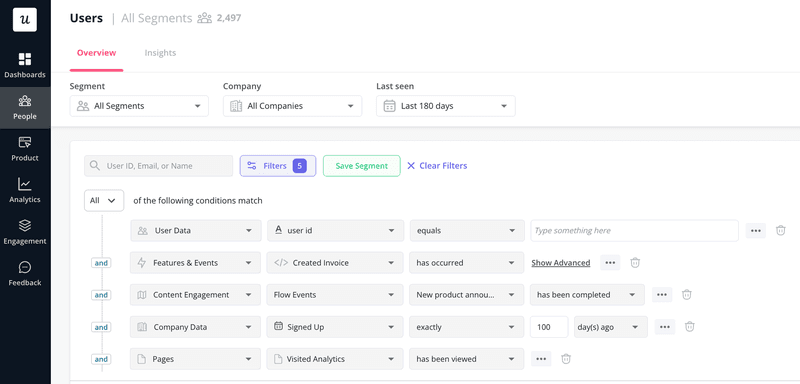
For example, if you’re evaluating a new feature, segment users who interact with that feature for the first time and ensure they’re the only ones who see your survey.
2. Design your CES survey
Craft a concise and clear question that directly asks customers to rate the effort involved in their interaction.
Common scales used in effort score surveys include numbered scales, Likert scales, and emoticon ratings. Let’s go over each of them:
Numbered scale
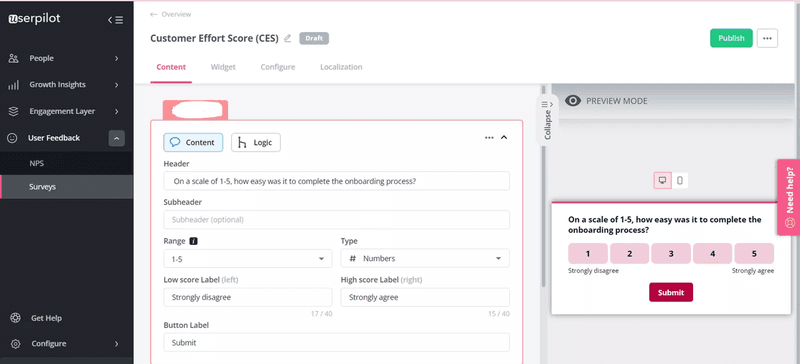
A numbered scale is typically a 5-point or 7-point scale where respondents select a number to represent the ease of specific interactions.
How to interpret: Calculate the average score across all responses.
A higher average CES score indicates lower customer effort and a smoother customer experience. For instance, an average CES of 4.2 on a 5-point scale means customers generally found it easy to resolve their issues.
Likert scale
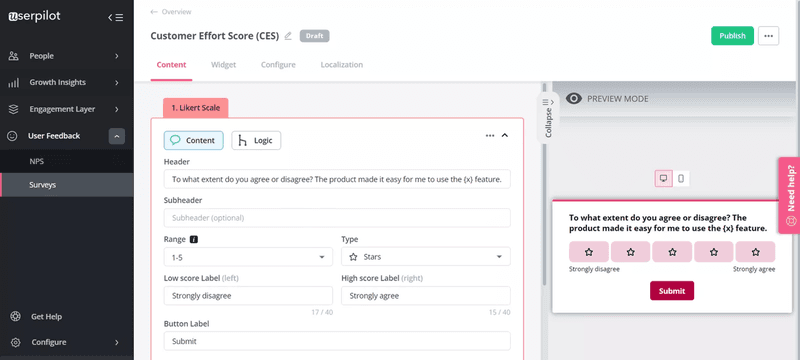
Likert scales employ descriptive labels to represent varying degrees of agreement or opinion. As in the example below, the labels typically range from ‘strongly agree’ to ‘strongly disagree’.
How to calculate: the easiest approach is to assign numerical values to each label and find the average. Example:
- Strongly Disagree = 1
- Disagree = 2
- Neutral = 3
- Agree = 4
- Strongly Agree = 5
Based on the above numerical figures, a lower average indicates higher perceived customer effort, suggesting a more positive experience.
The descriptive labels associated with each score provide deeper insight into customer sentiment. For example, an average CES of 2.3 suggests customers disagree the experience was easy.
Emoticon ratings
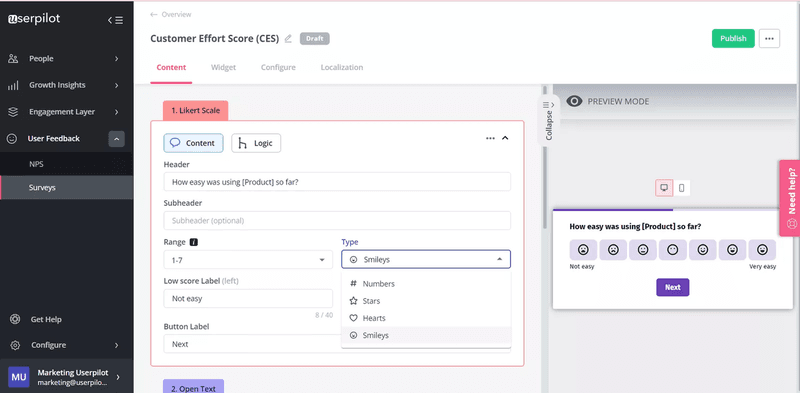
Emoticon ratings use a series of faces or icons (e.g., sad to happy faces) to represent the ease of the experience.
How to calculate: Count the percentage of positive, neutral, and negative responses.
A high percentage of positive emoticons indicates a low-effort customer experience. For example, 70% of positive emoticons suggest most customers had an easy experience.
No matter the scale you use, ensure your customer effort score questions are short and devoid of bias.
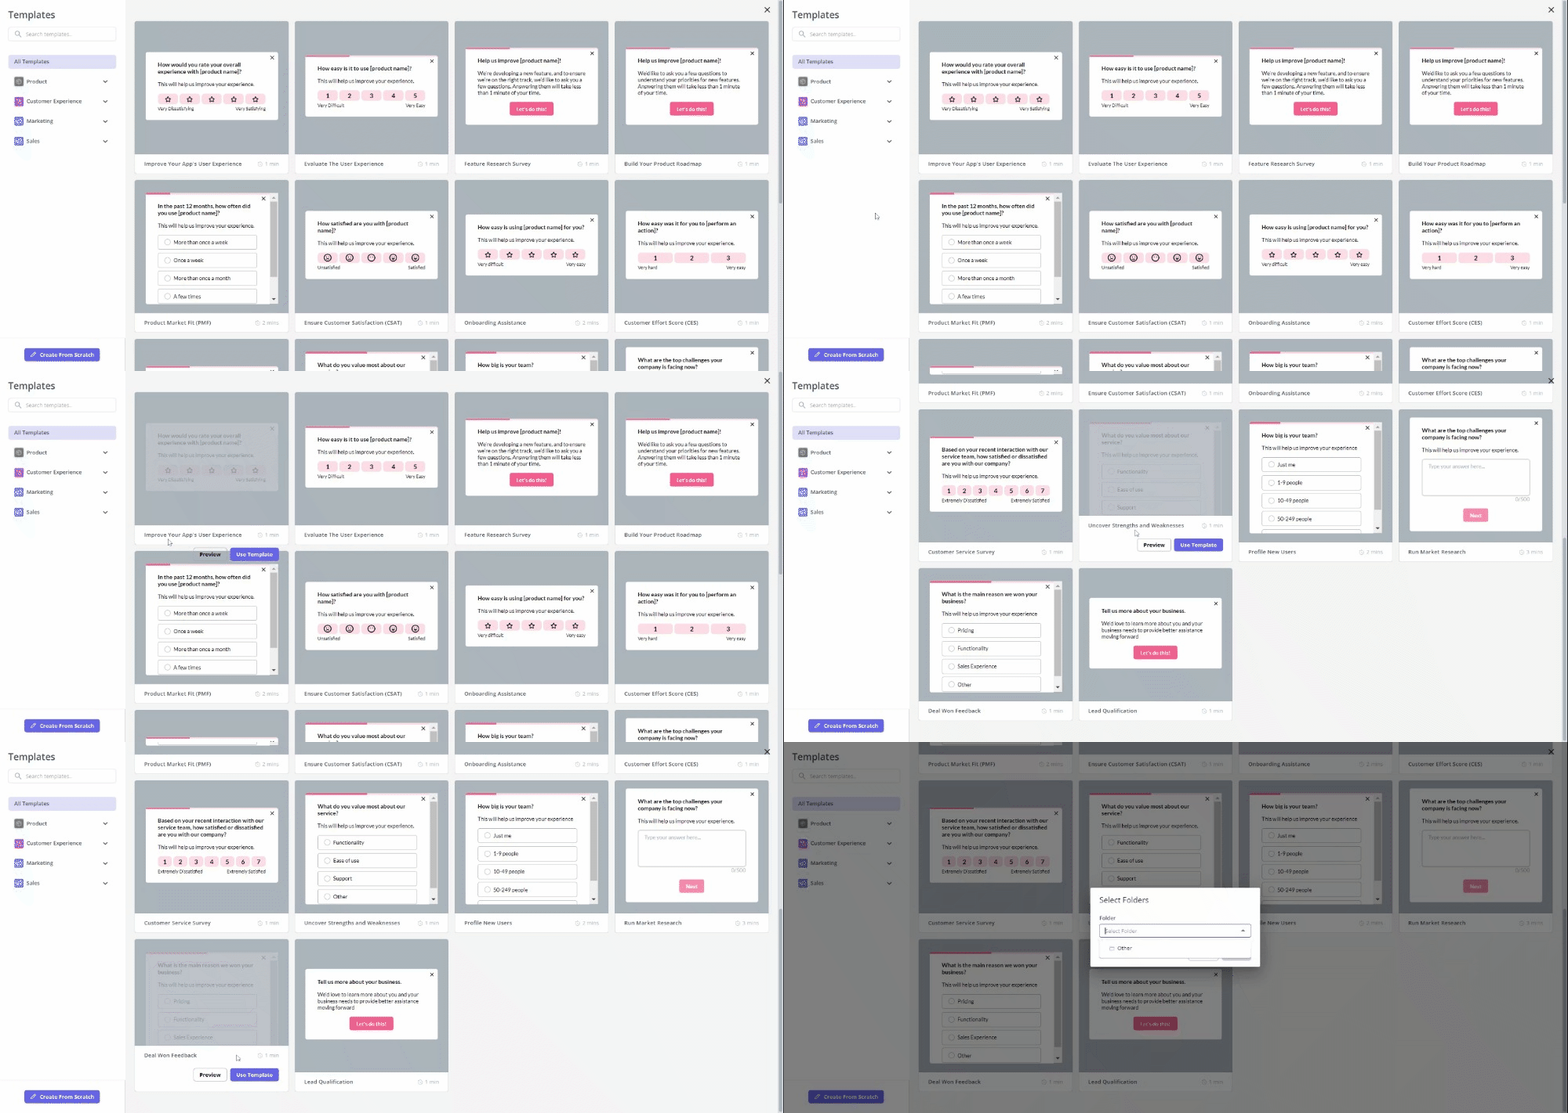
If you’re unsure how to go about it, use tools like Userpilot to access proven CES survey templates and customize them as desired:
3. Distribute your survey
Choose the most appropriate channels for reaching your target audience, such as email, website pop-ups, SMS, or in-app surveys.
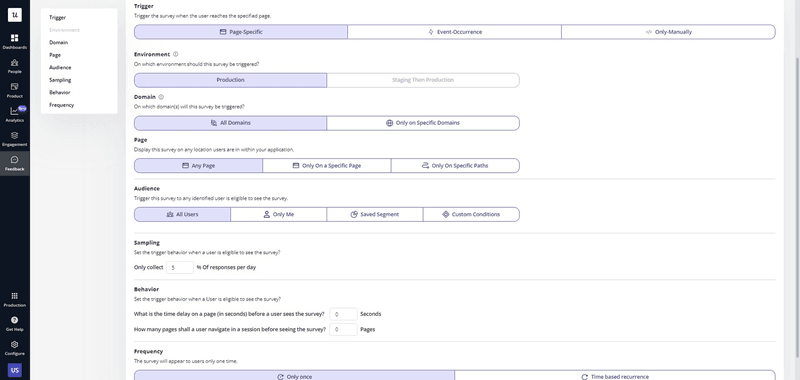
You also want to ensure timely delivery—send surveys immediately after relevant interactions or events to capture feedback while the experience is still fresh.
Feedback tools like Userpilot make automatic survey triggering easy:
4. Analyze and act on results
Once you’ve collected survey responses, the next step is to analyze the data and take actionable steps based on the insights gained.
Use analytics tools to aggregate and visualize data for easy interpretation:
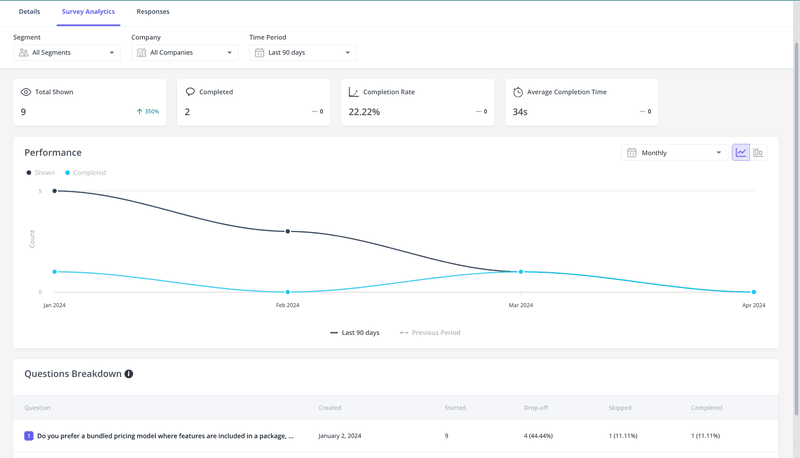
Aim to find patterns in the responses and note areas for improvement.
Then, based on customer feedback, develop an action plan. This might include changing your customer support processes, enhancing self-service resources, or simplifying product features.
Ensure you communicate any improvements made in response to customer feedback.
This will make customers feel valued and motivated to take future surveys seriously. For example, you can send in-app messages telling users you’ve updated your support portal per their complaints.
How CES surveys compare to other customer experience questionnaires
While Customer Effort Score (CES) surveys offer valuable insights into specific customer interactions, they do have certain limitations:
- Narrowed scope: effort score surveys focus solely on the effort required by customers, not covering other important aspects such as customer satisfaction or loyalty.
- Subjective interpretation: Customers may have different interpretations of “effort,” leading to variations in responses.
- Lack of qualitative insights: CES surveys typically rely on a single quantitative question, which isn’t sufficient to explain the reasons behind the customer effort scores.
- Potential bias: Responses may be influenced by the timing of the survey or recent experiences, potentially leading to biased results.
To address these limitations, it’s best to run effort score surveys alongside NPS and CSAT surveys.
Net Promoter Score (NPS) survey
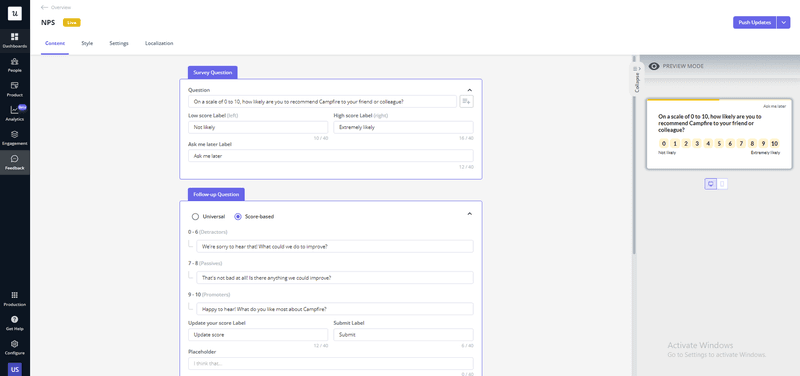
NPS survey measures customer loyalty and overall perception of your products, services, and customer service altogether—providing a comprehensive view of the customer experience.
By combining CES and NPS, you can get a more complete view of the customer experience. This approach helps you identify which specific aspects of the customer experience (measured by CES) contribute to overall customer loyalty and brand advocacy (measured by NPS).
Customer satisfaction score (CSAT) survey
A CSAT survey measures customer satisfaction with your product, service, or specific interactions.
While CES focuses on the effort involved in an interaction, CSAT shows the overall satisfaction with the outcome of that interaction.
For example, a customer might rate a support interaction as low effort (good customer effort score), but still be dissatisfied with the resolution provided (low CSAT).
Combining CES and CSAT allows you to understand both the ease of the experience and the level of satisfaction achieved, leading to a more comprehensive understanding of the customer journey and potential areas for improvement.

Conclusion
Customer feedback is invaluable to product growth. By regularly collecting and acting on feedback, you can proactively address pain points, boost customer loyalty, and reduce churn.
Ready to launch your customer effort score survey? Userpilot can help! Book a demo today and discover how our platform can help you collect, analyze, and act on customer feedback, all code-free.


