Best User Engagement Tools and Software in 2026


Your users are slipping away, and you’re not sure why. Low engagement, silent churn, and a product experience that feels more like guesswork than strategy.
Most teams are juggling 5+ disconnected tools. One for messaging, another for analytics, another for surveys, with no clear way to connect the dots. You’re spending more time wrestling with your tech stack than actually engaging users.
The right user engagement tools can change everything. From in-app messaging and behavioral analytics to feedback collection and multi-channel outreach, the tools in this guide help you understand your users, communicate at the right moments, and keep them coming back.
I’ve tested dozens of engagement platforms across different use cases and company sizes. Below, you’ll find 25+ tools with honest assessments of what they do best, what they cost, and when to use them.
How to map your user engagement strategy to the right tools?
To fix churn organically, you must keep the customers engaged and satisfied across their lifecycle. I break this into three pillars, which form the foundation of a healthy product-led growth (PLG) strategy:
- Guide users in-app: Show them exactly what to do while they are inside your product. Facilitate activation through interactive onboarding.
- Track behavioral analytics: Measure passively what users actually do. Look at product usage metrics to see exactly where they get stuck in the customer journey.
- Capture contextual feedback: Ask actively why users take certain actions, specifically targeting the moments immediately after they use a feature to capture the true voice of the customer (VoC).
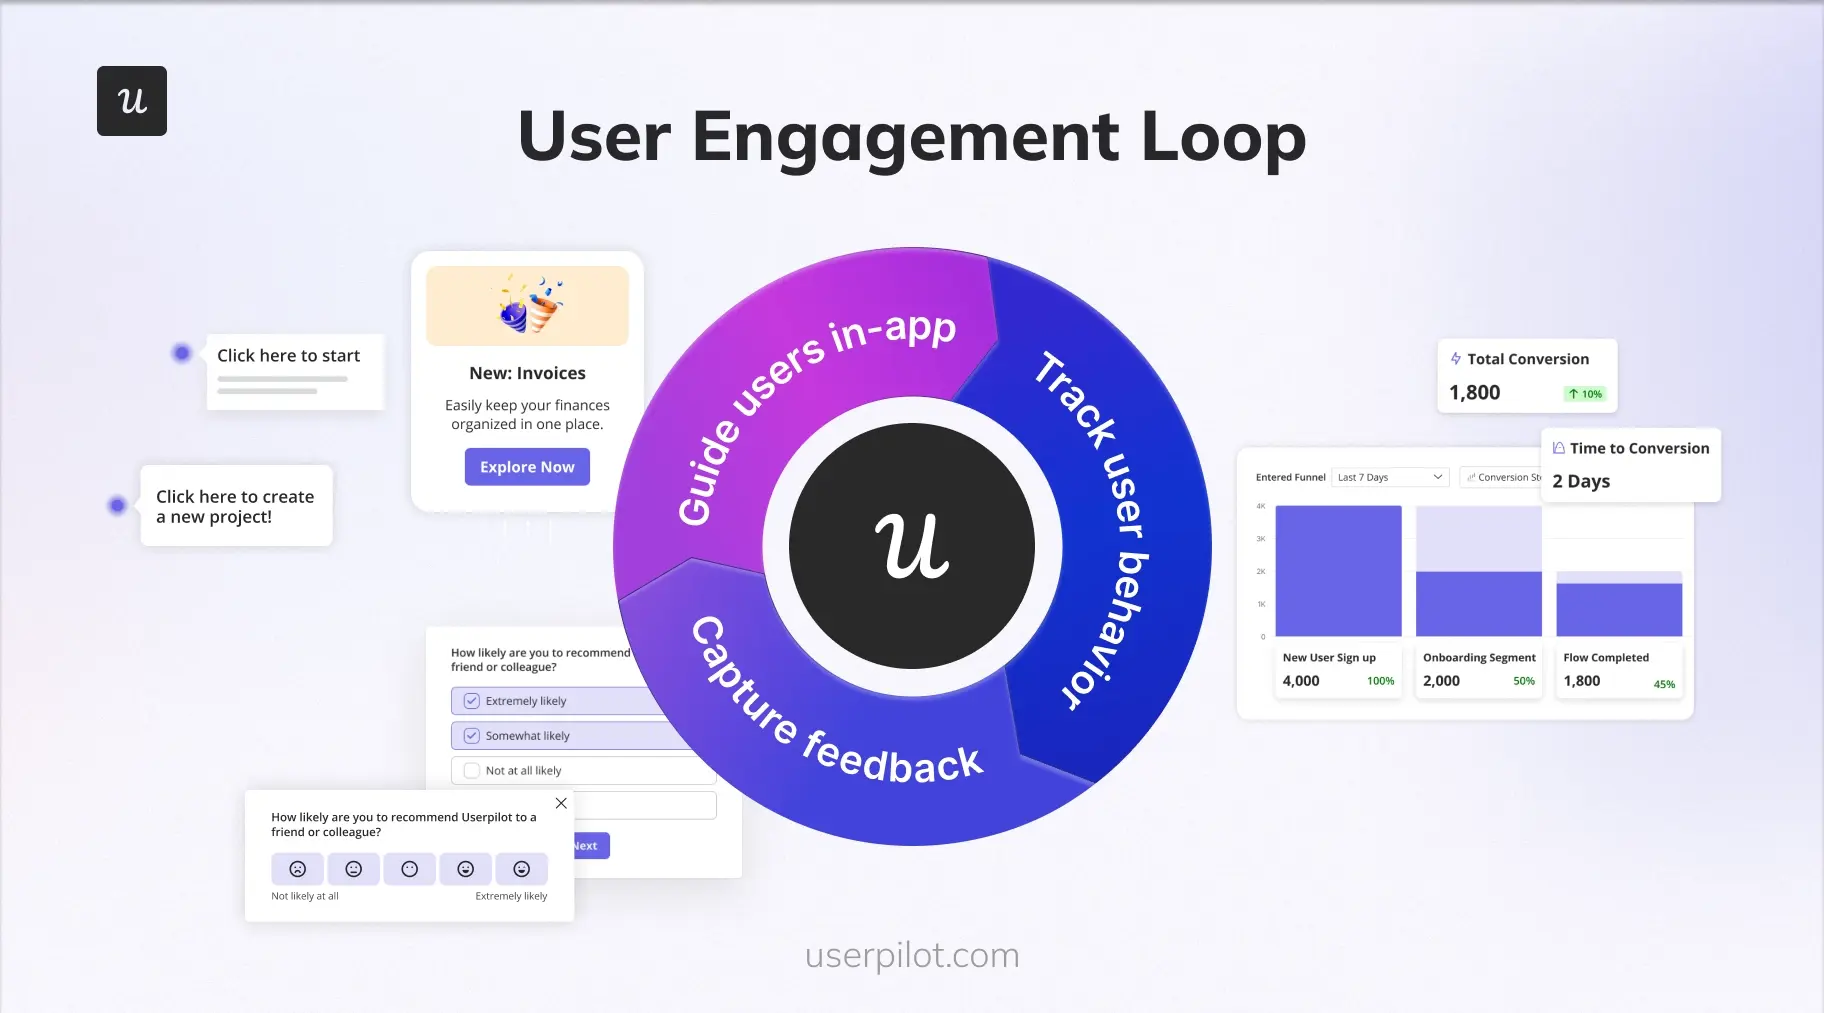
Tracking these pillars allows you to confidently identify and reduce user friction.
However, you shouldn’t treat analytics, onboarding, and feedback as separate silos, but as one continuous loop. Measure the data, build an in-app experience to improve the data, ask the user for feedback on the experience, and measure again.
With the right mix of customer engagement tools and a robust customer engagement platform, you can build such a continuous loop. Below, I’ll show you how to choose tools that let you do exactly that.
What are the best customer engagement tools?
To help you pick the right solutions, I focused on mature, market-leading customer engagement tools that integrate easily with your existing stack. I also looked closely at real user feedback from platforms like G2 and discussions on Reddit to understand how these tools perform in real product environments.
To make this easier to navigate, I’ve grouped the tools based on the three engagement pillars we discussed above: onboarding and in-app guidance, behavioral analytics, and customer feedback.
| Tool | Best for | Starting price |
| Userpilot | Omnichannel engagement and in-app communication | $299/month |
| Userflow | No-code in-app onboarding and engagement (web apps) | $240/month |
| Sendbird | In-app chat, voice, and video communication | Free (chat); paid plans from ~$349/month |
| Intercom | Conversational support with an AI chatbot | $29/seat/month + $0.99 per Fin resolution |
| Zendesk | Ticketing and AI self-service support | $19/agent/month |
| Mailchimp | Email marketing for startups and SMBs | Free plan (paid from ~$13–20/month) |
| Klaviyo | Email + SMS marketing automation | Free (paid from ~$20/month) |
| Twilio Flex | Programmable contact center | $150/user/month or $1/hour |
| MessageBird | Global messaging APIs | Custom (usage-based) |
| Userpilot (analytics use case) | Product & engagement analytics | $299/month |
| Amplitude | Behavioral product analytics | Free (paid plans custom/usage-based) |
| Pendo | Product analytics & roadmap insights | Free (paid = custom) |
| Hotjar | Heatmaps & session recordings | Free (paid from ~$39–49/month) |
| AppMetrica | Mobile analytics & attribution | Free |
| Survicate | Customer feedback surveys | Free (paid from ~$79–89/month) |
| Typeform | Conversational forms & surveys | Free (paid from ~$25/month) |
| Qualtrics | Enterprise experience management | Custom (est. ~$1,500/year+) |
| Delighted | NPS & CX surveys | Free (paid from ~$17–19/month) |
Best user engagement platforms that help you communicate better
To keep your customers invested and engaged with your products/services, you’ll need the help of these customer engagement tools.
They’re all beneficial for different use cases, some helping you communicate with your customers in-app, whereas others assist you with support queries, email campaigns, multi-channel communication, and lots more.
#1: Userpilot for omnichannel customer communication
Userpilot is built with the end-user in mind, allowing you to communicate with them at the right time, in the right way. It brings in-app messages, email, and mobile touchpoints into one place so you can build a cohesive communication flow.
You can create highly targeted, personalized experiences based on real customer behavior. For example, you can trigger in-app messages after feature usage, follow up with emails if users drop off, or re-engage them through mobile touchpoints. This makes it easier to build a consistent customer engagement strategy instead of running isolated campaigns.
Key features
- In-app engagement: Build contextual in-app experiences using UI patterns like modals, slideouts, tooltips, banners, and checklists. These help you guide users toward important actions and reduce friction during onboarding. You can also use path triggers to launch experiences based on specific user actions (for example, visiting a page, clicking a feature, or completing a step). I find this especially useful when you want to engage customers at exactly the moment when intent is highest.
- Email engagement: Design and send behavioral emails directly from Userpilot to support your multichannel communication. You can trigger emails based on product activity, lifecycle stage, or engagement levels. This helps your customer service and product teams stay aligned because communication is tied directly to product usage rather than external campaign assumptions.
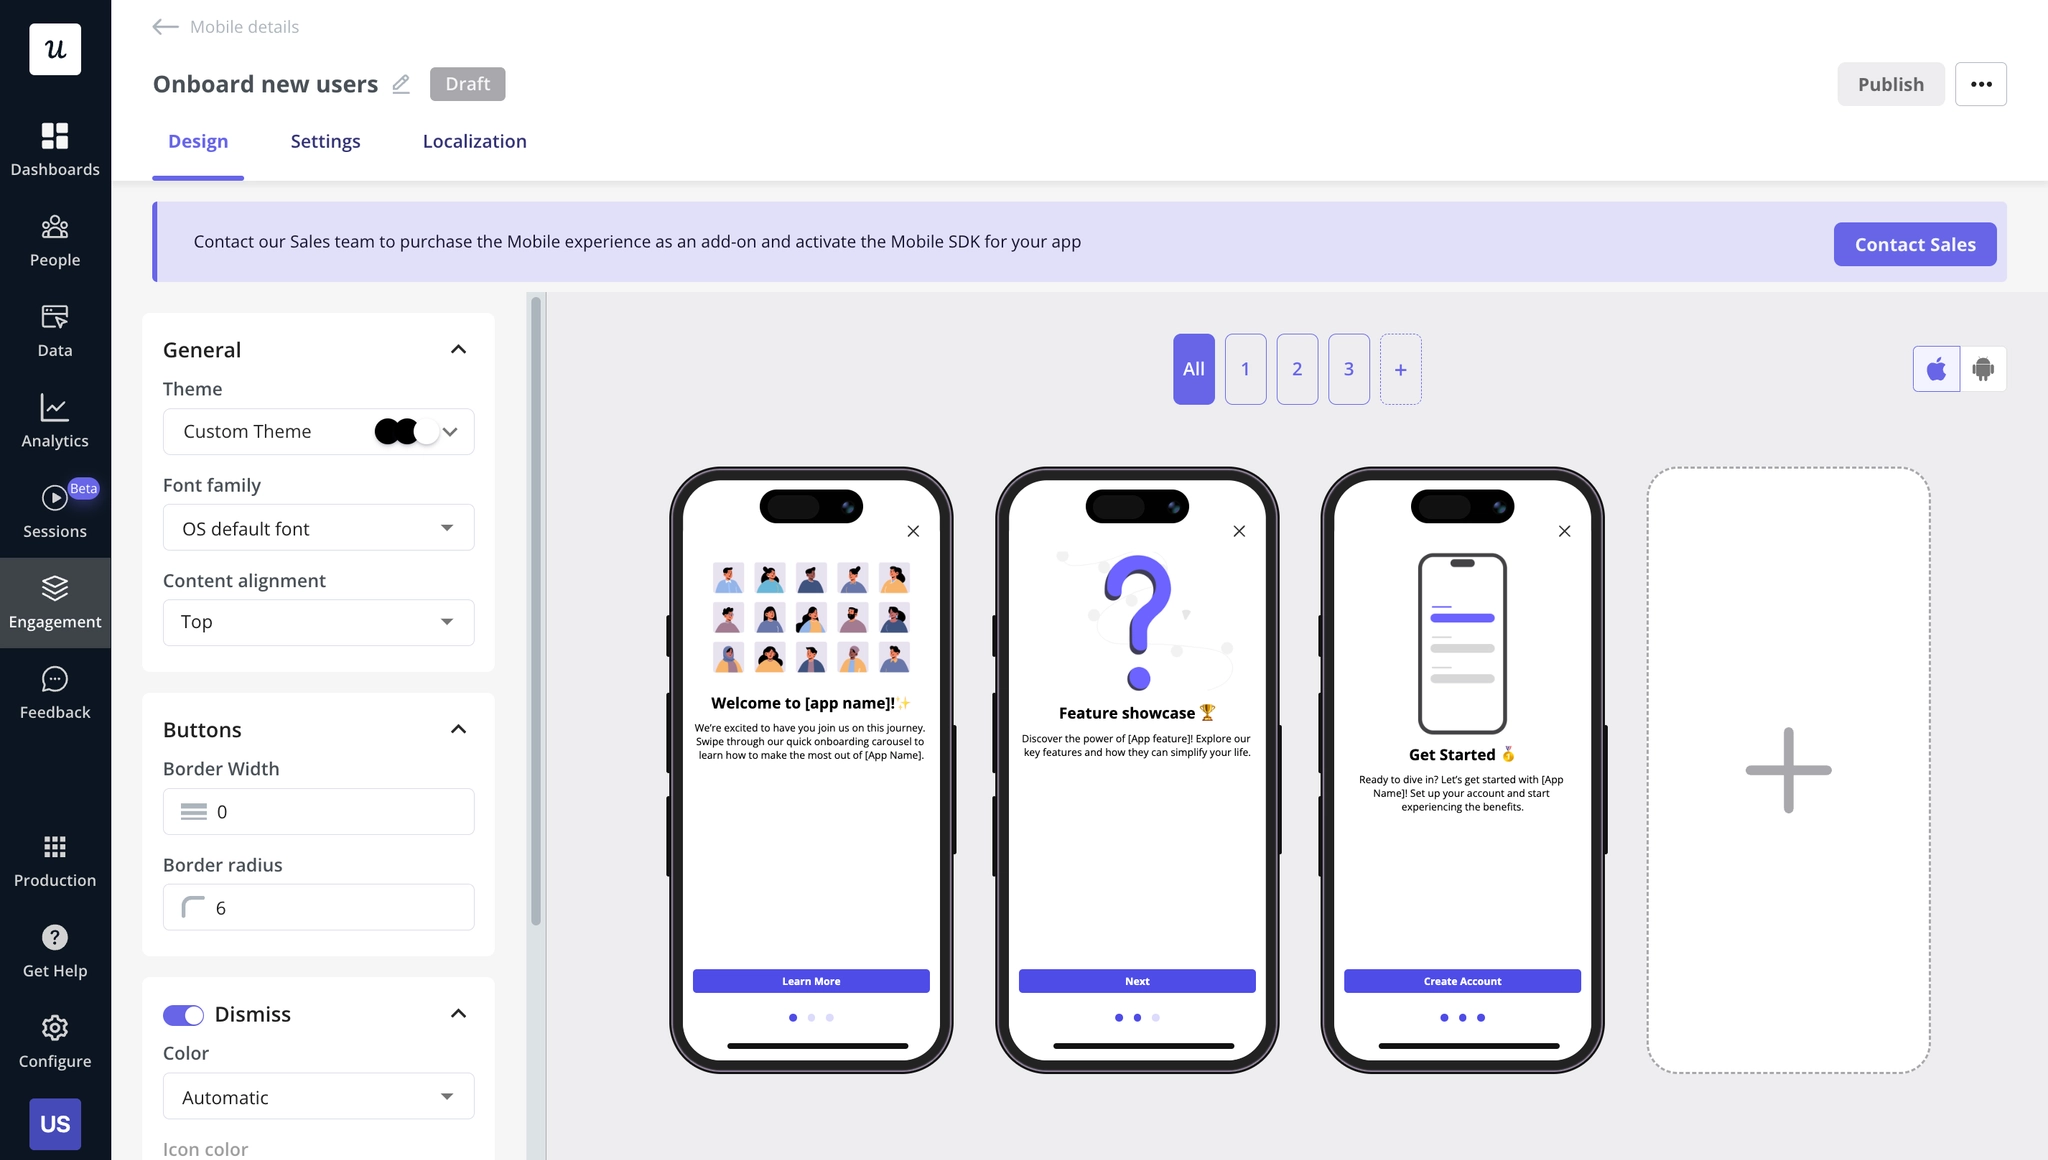
- Mobile engagement: Extend engagement beyond web apps with mobile messaging capabilities like push notifications and mobile experiences. This way, you can stay connected with users even when they are not active inside your product and bring them back to complete actions or announce updates that improve customer satisfaction.
- Segmentation and logic flows: Create dynamic segments using user attributes, events, and engagement history. Because engagement data and user data live in one platform, you can build precise targeting rules without syncing multiple customer data platforms. You can also create logic flows to control who sees what experience and when. I see this as critical when trying to manage complex customer interactions at scale.
- Engagement analytics: Track how users interact with messages, emails, and experiences through built-in engagement analytics. You can measure views, clicks, completions, and interaction rates. These insights help you understand what messaging improves engagement and where your communication might be ignored, helping you refine your customer engagement strategy.
- Microsurveys: Launch in-app microsurveys to measure sentiment at key moments in the journey, such as key after feature adoption or onboarding completion. This helps you understand evolving customer needs and adjust engagement tactics proactively.
Userpilot pricing
Userpilot’s transparent pricing ranges from $299/month on the entry-level end to an Enterprise tier for larger companies.
Userpilot offers three pricing plans based on monthly active users (MAUs):
- Starter: This entry plan begins at $299/month (billed annually) for up to 2,000 MAUs. It includes in-app user engagement features, segmentation, trend analysis, NPS surveys, and essential product analytics. This plan is ideal for small and mid-market SaaS teams getting started.
- Growth: This is a custom plan with advanced analytics, event autocapture, resource centers, in-app surveys, email engagement, and session replay. It’s best for growing teams that need deeper insights and scalability.
- Enterprise: Tailored for large organizations, this plan includes all Growth features along with bulk data handling, premium integrations, SOC 2 Type 2 compliance, custom roles and permissions, and enterprise-level support.
Pros and cons of Userpilot
| Pros | Cons |
| ✅ Fully no-code platform for building in-app experiences, emails, and engagement flows. | ❌ Pricing may be high for early-stage startups with limited budgets. |
| ✅ All-in-one engagement solution (data + engagement in one place simplifies segmentation). | ❌ Can be more than small teams need if they only want basic messaging tools. |
| ✅ Strong targeting and personalization capabilities compared to many standalone tools. | ❌ HubSpot and Salesforce integrations are Growth and Enterprise only. |
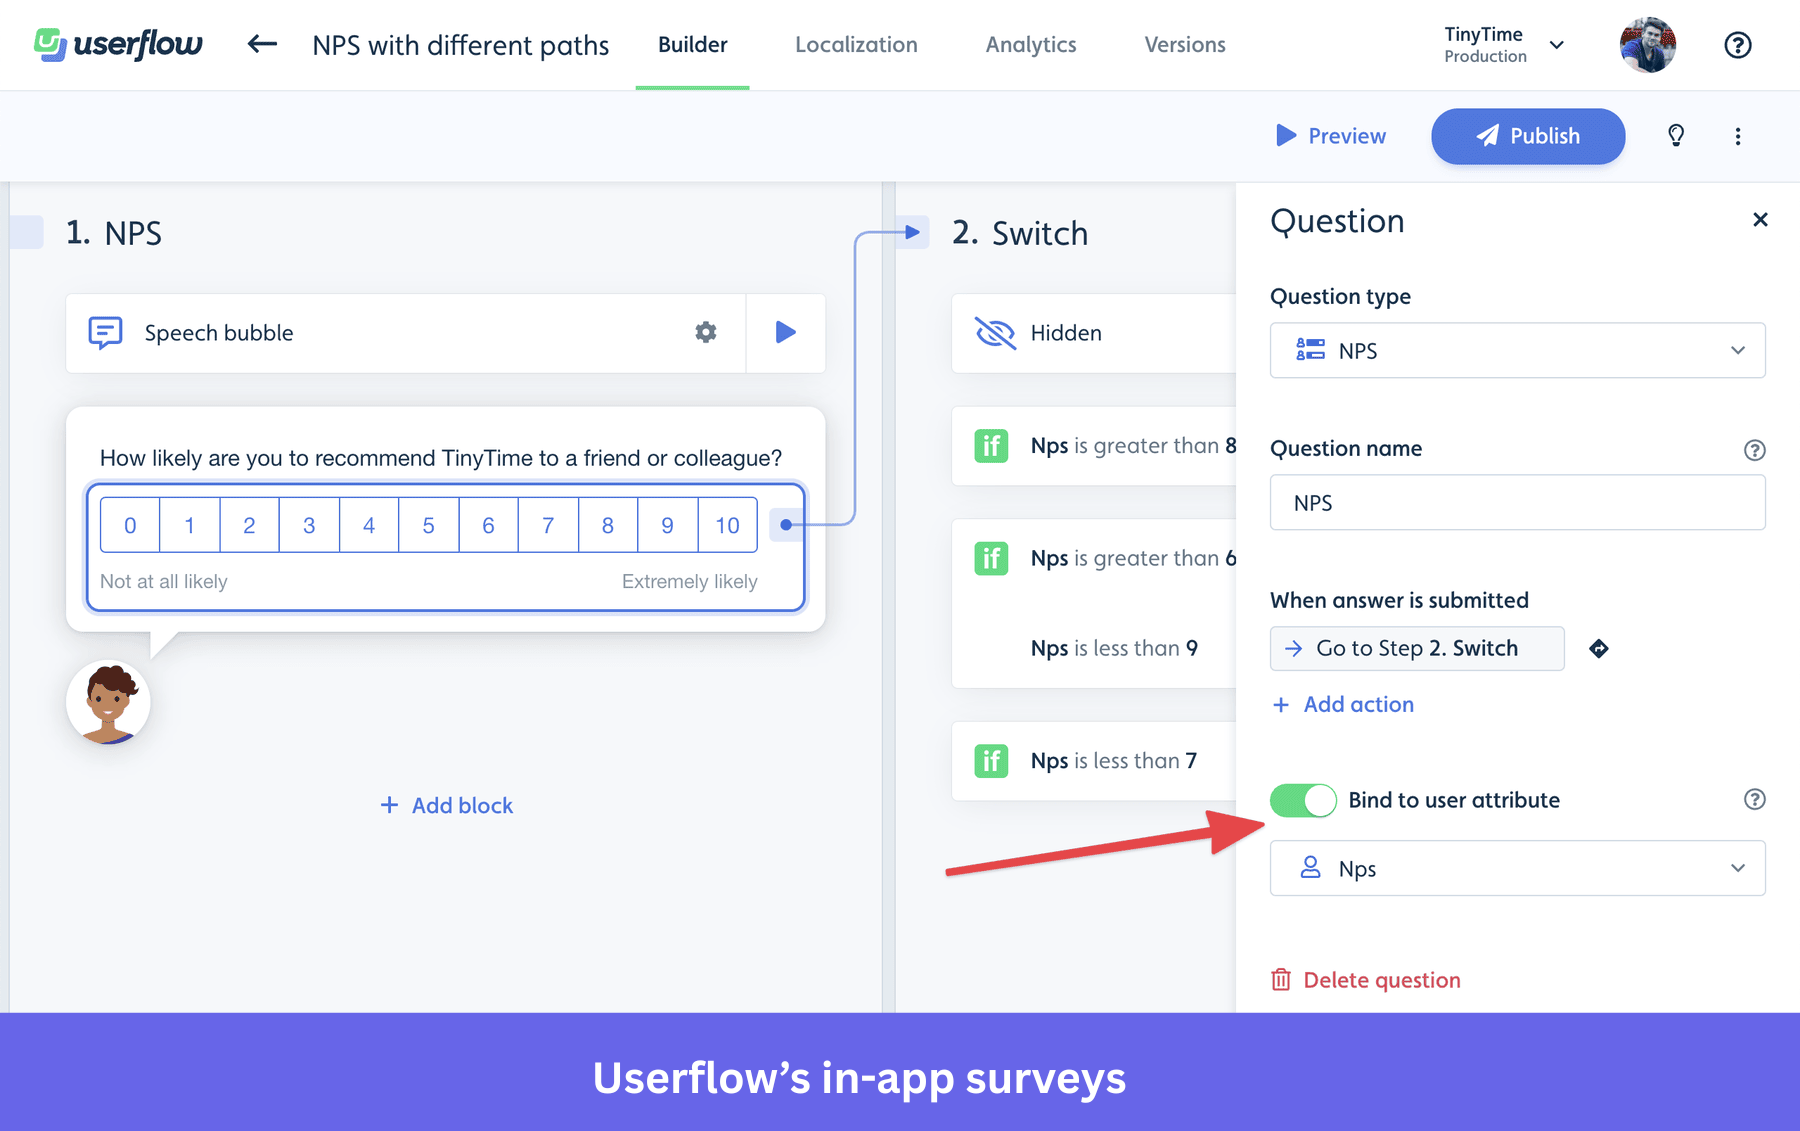
#2: Userflow for in-app communication on web apps
Userflow is a no-code product adoption platform designed to help SaaS teams improve in-app communication and onboarding without engineering help.
It lets you set up logic-based triggers, integrate with multiple tools, segment users, and supports multi-language messaging. You can also personalize flows based on customer behavior and attributes to deliver better customer experiences.
Key features
- Product tours and onboarding flows: Build interactive product tours, tooltips, and onboarding checklists without code. These experiences help guide users toward activation and reduce confusion during early customer journey stages. You can trigger flows based on lifecycle stage or in-app actions to improve how you engage customers at critical moments.
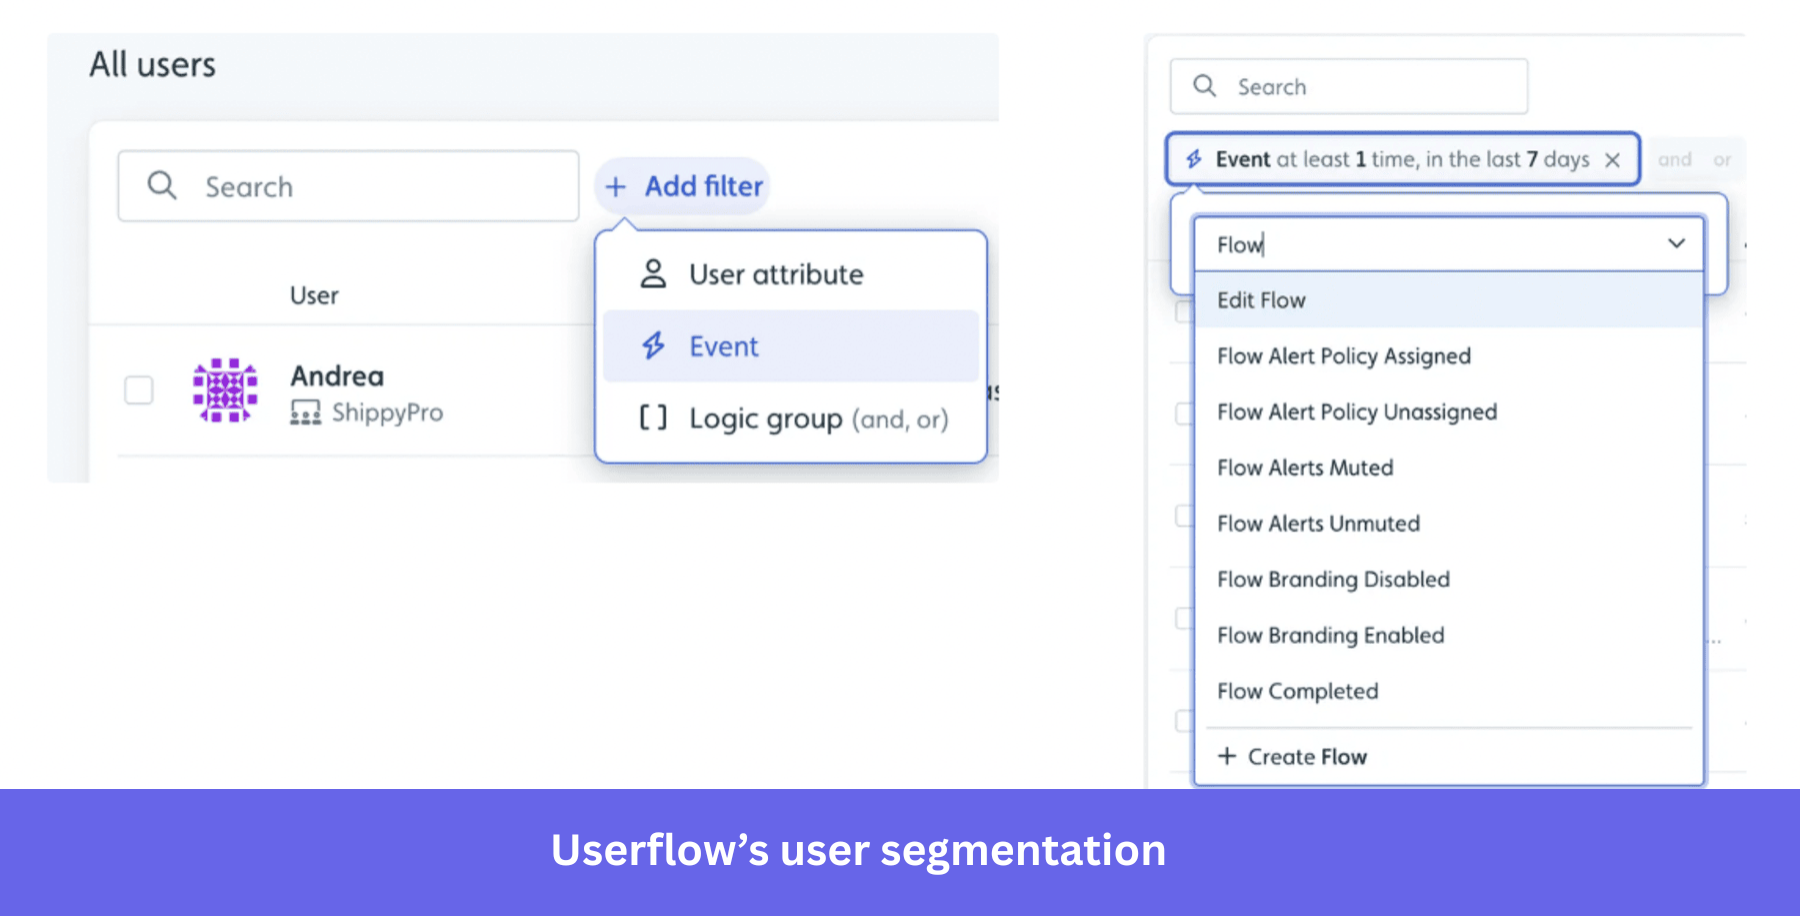
- User segmentation and event-based targeting: Create segments using attributes, events, and lifecycle data to personalize in-app messages. This helps you tailor communication based on how different users interact with your product. I find this especially useful when trying to improve customer interactions without sending the same experience to everyone.
- In-app surveys and resource center: Launch in-app surveys and build a self-serve resource center so users can find answers without contacting support. This can reduce pressure on customer service teams while still helping users succeed.
Userflow pricing
Userflow offers a 14-day free trial and paid plans starting at $240/month (Startup plan) for up to 3,000 monthly active users. Higher tiers like the Pro plan (starting around $680/month) add more advanced integrations, unlimited surveys, higher usage limits, and additional customization options.
Pros and cons of Userflow
| Pros | Cons |
| ✅ Very easy to set up and use, especially for non-technical teams. | ❌ No native support for mobile apps (web-focused platform). |
| ✅ IntuitiveUI with flexibility to build complex onboarding flows. | ❌ Limited analytics and reporting capabilities. |
#3: Sendbird for live chat, in-app voice, and video calling
For companies operating in the B2C or C2C niche, Sendbird can mean the difference between a basic app with disconnected customer touchpoints vs. a fully connected experience where conversations feel built-in, support is always just a message or call away, and users never have to leave the app to get help.
Sendbird allows your customers to connect with each other or support teams (human, AI, or hybrid) over voice or video calls or via chat. You can also use this tool to send push notifications at the right time on the right channel (e.g., SMS, WhatsApp, mobile-push, or in-app messaging).
Key features
- Live chat and in-app messaging: Add real-time messaging directly into your product with SDKs and APIs to avoid redirecting them to external customer service tools. This is especially valuable if your customer service teams want to resolve issues quickly while users are still inside the product.
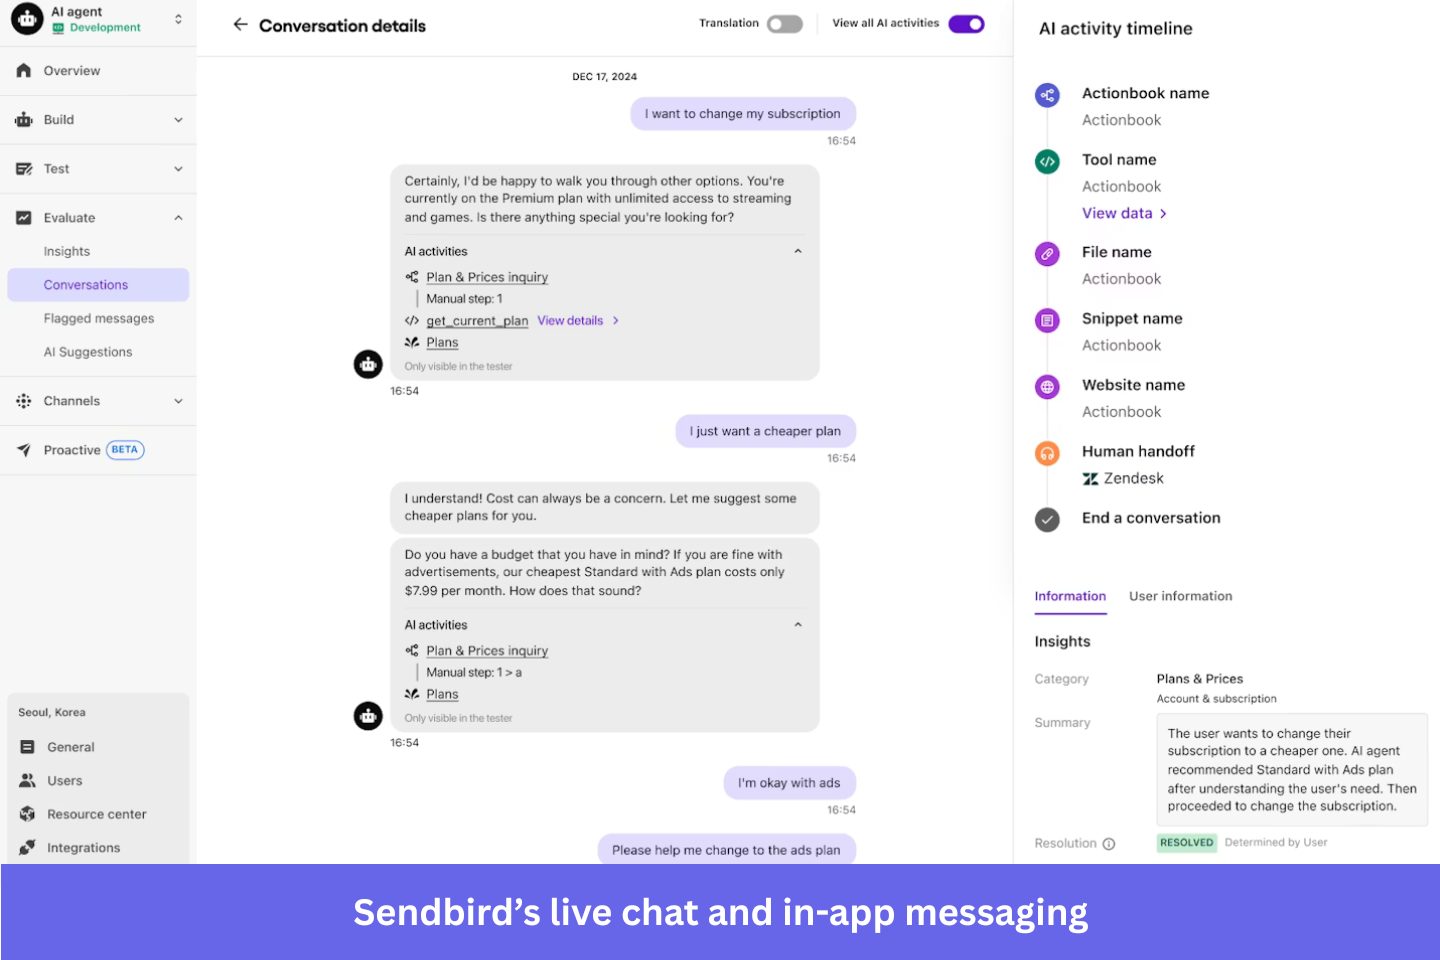
- Voice and video calling: Integrate in-app voice and video calls so users can escalate issues from chat to calls when needed. I see this working well for marketplaces or collaboration products where direct communication improves customer relationships.
- Omnichannel notifications and AI support: Send targeted push notifications across multiple channels and use AI chatbots to handle common questions before routing to human agents. The hybrid model can improve response times and overall customer satisfaction, especially for high-volume support environments.
Sendbird pricing
You can avail the paid offerings of this user engagement tool starting from $349 (for the chatting feature). Call pricing (per-minute) starts at $0.0010 for voice calls and $0.0014 for video calls, respectively. Unfortunately, for business push notifications, you’ll need to request a quote.
Sendbird pros and cons
| Pros | Cons |
| ✅ Highly customizable and flexible for building messaging experiences. | ❌ Missing key features like presence status and offline sync. |
| ✅ Easy to implement chat features with ready SDKs. | ❌ Some users report a learning curve during initial setup. |
#4: Intercom for conversational support
Intercom is a conversational support platform that helps you manage customer conversations through messaging, automation, and AI support.
Think of Intercom as your frontline support team, available right inside your product. You can use this customer engagement platform to connect your service team(s) with your users; it also gives you the flexibility of letting AI handle easier customer inquiries, and getting human customer service teams for the more complex ones.
Key features
- Live chat and omnichannel inbox: Manage conversations from chat, email, and social channels in one shared inbox. This helps teams manage customer interactions without switching between multiple customer service tools, improve response times, and maintain consistent communication.
- AI-powered chatbot (Fin): Use Fin, Intercom’s AI-powered chatbot, to automatically answer common questions and resolve repetitive support requests. This can reduce workload for customer service teams while still maintaining good customer satisfaction levels.
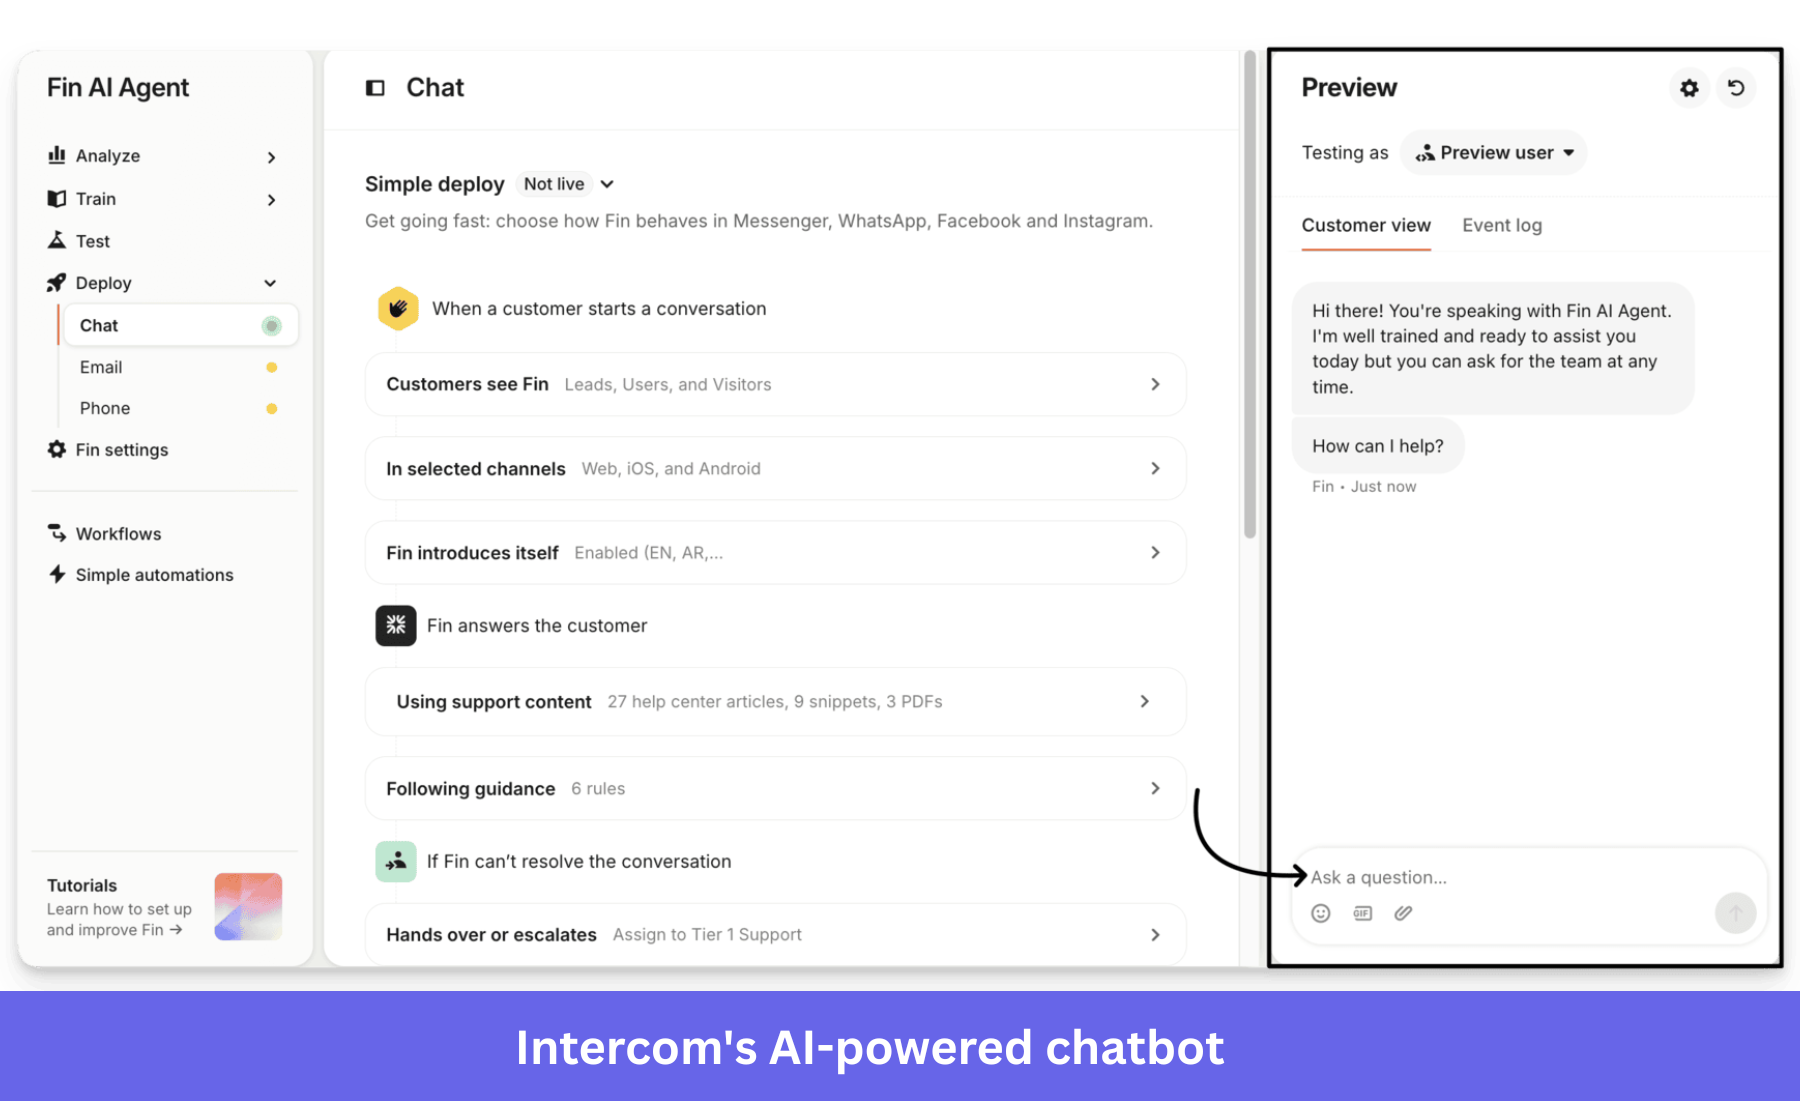
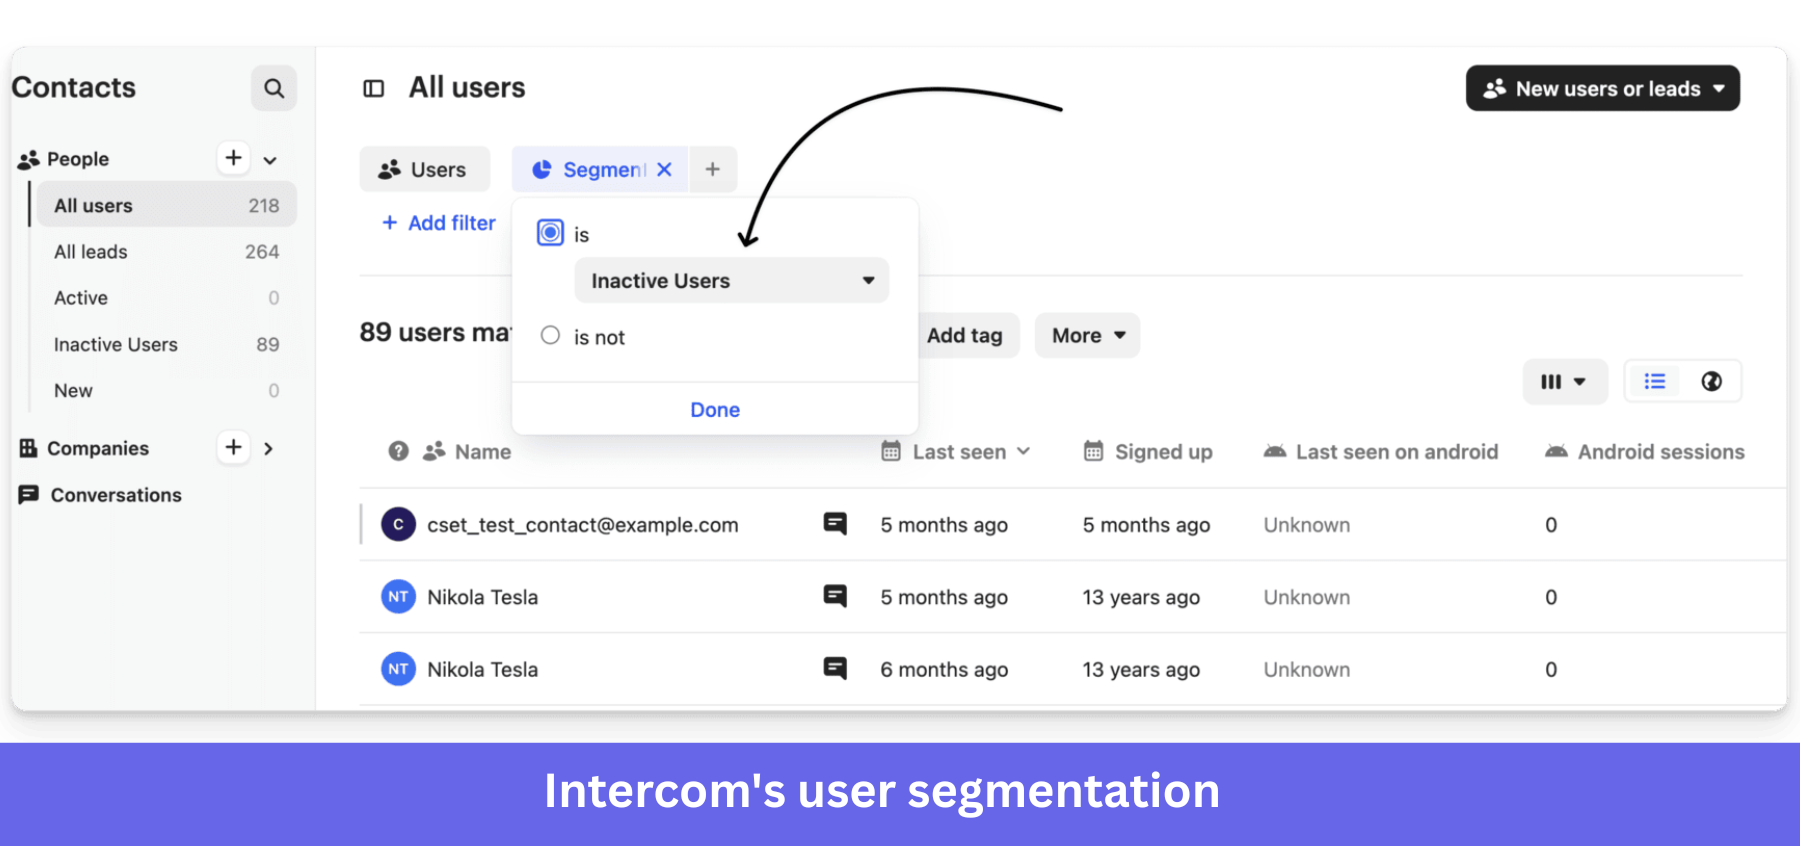
- User segmentation: Segment users based on attributes (like plan, location, lifecycle stage) or behavior (like feature usage or activity). Send more relevant messages, target the right users with campaigns, and personalize support instead of sending generic communication.
Intercom pricing
You’ll get the full AI + human support setup if you opt for the Intercom Suite. The company offers two products, “Intercom Suite” (which includes everything) and “Fin,” their AI chatbot, which you can buy on its own or as part of the Suite. The former is priced at $29/month per customer support seat, and the latter is priced at $0.99 per Fin resolution.
Pros and cons of Intercom
| Pros | Cons |
| ✅ Strong live chat and automation capabilities in one platform. | ❌ Learning curve and setup complexity for advanced use cases. |
| ✅ Powerful AI chatbot reduces repetitive support workload. | ❌ Less suitable for traditional ticket-based support. |
#5: Zendesk for ticketing and AI-powered self-service
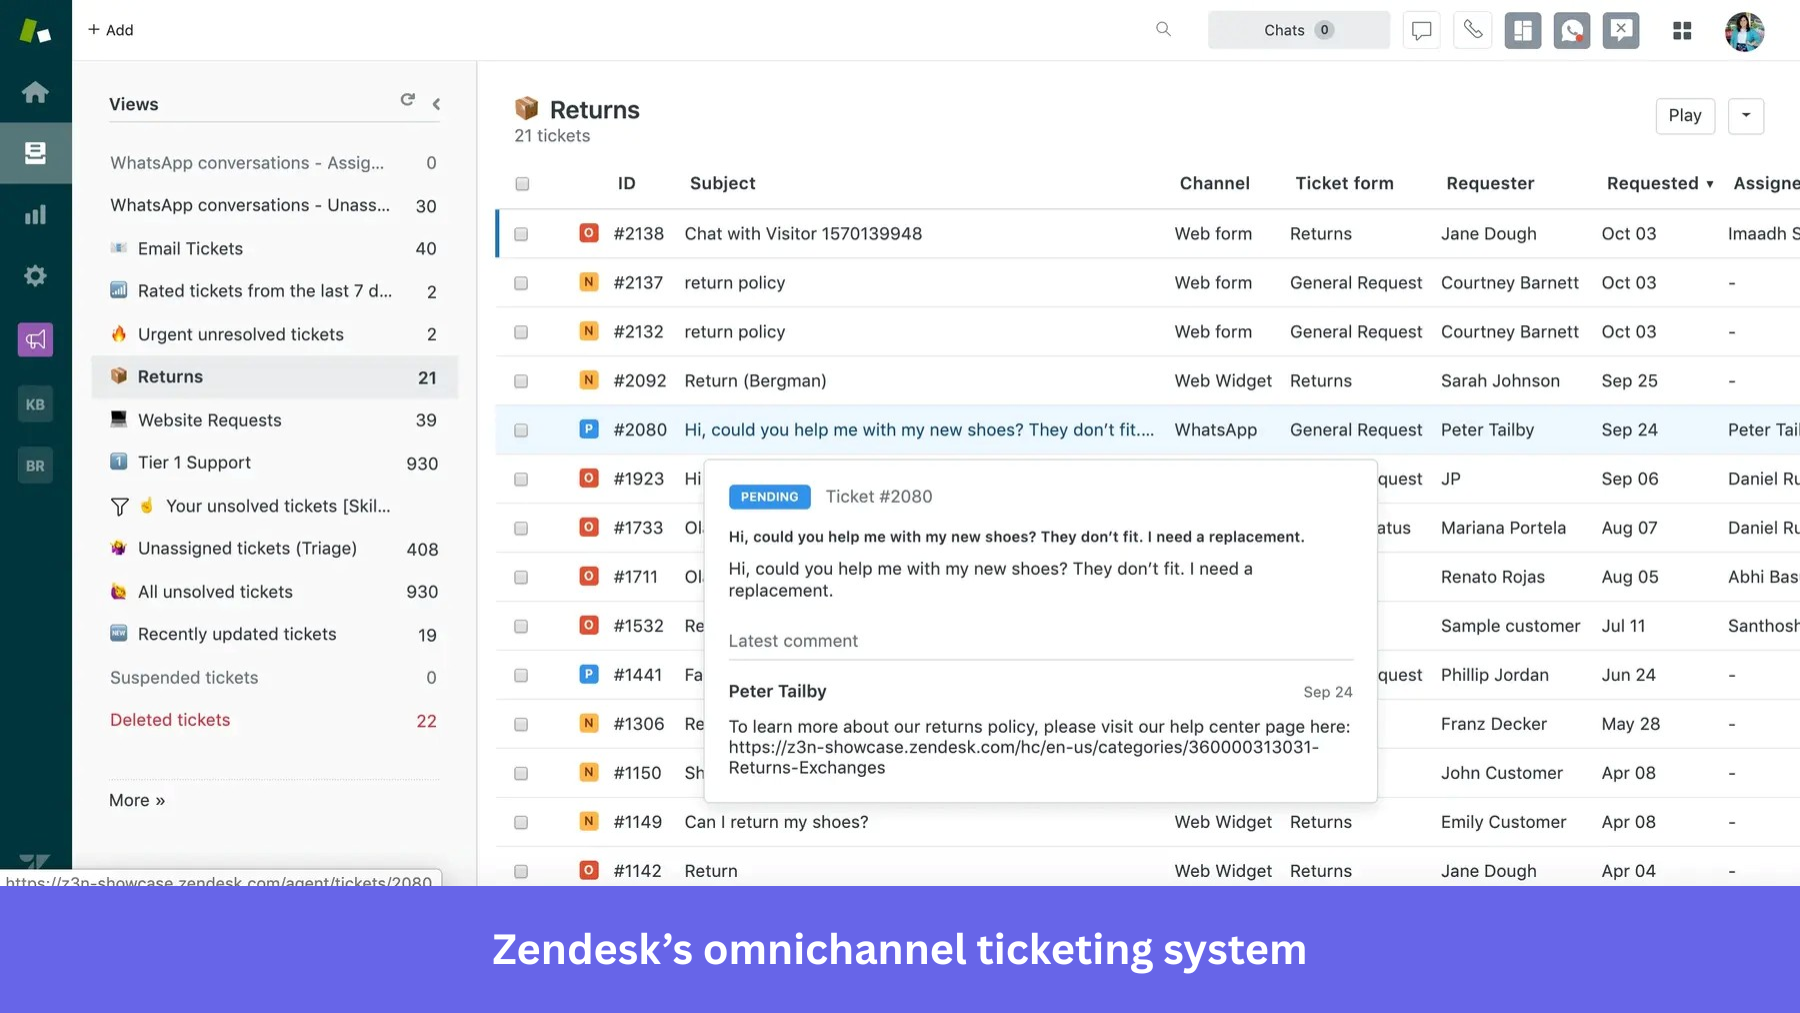
Zendesk is one of the godsend user engagement tools for busy customer service teams. It allows them to track every query (whether received through email, chat, social media platforms, or other channels) through a ticketing system.
It is built primarily for support teams that handle high volumes of customer conversations daily. Zendesk brings structure to customer communication and helps teams stay organized as they scale.
Key features
- Omnichannel ticketing system: Convert customer requests from email, chat, and social into organized tickets so nothing gets missed. You can also automatically route tickets to the right agent based on expertise, which helps improve resolution speed and overall customer satisfaction.
- AI knowledge base and self-service: Use Zendesk AI to suggest help articles and automate responses for common questions. This allows users to resolve issues without waiting for an agent. This is especially useful if you want to scale support without proportionally increasing headcount.
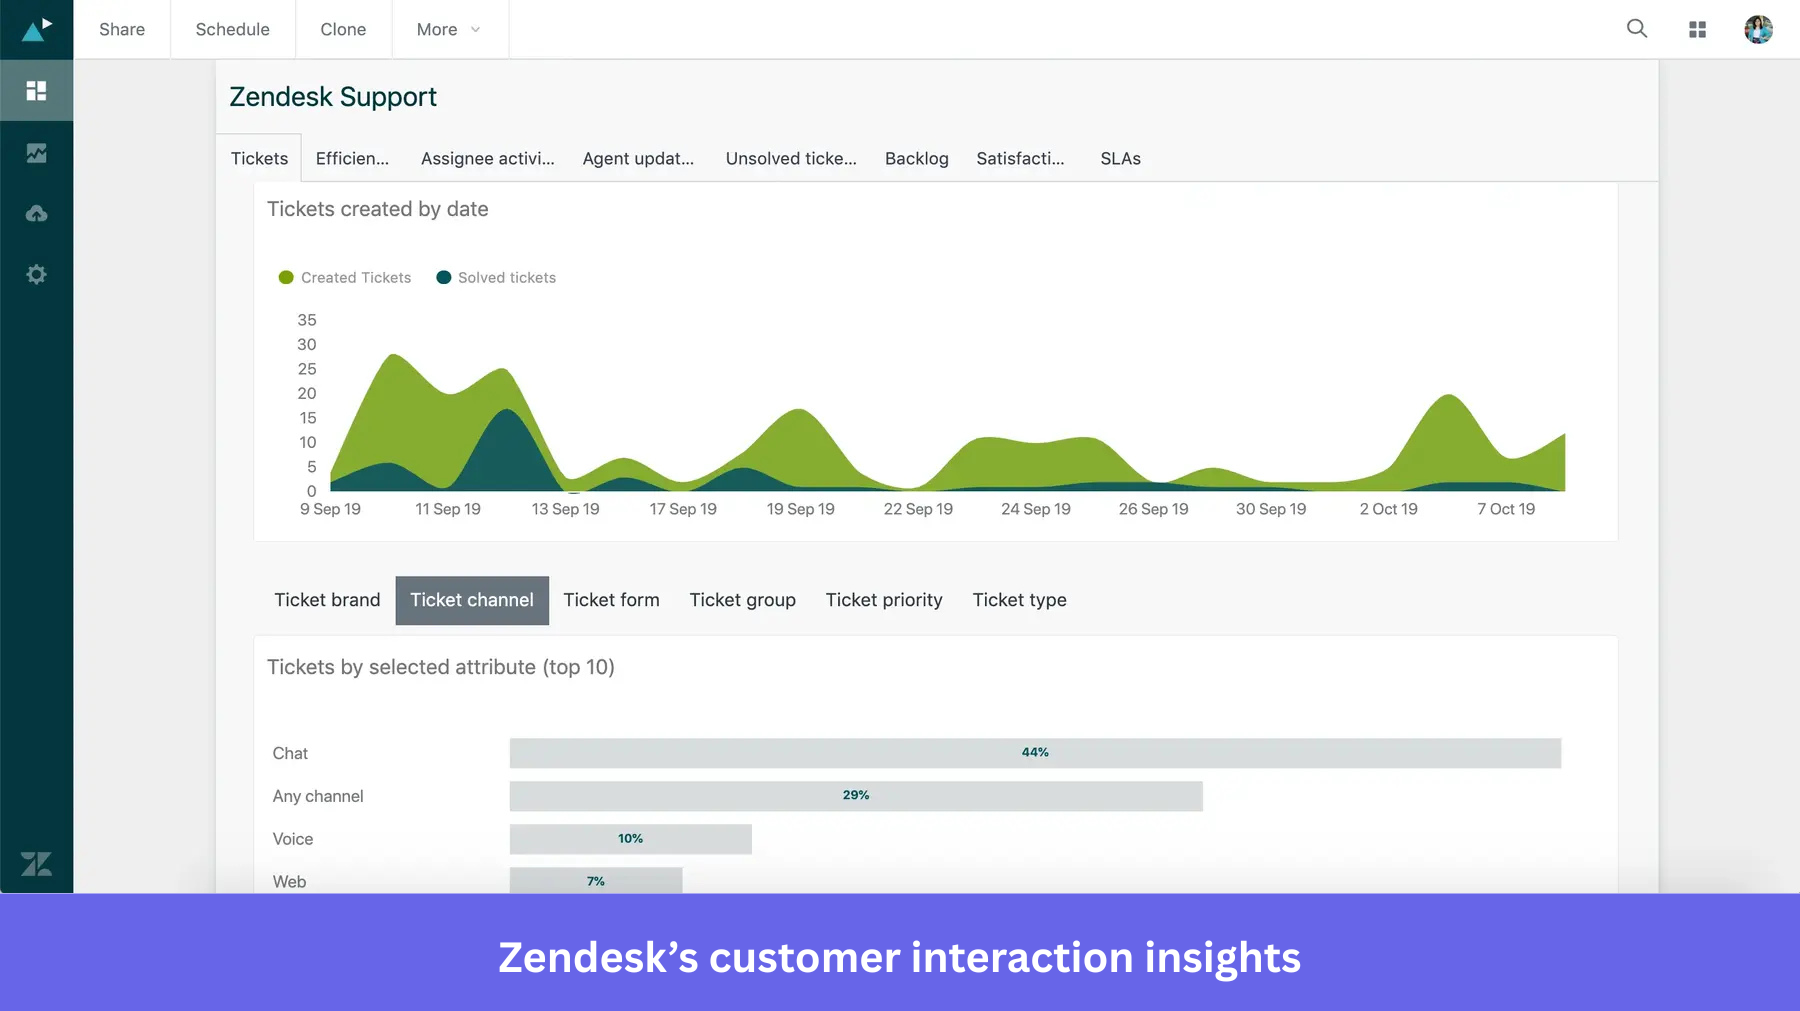
- Customer interaction insights: Zendesk provides reporting dashboards showing response times, resolution rates, and satisfaction scores. These insights help you understand how well your team handles customer interactions and where processes need improvement.
Zendesk pricing
Key features like Zendesk AI and customer ticketing are available with the starter $19/agent/month plan. However, advanced features like multi-channel support, complex gen-AI replies, or routing to the right agent, etc., will only be available with more premium plans (their “Suite Professional” plan is most popular amongst users, and is priced at $115/agent/month).
Pros and cons of Zendesk
| Pros | Cons |
| ✅ Powerful automation (macros, triggers) reduces repetitive work and improves response consistency. | ❌ Pricing increases quickly as you add agents, features, and add-ons. |
| ✅ Improves agent efficiency and consistency through standardized workflows and visibility. | ❌ Reporting interface can be confusing or difficult to navigate after updates. |
#6: Mailchimp for email marketing automation
Mailchimp is an email marketing platform designed primarily for startups and growing businesses that want to build lifecycle communication without complex setup.
It helps you create automated email campaigns, newsletters, and behavioral messaging to improve the customer journey. I see it used most often by early-stage teams that want simple campaign management with basic segmentation and reporting.
Key features
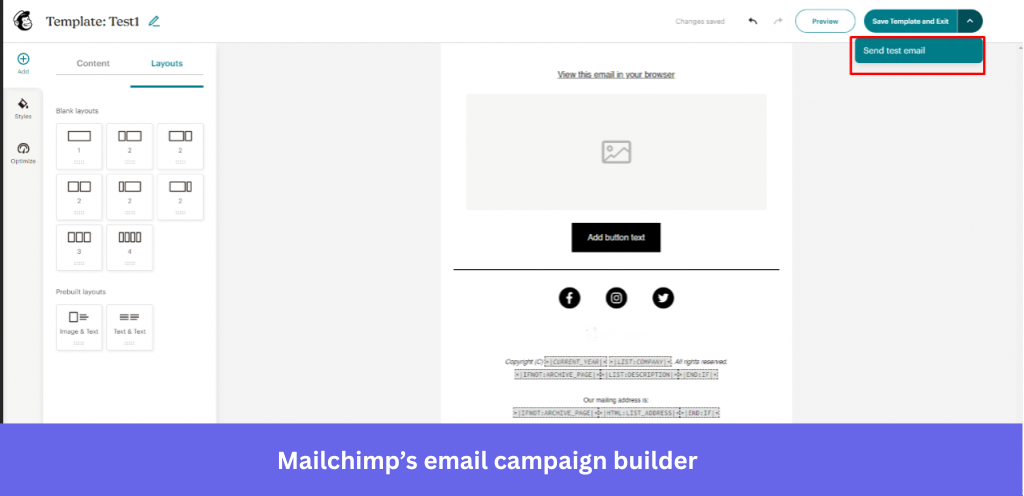
- Email campaign builder: Create emails using a drag and drop editor with prebuilt templates. This makes campaign creation accessible even for non-technical teams. You can also run A/B tests to optimize subject lines and messaging.
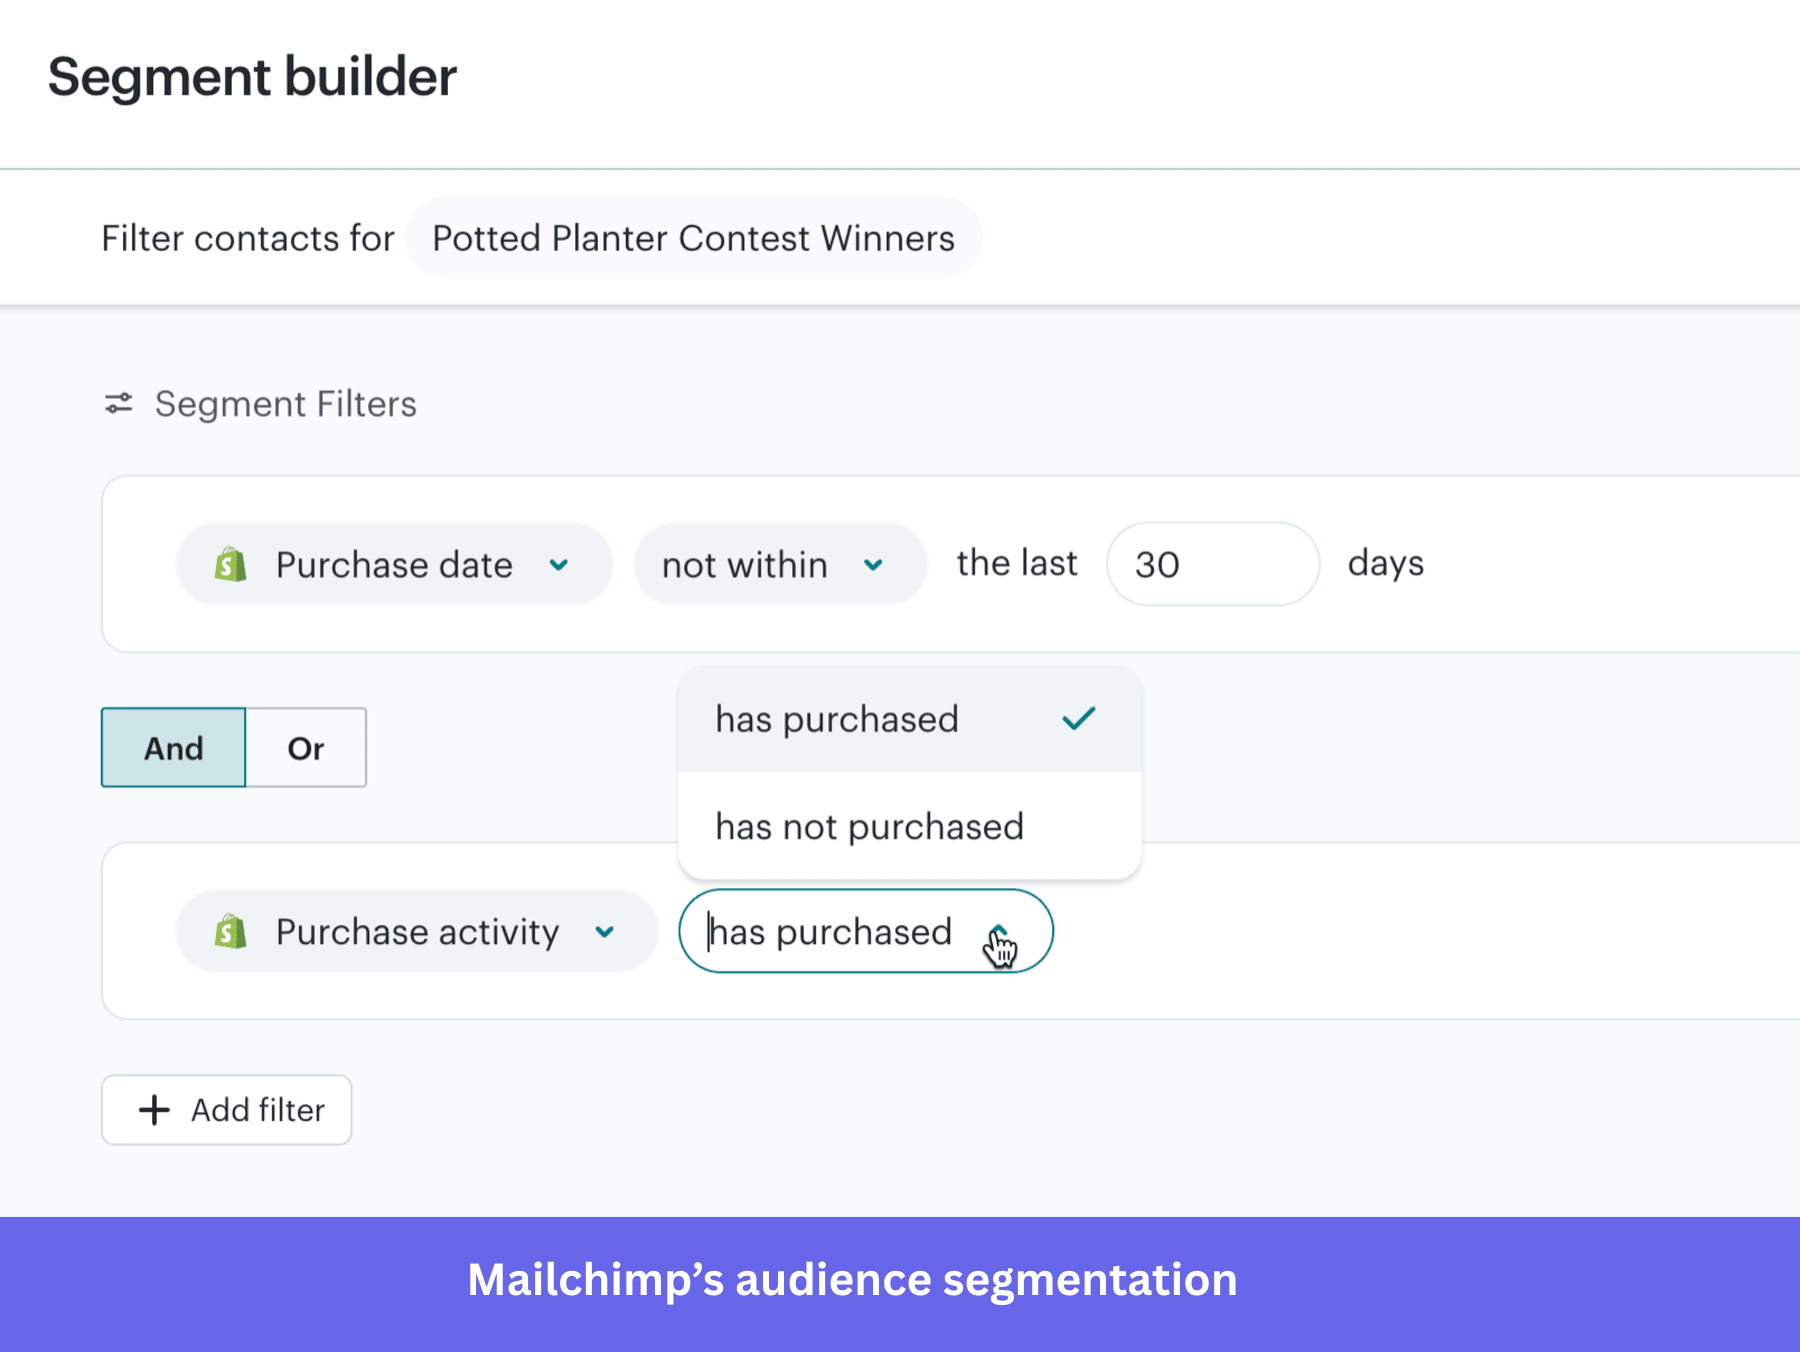
- Audience segmentation: Segment contacts based on engagement, demographics, or campaign activity. This helps personalize messaging based on customer behavior instead of sending generic campaigns.
- Marketing automation: Set up automated email sequences triggered by actions like signups or purchases. You’ll maintain ongoing communication with existing customers without manual effort.
Mailchimp pricing
Mailchimp’s lowest subscription tier begins with a free plan, but you can get access to its better features, such as audience segmentation, A/B testing, personal branding, etc., only with its Standard and Premium plans, which are priced at $20/month (500 contacts) and $350/month (10k contacts), respectively.
Pros and cons of Mailchimp
| Pros | Cons |
| ✅ Very easy to use with a clean interface and ready-made templates, so teams can launch campaigns quickly. | ❌ Automation builder feels limited and lacks flexibility for complex journeys. |
| ✅ Covers core email marketing needs well, including basic segmentation and automation. | ❌ Advanced features like A/B testing and deeper automation are locked behind higher plans. |
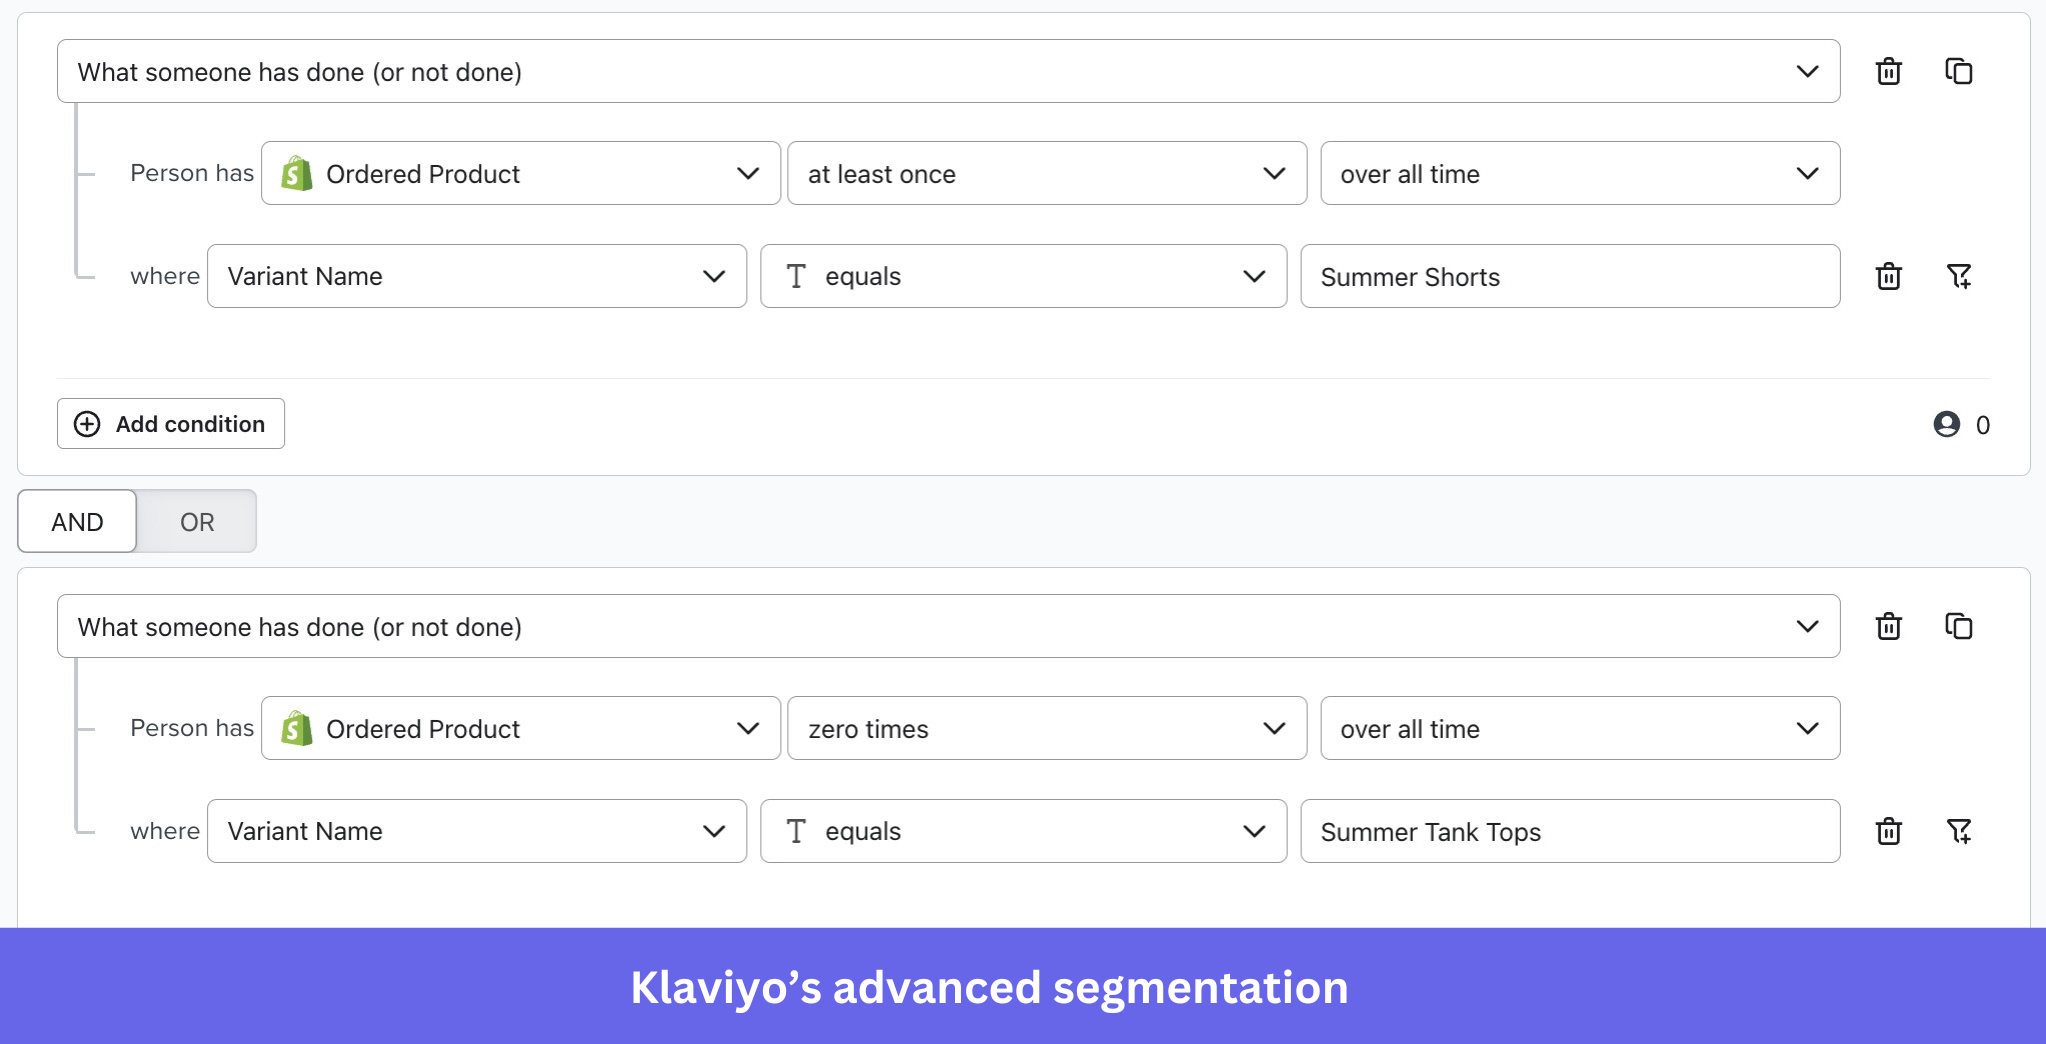
#7: Klaviyo for advanced lifecycle email and SMS engagement
Klaviyo is a marketing automation platform focused on lifecycle messaging through email and SMS, often used by e-commerce and enterprise brands.
It stands out for its deep segmentation and data-driven personalization capabilities. If your goal is to run highly targeted lifecycle campaigns and improve long-term customer relationships, this is where it tends to shine.
Key features
- Advanced segmentation: Build detailed segments based on purchase history, engagement patterns, and profile attributes. This helps you build more targeted lifecycle campaigns and improve long-term engagement.
- Email and SMS automation: Create automated email and SMS journeys triggered by customer actions to maintain consistent communication across touchpoints and improve retention.
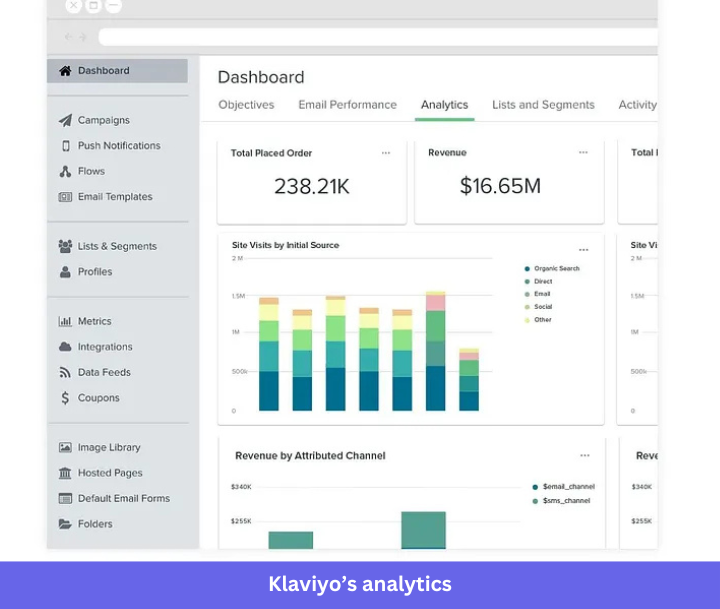
- Customer profiles and analytics: Klaviyo creates unified customer profiles combining engagement and purchase data. These insights help optimize campaigns aimed at improving customer lifetime value.
Klaviyo pricing
Klavyio’s pricing is completely dependent on how many users you have. At the very lowest tier (assuming you have around 250-500 monthly active users and only wish to send 150 SMS/MMS). Your “Email + SMS” pricing will begin at $20/month, which will integrate with 350+ solutions, allow you to send 5,000+ emails, showcase customer profiles, do multi-channel segmentation, etc.
However, if you’re an enterprise brand (with around 50-55k users and 100k SMS/MMS credits), Klavyio’s “Email + SMS” plan can cost you $1690/month, and go upwards as you scale.
Pros and cons of Klaviyo
| Pros | Cons |
| ✅ Automation flows are highly customizable (abandoned cart, post-purchase, win-back, etc.). | ❌ Interface feels dense when managing multiple flows and segments. |
| ✅ Easy-to-use automation that saves time and works well even without technical expertise. | ❌ Advanced features take time to learn, and pricing increases quickly as your contact list grows. |
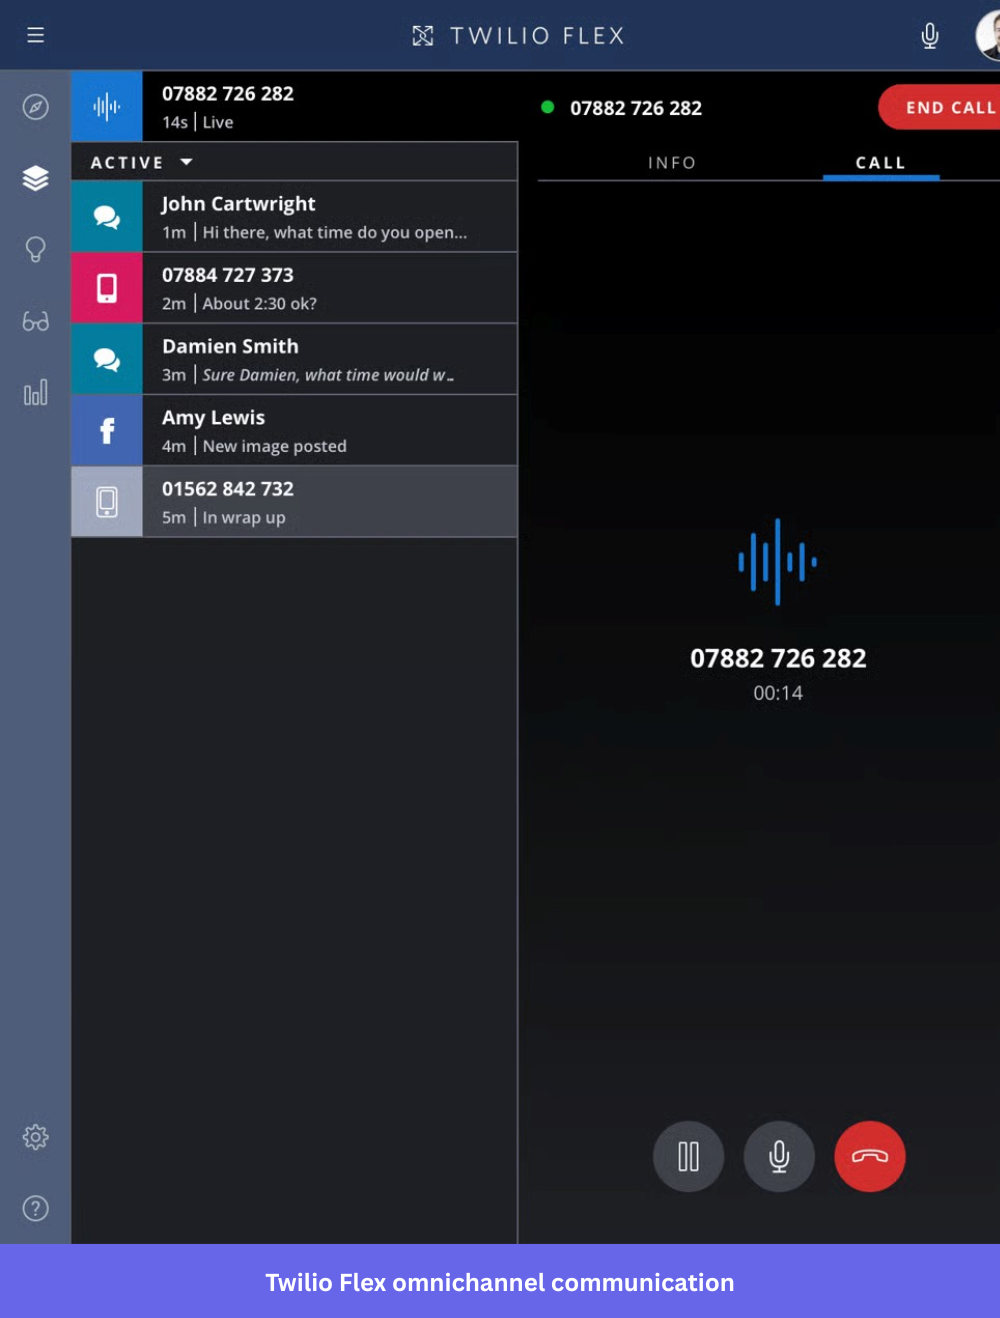
#8: Twilio Flex for communication through multiple channels
Twilio Flex is a one-stop shop for managing all types of customer engagements, regardless of whichever channel it occurs, for both sales and support teams.
What sets Flex apart from its competitors is the fact that this solution is completely programmable. That’s to say, you can control every part of your customer experience.
For example, you can customize how your agents view customer data, personalize web push notifications, and improve customer relationships by connecting your users with sales executives who speak their preferred language(s).
Key features
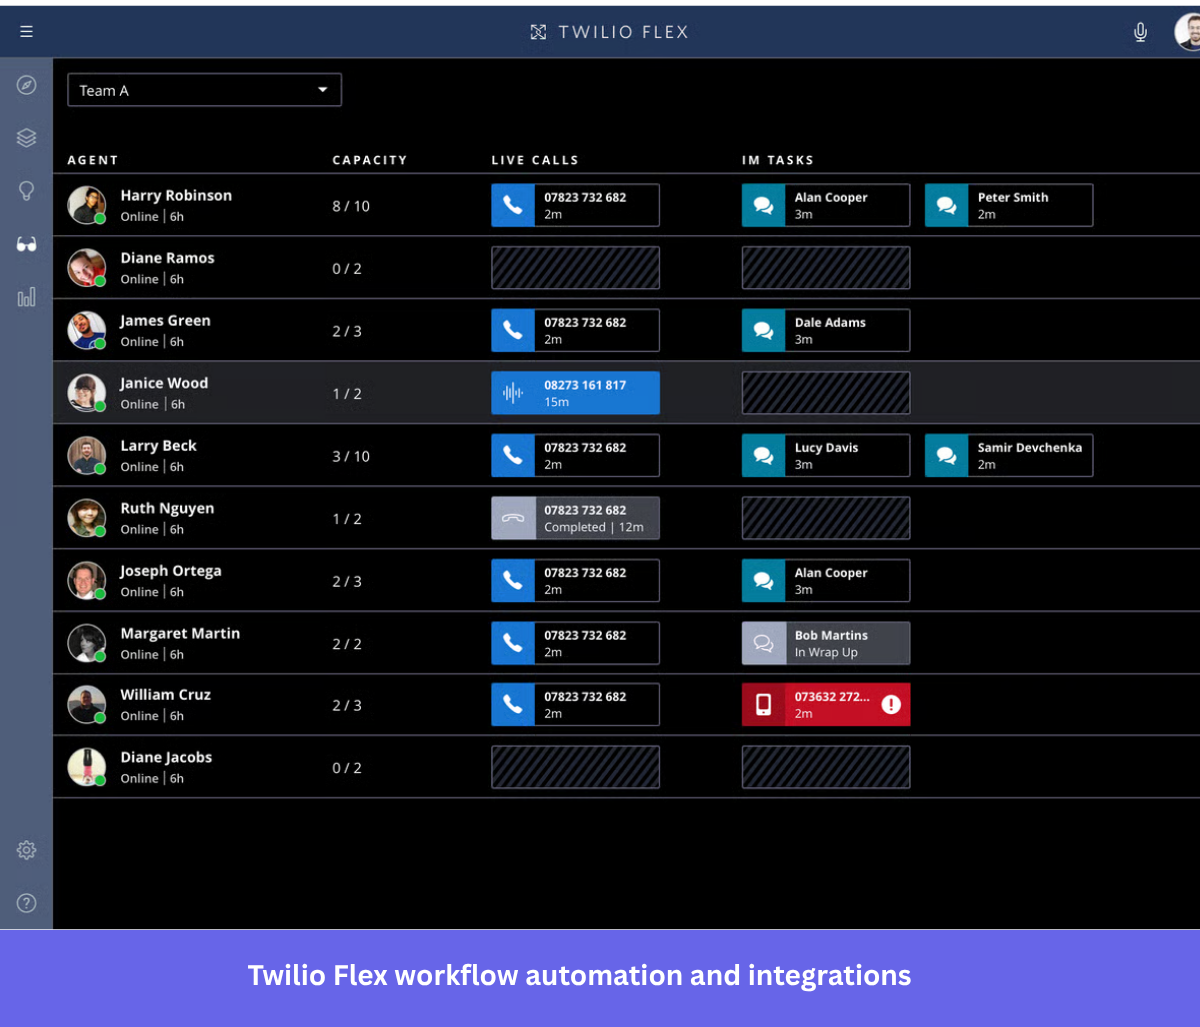
- Programmable contact center: Twilio Flex lets you customize nearly every part of the support experience through APIs and configuration. This flexibility helps teams design workflows that align with their specific customer engagement strategy rather than adapting to rigid tools.
- Omnichannel communication: Manage conversations across voice, SMS, chat, and social channels in one interface to reduce fragmented customer interactions and give agents better context.
- Workflow automation and integrations: Connect Twilio Flex with CRMs and other systems to route conversations intelligently and automate repetitive tasks.
Twilio Flex pricing
Twilio Flex offers two pricing models: $150 per named user/month or $1 per active user hour, depending on whether you prefer fixed seats or usage-based pricing. Additional communication costs (like SMS or voice) are billed separately based on usage.
Pros and cons of Twilio Flex
| Pros | Cons |
| ✅ Supports multi-channel communication (calls, chat, messaging) in one place, helping agents handle conversations together. | ❌ Reporting is limited out of the box and often needs customization to be useful. |
| ✅ Highly customizable. Teams can build their own contact center experience instead of adjusting to a fixed tool. | ❌ Bugs and performance issues reported, like lag, call issues, or chat failures. |
#9: MessageBird for customer communications with international support
If you’re a multi-national company, a customer engagement software like MessageBird can do wonders for you, and here’s why I think you’re going to like it:
Unlike other customer engagement platforms we previously discussed, this one has a global-first infrastructure. (I.e., it allows you to send messages (SMS/WhatsApp) globally, is aware of time zone constraints, uses regional numbers for messages to ensure better deliverability, etc.)
Multiple customer-facing teams (e.g., marketing, customer support, sales, etc.) can benefit from this solution as it’s built with different use cases in mind (and has templates to support such use cases).
Key features
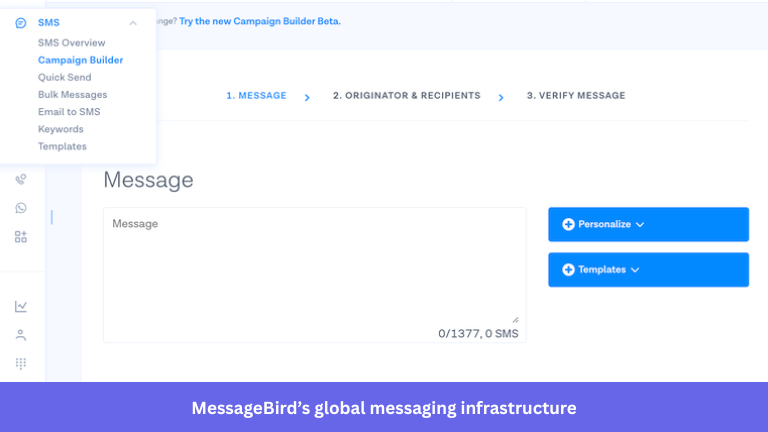
- Global messaging infrastructure: Send SMS, WhatsApp, and other messages globally using local numbers to improve deliverability. This is especially useful if you want consistent communication with international users without managing multiple vendors.
- Omnichannel communication platform: Manage conversations across SMS, chat apps, and email from one interface.
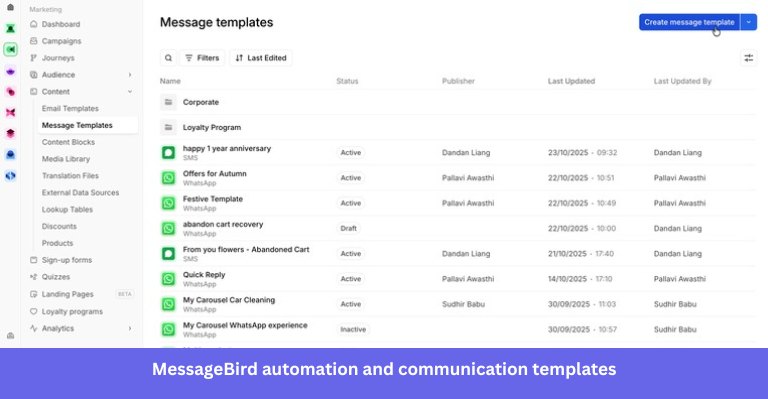
- Automation and communication templates: Use prebuilt templates and automation workflows for common use cases like notifications, marketing updates, and support replies.
MessageBird pricing
MessageBird now charges a base fee (starting at $49/month) for bundled usage and features, while still applying usage-based pricing when you exceed those limits or use additional channels.
Pros and cons of MessageBird
| Pros | Cons |
| ✅ Intuitive UI for managing conversations, especially for WhatsApp inbox workflows. | ❌ Frequent bugs and reliability issues (messages failing, APIs breaking, UI inconsistencies). |
| ✅ Supports multiple channels like SMS, WhatsApp, chat, and voice in one platform, | ❌ Billing issues and cancellation problems reported by users. |
Best customer engagement tools that help you collect customer data
Customer engagement is a part and parcel of any solution that claims to be the “best customer engagement software”. However, in this day and age, we require lots more from our user engagement tools. This includes managing customer data, providing us with valuable customer insights, tracking entire customer journeys, etc.
Safe to say, we don’t only want engagement; we need in-depth analysis of our user sessions to know what we’re getting right/wrong and where we can improve our experience(s). So, in this section, we’re going to be looking at tools that can help us achieve that.
#10: Userpilot for collecting both qualitative and quantitative data
Userpilot also helps you understand why users behave the way they do by combining product analytics with feedback collection. Instead of using separate analytics tools and survey platforms, I like how you can analyze customer behavior and collect feedback in one place.
Our solution tracks pages, events, and engagement patterns, replays sessions, and collects feedback through in-app surveys. Combined, these key features allow you to gather both qualitative and quantitative data.
Key features
- Automatic event tracking: Userpilot can automatically capture clicks, feature usage, and navigation patterns without requiring manual event setup. This helps you quickly understand how users interact with your product and identify friction points affecting engagement.
- Session replays: Watch session recordings to see how users actually navigate your product, where they hesitate, and where they drop off. I find this especially useful when trying to diagnose usability issues affecting customer satisfaction.
- Funnels, paths, and trend reports: Use funnel and path analysis to identify where users abandon workflows or struggle to complete key actions. Trend reports help you measure whether improvements actually increase engagement over time.
- Custom dashboards: Build dashboards combining engagement data, product usage, and feedback metrics. For example, you can track whether in-app messages or push notifications improved activation rates. This helps you connect engagement efforts directly to outcomes instead of guessing what works.

Userpilot pricing
Userpilot offers tiered pricing based on MAUs and features. Many advanced analytics capabilities like session replays, advanced reporting, and experimentation are typically available in Growth and Enterprise plans, while entry tiers focus more on core engagement features.
Pros and cons of Userpilot
| Pros | Cons |
| ✅ Combines engagement and analytics in one platform, reducing tool sprawl. | ❌ Many advanced analytics features (like session replays and advanced reports) are only available in higher-tier plans. |
| ✅ No-code setup makes data collection accessible to product teams. | ❌ May be expensive for very early-stage startups. |
#11: Amplitude for behavioral data
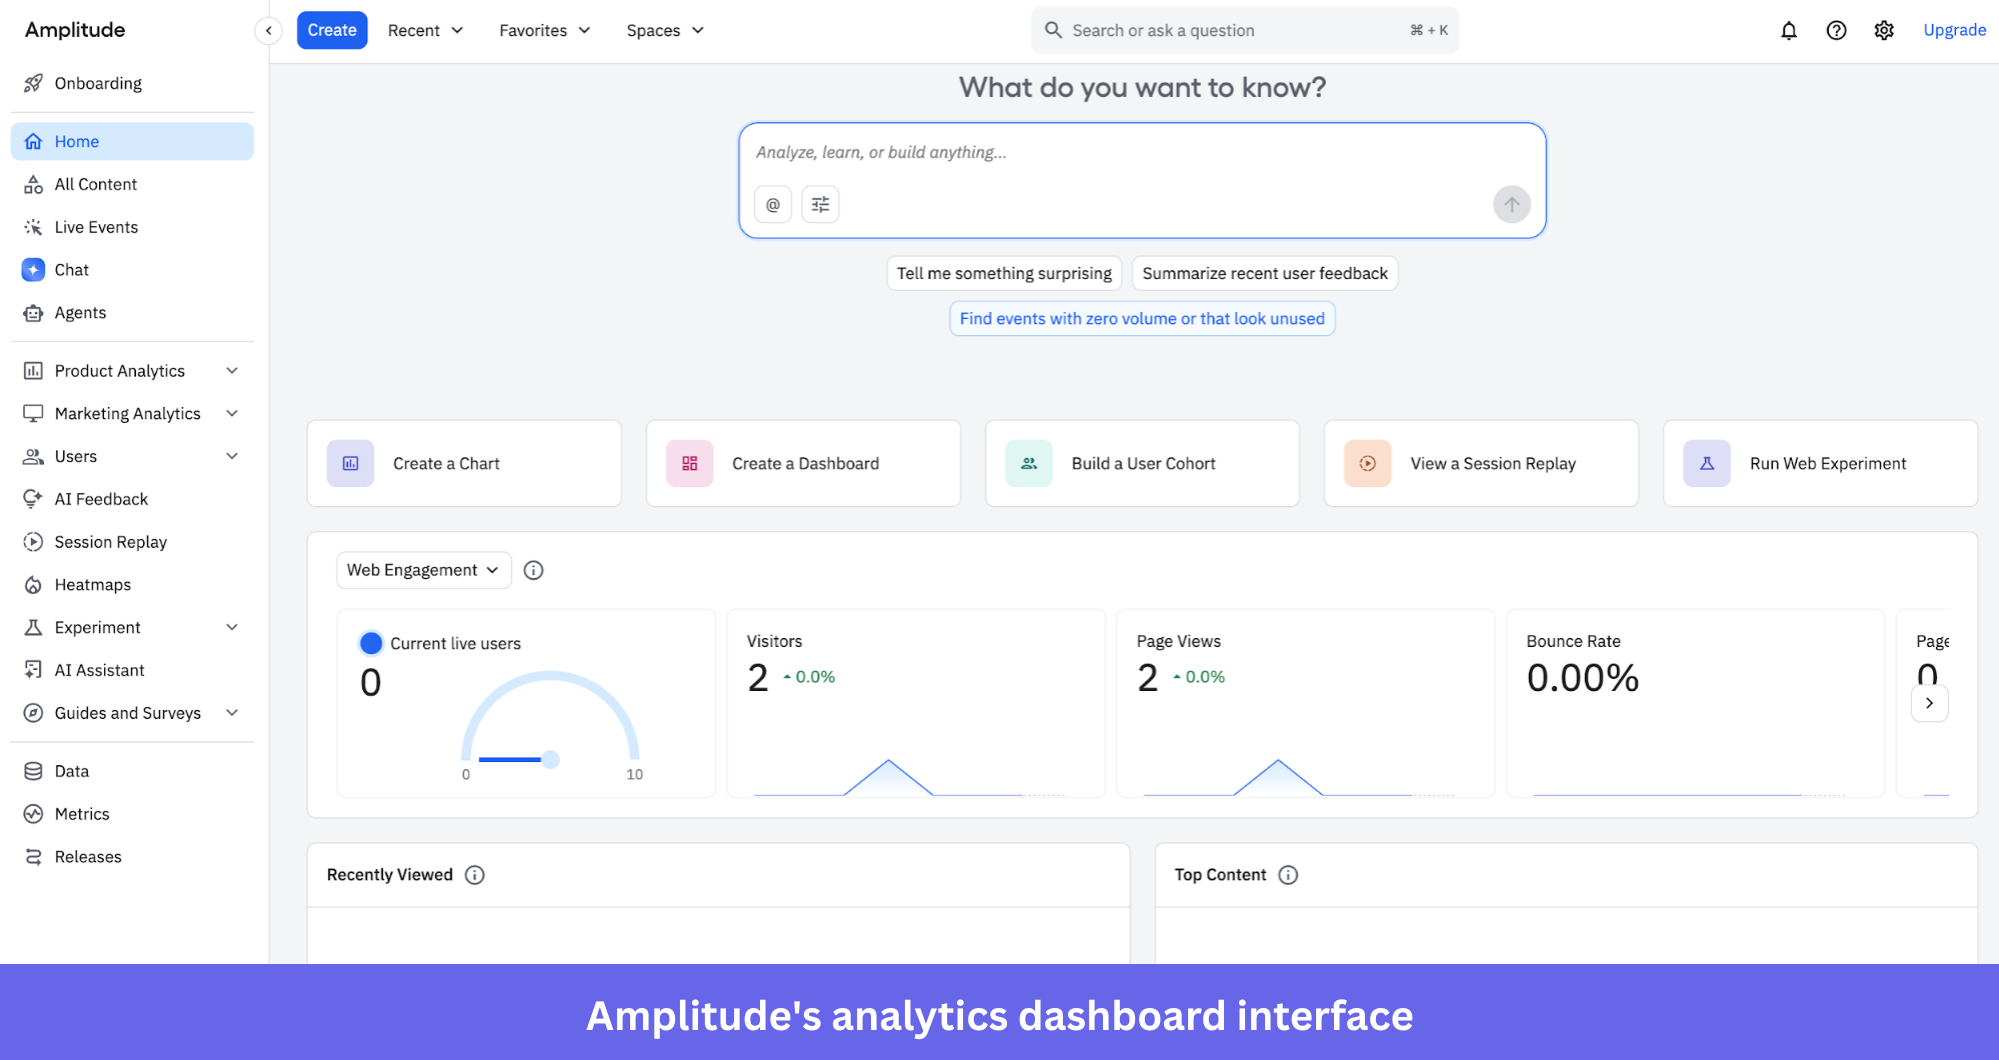
Amplitude is a product analytics platform focused on helping teams understand how users interact with their product and what drives retention.
If you wish to improve customer retention, Amplitude is one of the best user engagement tools specializing in analytics. It helps you analyze the full customer journey, track engagement trends, and identify which product experiences actually drive long-term usage.
Key features
- Journey and behavioral analytics: Amplitude lets you map complete user journeys and analyze how different segments move through your product. Identify friction points that negatively impact the customer experience.
- Product experiments: Run experiments to test different features, UI changes, or onboarding improvements. This helps product teams make data-driven decisions instead of relying on assumptions.
- Session replays and engagement insights: Session replay and behavioral reports help you understand how users interact with features and where engagement drops. These insights can help you refine onboarding and improve retention outcomes.
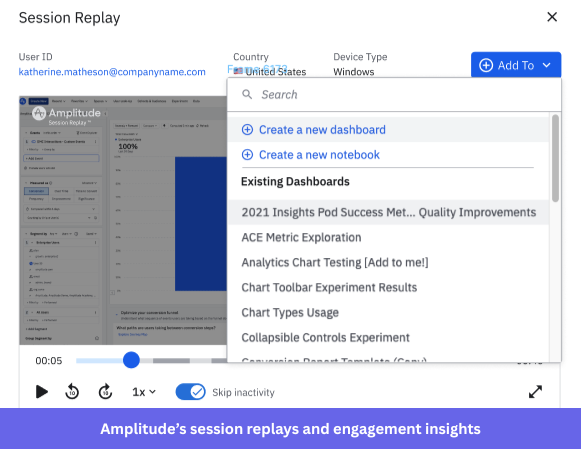
Amplitude pricing
Amplitude follows a freemium, MTU-based pricing model (monthly tracked users). Paid plans start at around $49/month and unlock higher user limits and more advanced analytics capabilities, while Growth and Enterprise plans add governance, security, and deeper behavioral insights with custom pricing.
According to Vendr data, Amplitude’s enterprise contracts have a median annual cost of about $64K, depending on data volume and add-ons.
Pros and cons of Amplitude
| Pros | Cons |
| ✅ Strong segmentation. You can slice user data by behavior, events, and user properties in detail. | ❌ Data retention limits (e.g., historical data constraints) can restrict long-term analysis. |
| ✅ Clear funnel and retention analysis helps identify drop-offs and growth opportunities. | ❌ Limited flexibility in some analyses (e.g., segmentation constraints, missing features). |
#12: Pendo for product planning and growth
Pendo allows you to track user sentiments and see how users engage with your product, which paths they use, features they like the most, where they drop off and on, etc., across both web and mobile apps. I see it as a strong choice if you want to connect product analytics, user feedback, and in-app engagement to guide product growth.
Key features
- Product and path analytics: Track feature adoption, user paths, and engagement trends to understand what drives retention. Plus you can identify where users drop off and which workflows need improvement.
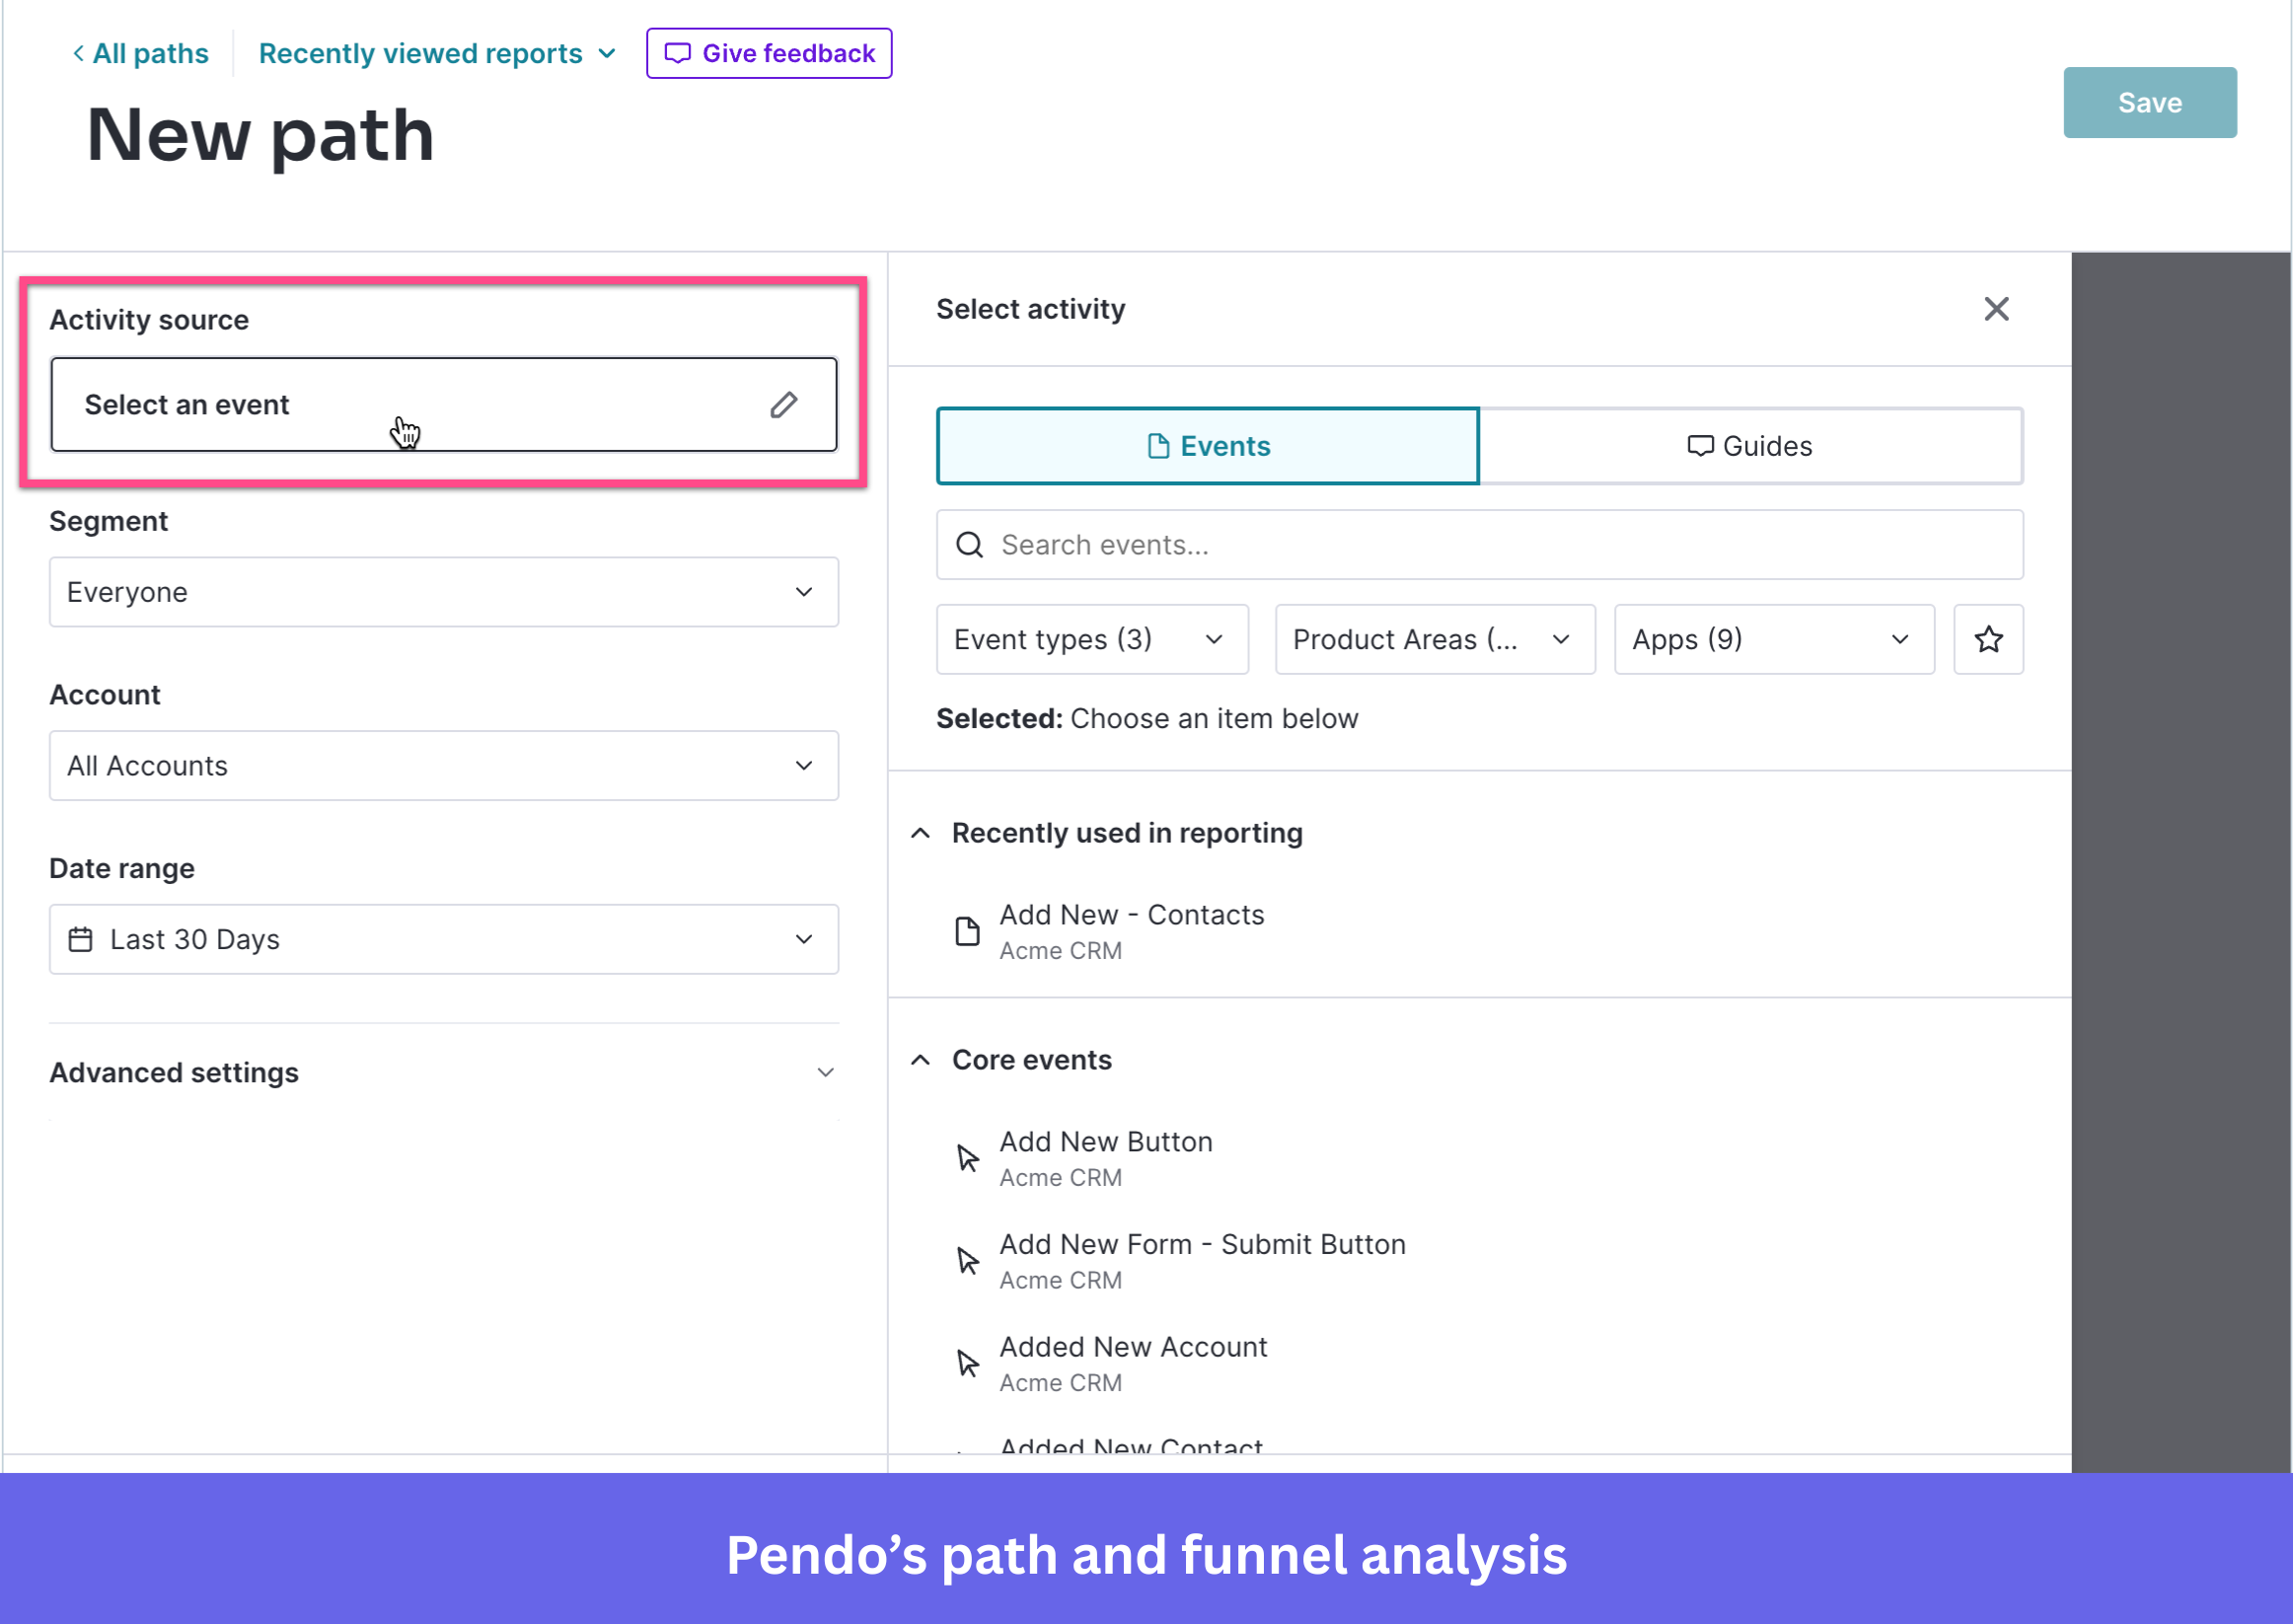
- In-app guides and feedback: Create in-app guides and collect feedback to understand user sentiment alongside behavioral data. This helps you connect what users do with what they say.
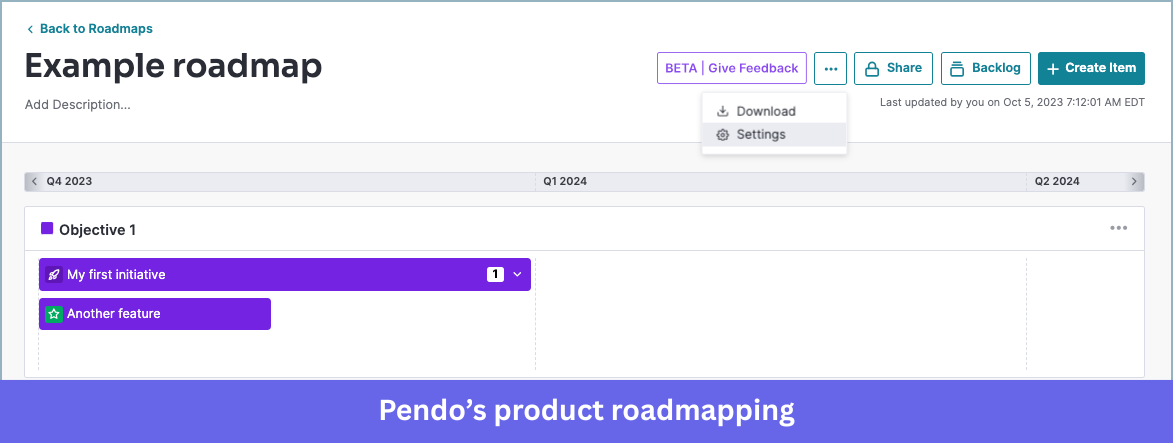
- Product planning insights: Use behavioral data and feedback to prioritize roadmap decisions and validate new ideas. Particularly useful for product teams focused on long-term customer engagement improvements.
Pendo pricing
Pendo offers a free plan for up to 500 MAUs with basic product analytics, in-app guides, and NPS surveys. Paid plans (Base, Core, and Ultimate) use custom pricing based on MAUs and selected features. According to data from Vendr, the median annual cost of Pendo is around $48,500/year, although actual pricing varies widely depending on company size and feature requirements.
Pros and cons of Pendo
| Pros | Cons |
| ✅ Strong feature usage analytics that show exactly how users interact with specific UI elements. | ❌ Guide customization and metrics are limited compared to expectations. |
| ✅ Helps teams identify friction points and improve product adoption with real usage data. | ❌ Initial setup and tagging can be time-consuming and sometimes finicky. |
#13: Hotjar for heatmap and scroll analysis
Hotjar categorizes its service offering into three brackets:
- Observe (allows you to observe user behavior through heatmaps and session recordings).
- Ask (you can ask for customer feedback through surveys and a feedback button).
- Engage (lets you engage users by conducting interviews or running A/B tests on target users).
Key features
- Heatmaps and scroll analysis: Hotjar shows exactly where users click, move, and how far they scroll on your pages. These visual insights help you quickly identify ignored sections, confusing layouts, or CTAs that aren’t getting attention so you can improve engagement.

- Session replay: You can watch real user sessions to see how people actually navigate your product. These recordings help you spot friction points, broken flows, or UX issues that might be hurting conversions.
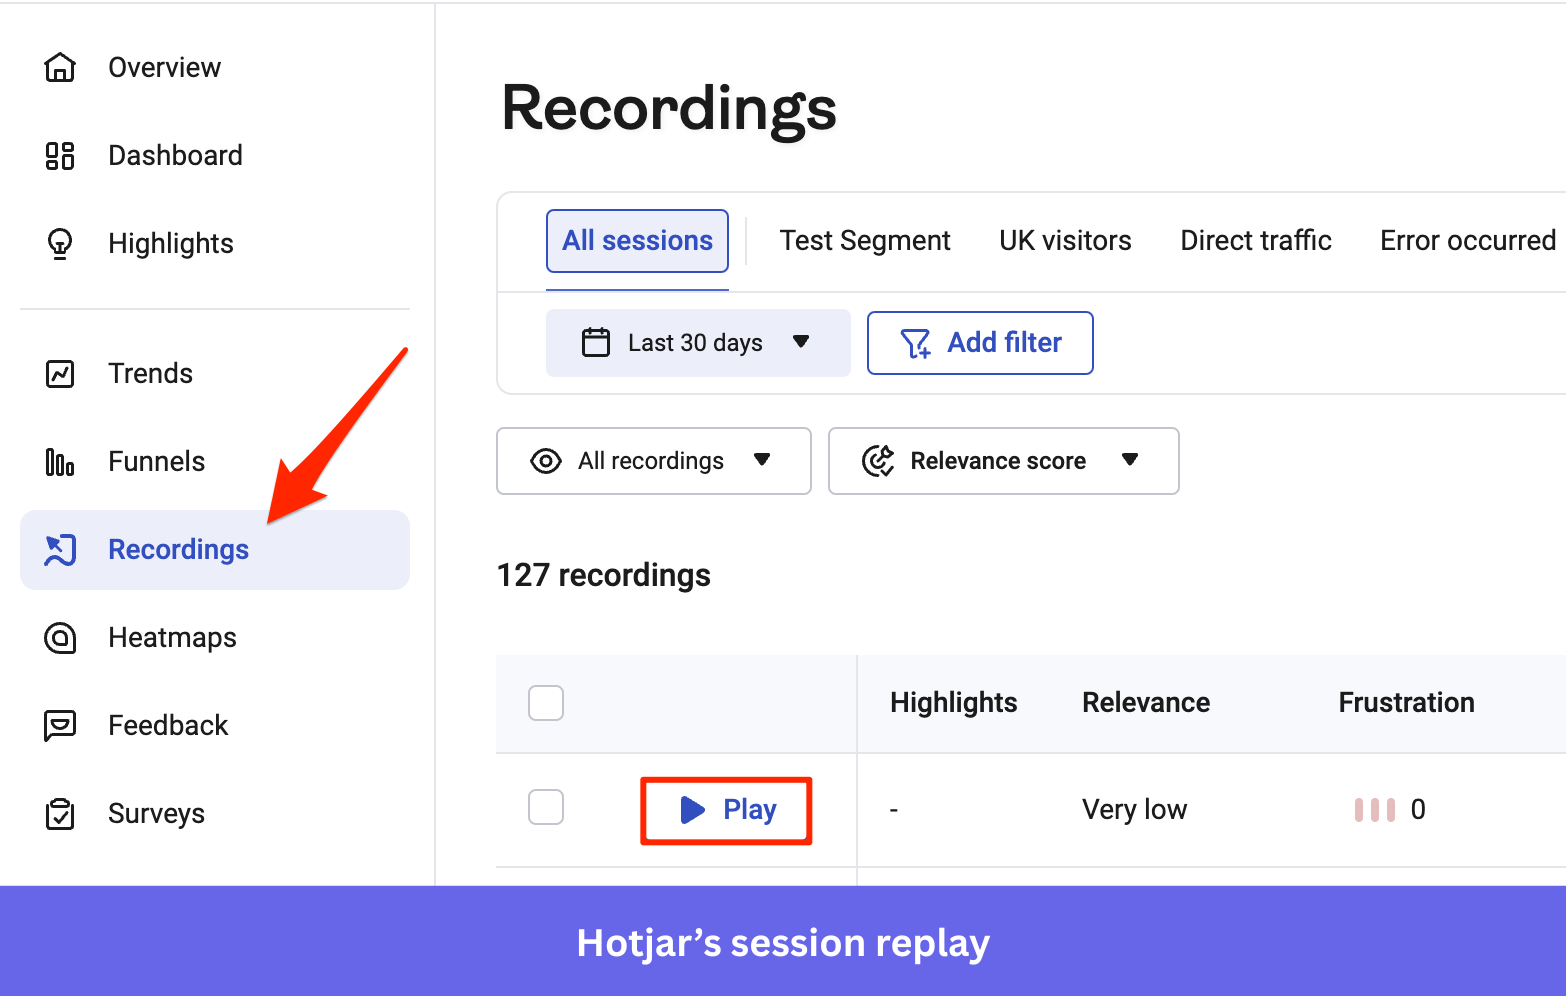
- Feedback tools (surveys and feedback widgets): Hotjar lets you collect feedback directly on your pages using surveys and feedback buttons. You can understand why users behave a certain way instead of just seeing the numbers.
Hotjar pricing
Hotjar follows a modular pricing model where Observe, Ask, and Engage are priced separately. It offers a free Basic plan, while paid Observe plans start at around $39/month (paid annually), with higher tiers adding more sessions and longer data retention. Enterprise pricing is custom.
Pros and cons of Hotjar
| Pros | Cons |
| ✅ Shows exact user hesitation and drop-offs through recordings and heatmaps, so you can fix specific friction points. | ❌ Session recording limits restrict visibility unless you upgrade. |
| ✅ Quick setup and usable without technical skills, so teams can start getting insights fast. | ❌ Filtering and segmentation are limited when handling large data. |
#14: AppMetrica for mobile and attribution analysis
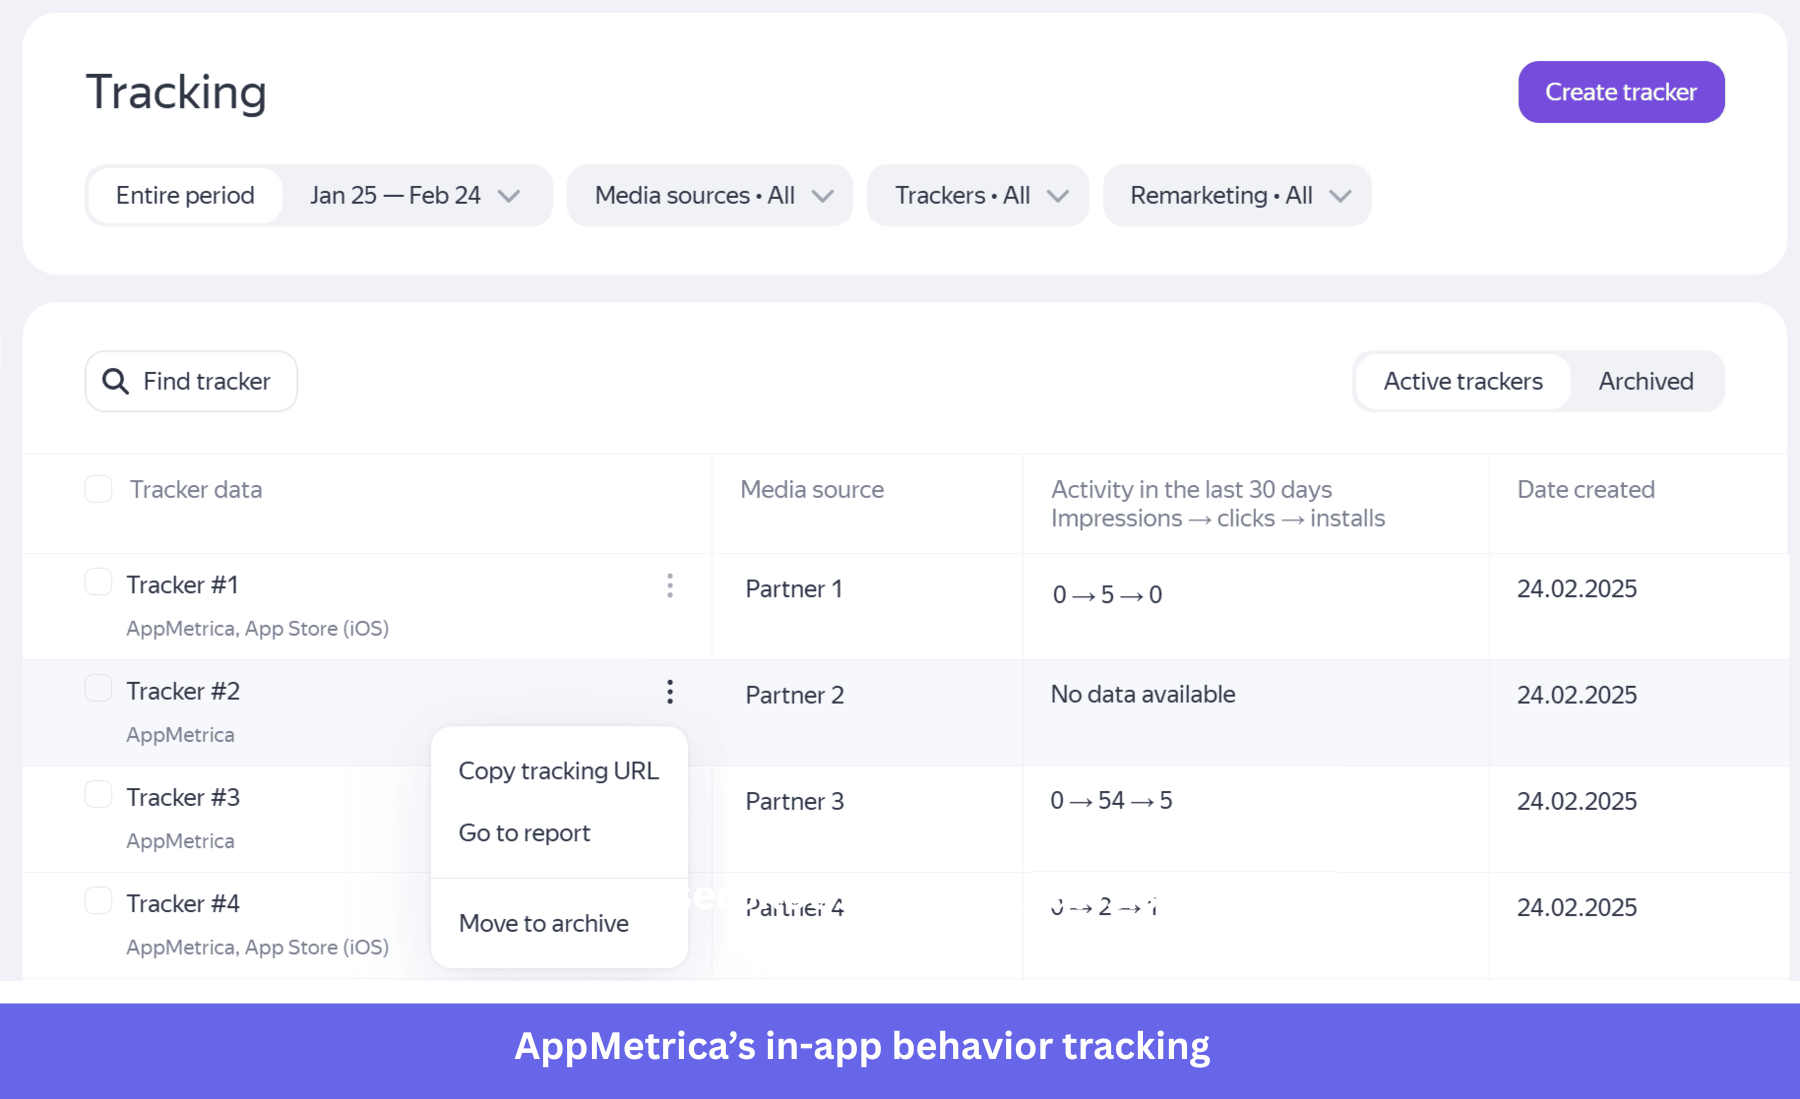
AppMetrica is a mobile-first customer engagement software built for teams that want to know exactly what users do after installing their app. It tracks everything from in-app behavior and session activity to install sources and crash reports, all in one dashboard.
This customer engagement software is especially handy for tying user actions back to marketing channels. This way, you can see which channels drive engaged users instead of installs.
Key features
- Mobile attribution analytics: AppMetrica shows where your installs come from and what users do after they download your app. You can analyze which campaigns bring high-quality users so you can invest your marketing budget more effectively.
- In-app behavior tracking: You can track sessions, events, and user paths in your mobile app with minimal setup. These insights help you understand engagement patterns and identify where users drop off.
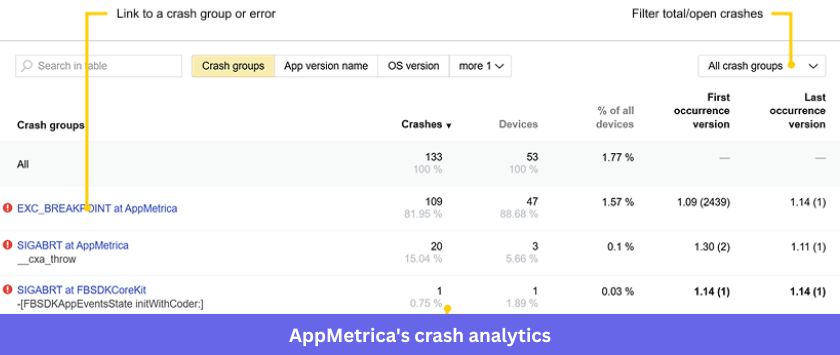
- Crash analytics and stability monitoring: It automatically detects crashes and performance issues and shows how they impact user sessions. This makes it easier for teams to prioritize fixes that directly affect retention.
AppMetrica pricing
AppMetrica offers a free plan with analytics, attribution, crash reporting, and up to 100M events per month. Paid plans start at around $90/month and scale based on event volume, with larger setups reaching ~$3,000/month for high-usage apps.
Pros and cons of AppMetrica
| Pros | Cons |
| ✅ Easy event tracking and setup, even without a dedicated analytics team. | ❌ Slower performance when handling large datasets. |
| ✅ Free plan covers most small app needs and is easy to integrate. | ❌ Data inconsistencies and unreliable reports reported by users. |
Best customer engagement solutions that help you gather feedback
Understanding user behavior tells you what is happening. Feedback tells you why. And you need both if you want to improve customer engagement.
The tools below focus on helping you collect contextual feedback through in-app surveys, NPS, and targeted questionnaires so you can make better product and experience decisions.
#15 Survicate for in-app and contextual feedback collection
Survicate is a feedback platform built for teams that want to collect feedback at the right moment instead of sending generic surveys later.
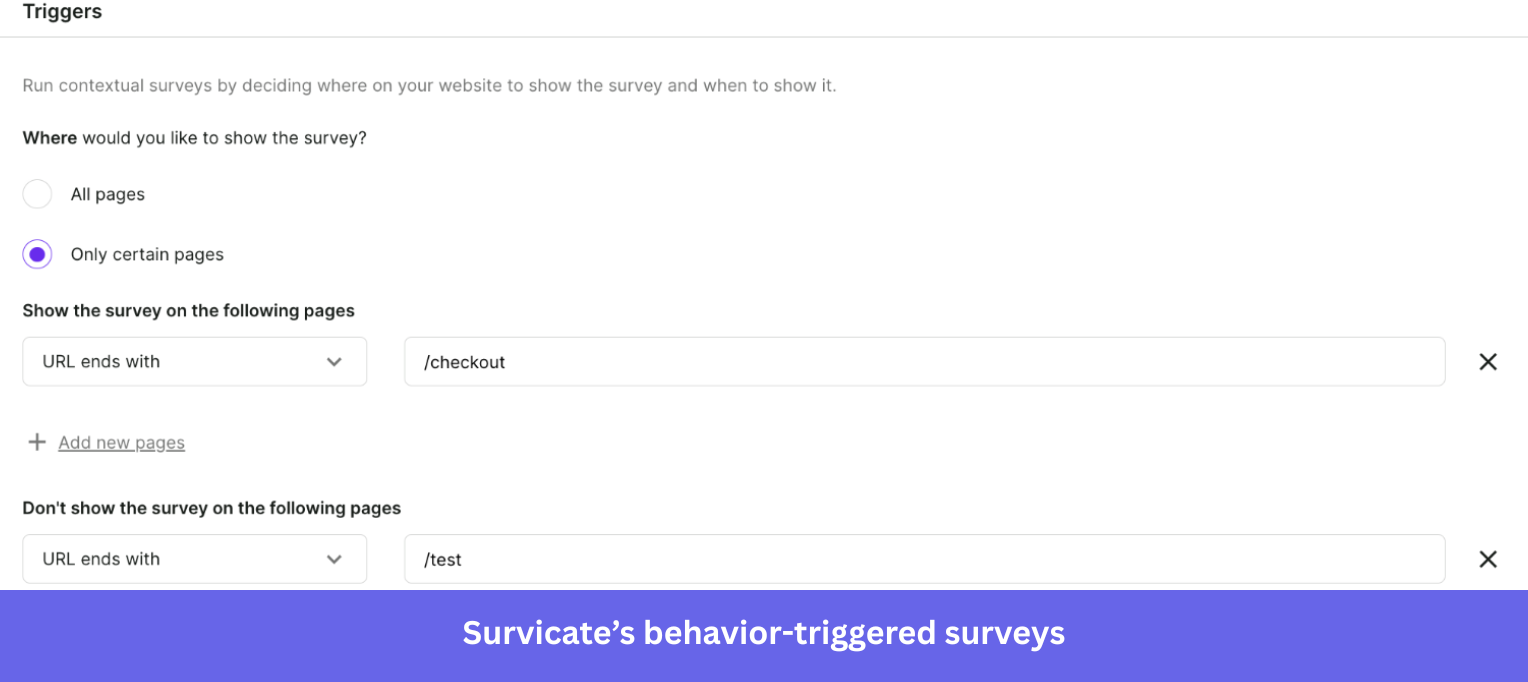
If you want to ask questions while users are actively using your product, Survicate makes that easy. For example, you can trigger a short survey right after someone completes a key action to understand what worked (or what didn’t).
Key features
- Behavior-triggered surveys: You can launch surveys based on actions, segments, or timing. For example, showing a quick question after feature usage helps you collect feedback while the experience is still fresh.
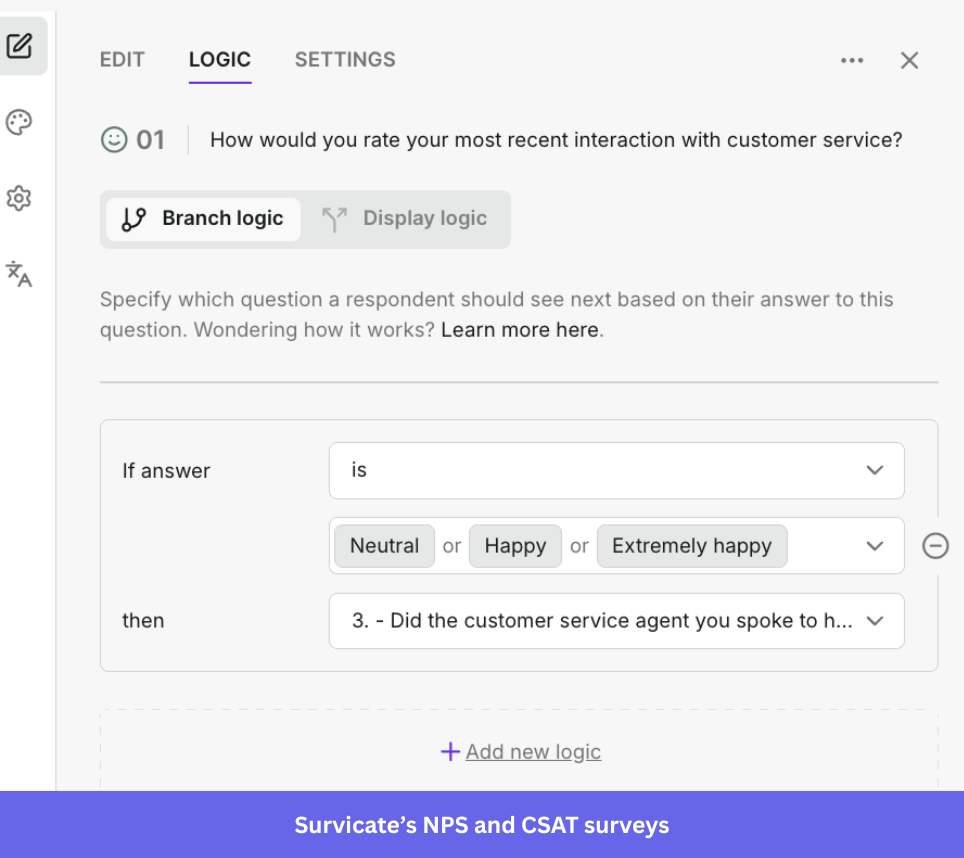
- NPS and CSAT surveys: Survicate lets you measure loyalty and satisfaction with ready-to-use NPS and CSAT templates. This makes it easier to track sentiment trends without building surveys from scratch.
- AI feedback analysis: Instead of manually reading responses, Survicate helps you automatically group answers and spot patterns. This helps you find common complaints or feature requests faster.
Survicate pricing
Survicate offers a free plan with limited responses. Paid plans start at about $89/month, with higher tiers adding more responses, better targeting, and advanced reporting. Enterprise plans come with custom pricing.
Pros and cons of Survicate
| Pros | Cons |
| ✅ Clean UI with visual logic mapping, so you can easily understand survey flows. | ❌ Audience targeting and segmentation feel limited for complex use cases. |
| ✅ Very fast to set up with a no-code survey builder and drag-and-drop creation. | ❌ Dashboard is too complex and difficult to understand. |
#16: Typeform
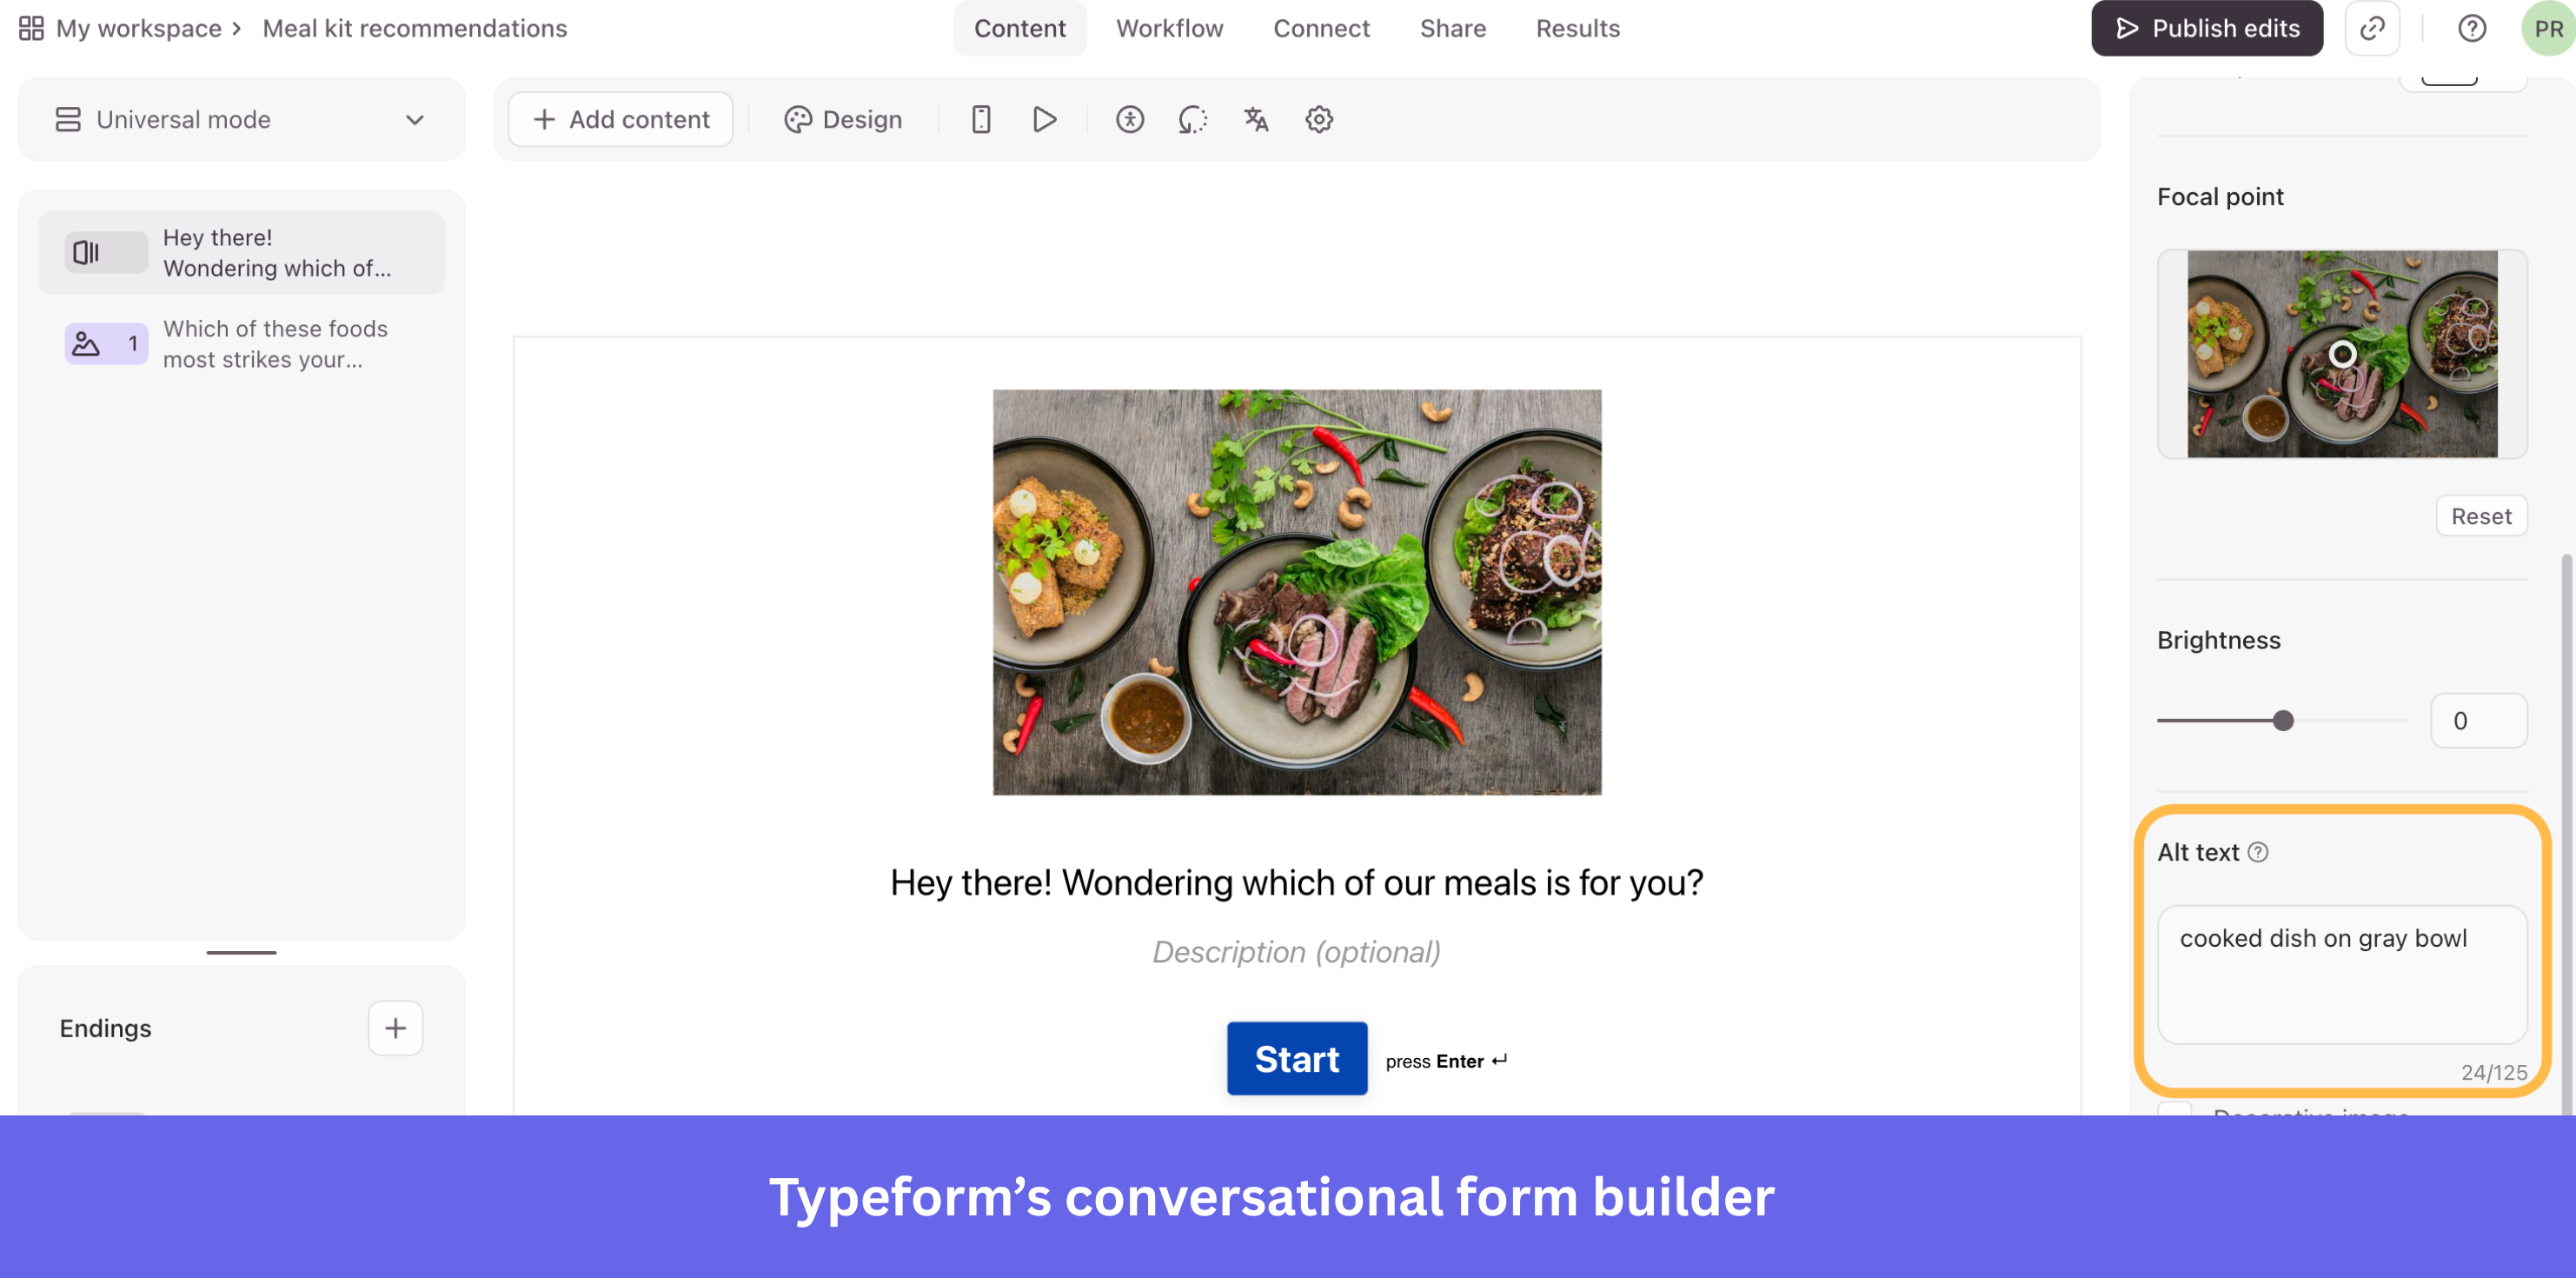
Typeform turns boring data collection into a conversation. It presents questions one at a time, which keeps users focused and improves completion rates. The forms look beautiful and work great on mobile devices.
Key features
- Conversational form builder: Typeform shows one question at a time to make surveys feel more like a conversation. This reduces friction and can help improve completion rates compared to traditional long forms.
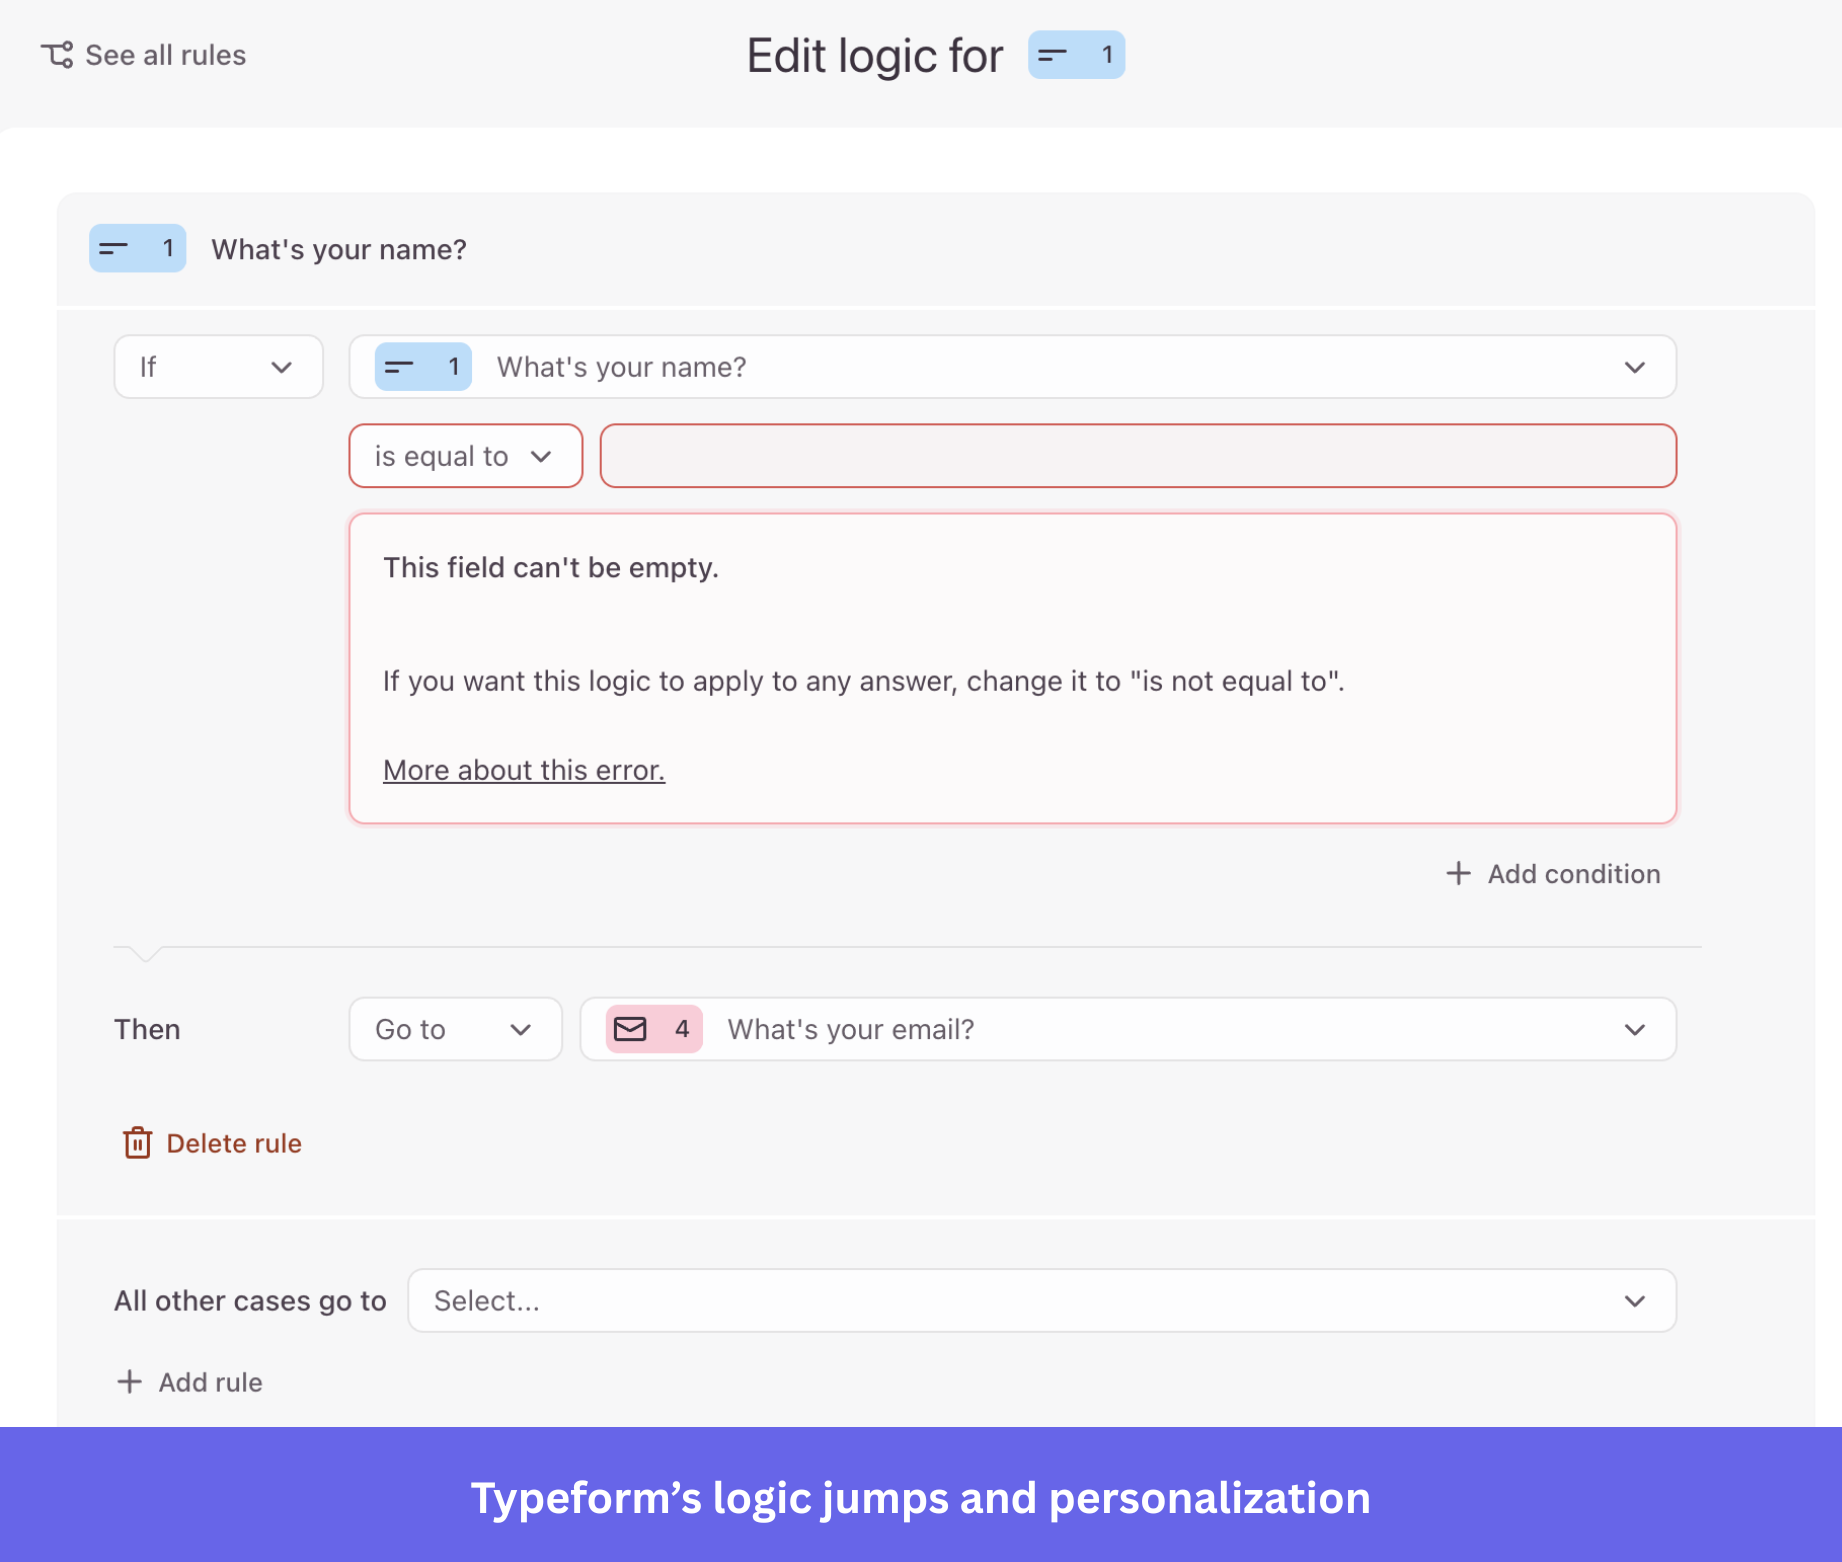
- Logic jumps and personalization: You can create dynamic surveys where questions change based on previous answers. This helps you collect more relevant feedback instead of asking every user the same questions.
- Custom design and branding: Typeform lets you fully customize colors, fonts, and layouts so surveys match your brand.
Typeform pricing
Typeform offers a free plan with limited responses. Paid plans start at around $28/month, with higher tiers increasing response limits, removing branding, and adding advanced logic and analytics features.
Pros and cons of Typeform
| Pros | Cons |
| ✅ The builder is intuitive and easy to use, so most users can create and launch forms quickly without training. | ❌ Reporting and analytics are limited, which makes it harder to extract deeper insights from responses. |
| ✅ The clean and interactive design makes forms look more polished and engaging than traditional survey tools. | ❌ Setting up advanced logic and complex workflows can take extra time and effort for non-technical users. |
#17: Qualtrics for enterprise customer feedback management
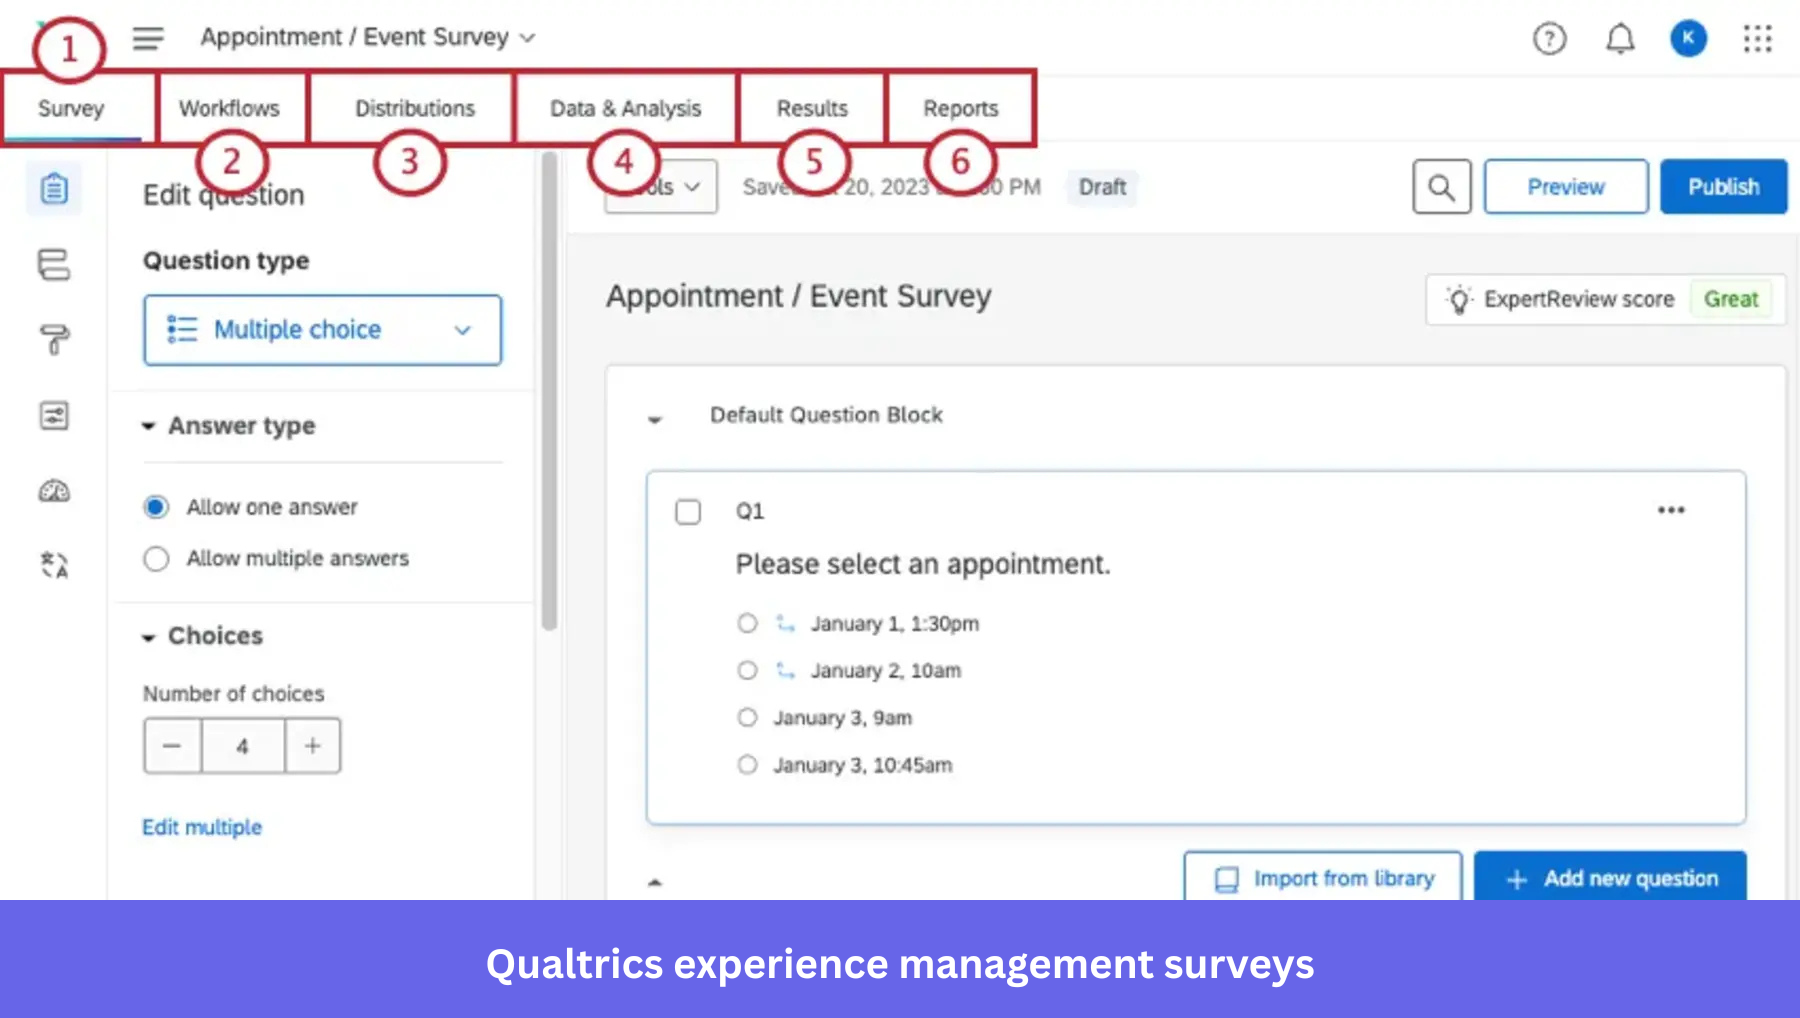
Qualtrics is an enterprise-grade experience management platform designed for companies that want to systematically collect and analyze customer feedback across the entire customer journey.
It’s especially strong if you’re running large-scale feedback programs. For example, you can collect feedback across multiple touchpoints (web, email, support interactions) and connect it to customer experience metrics.
Key features
- Experience management surveys: Qualtrics lets you run advanced surveys like NPS, CSAT, and product feedback surveys at different touchpoints.
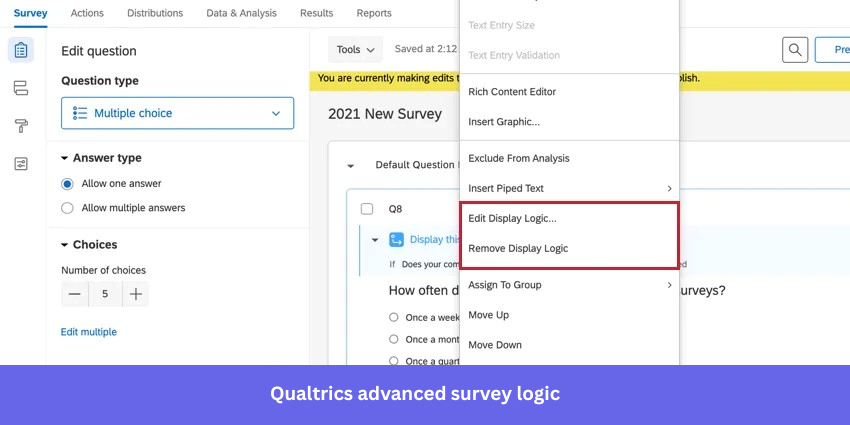
- Advanced survey logic: You can build highly dynamic surveys with branching logic, embedded data, and personalized questions. This is particularly useful for enterprises that need very specific feedback workflows.
- AI-driven feedback analysis: Qualtrics uses AI to analyze text responses and detect sentiment and common themes. Large teams can process feedback faster without manually reviewing thousands of responses.
Qualtrics pricing
Qualtrics uses custom pricing based on usage, features, and company size. While no official pricing is published, third-party estimates suggest plans can start from around $1,500/year for basic packages, with enterprise contracts often costing significantly more depending on scale.
Pros and cons of Qualtrics
| Pros | Cons |
| ✅ Flexible surveys with advanced logic and better targeting. | ❌ High pricing compared to lighter-weight survey tools. |
| ✅ Combines structured survey data with unstructured customer feedback at scale. | ❌ Feels overly complex for simple use cases, which makes it a poor fit for smaller teams or straightforward survey needs. |
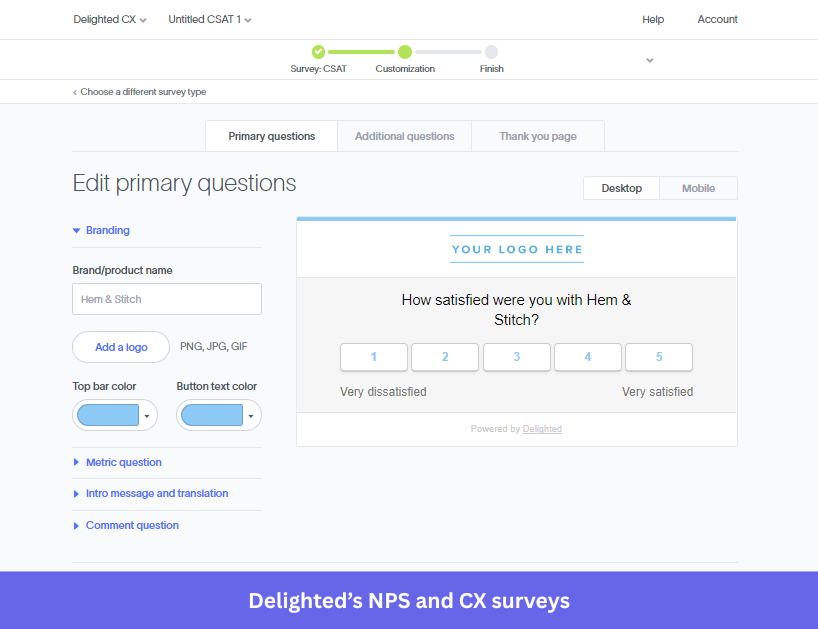
#18: Delighted for simple NPS and customer satisfaction tracking
Delighted (by Qualtrics) is a customer feedback tool focused on helping you measure customer sentiment through NPS, CSAT, CES, and quick pulse surveys.
It’s a good fit if you want a simple way to continuously track customer satisfaction. For example, you can automatically send NPS surveys after key interactions and monitor how sentiment changes over time.
Key features
- NPS and CX surveys: Delighted lets you send NPS, CSAT, and CES surveys across email, web, and in-product experiences. This helps you consistently measure customer loyalty without building surveys from scratch.
- Automated survey delivery: You can schedule surveys based on timing or customer interactions. This helps you collect feedback continuously instead of running one-off surveys.
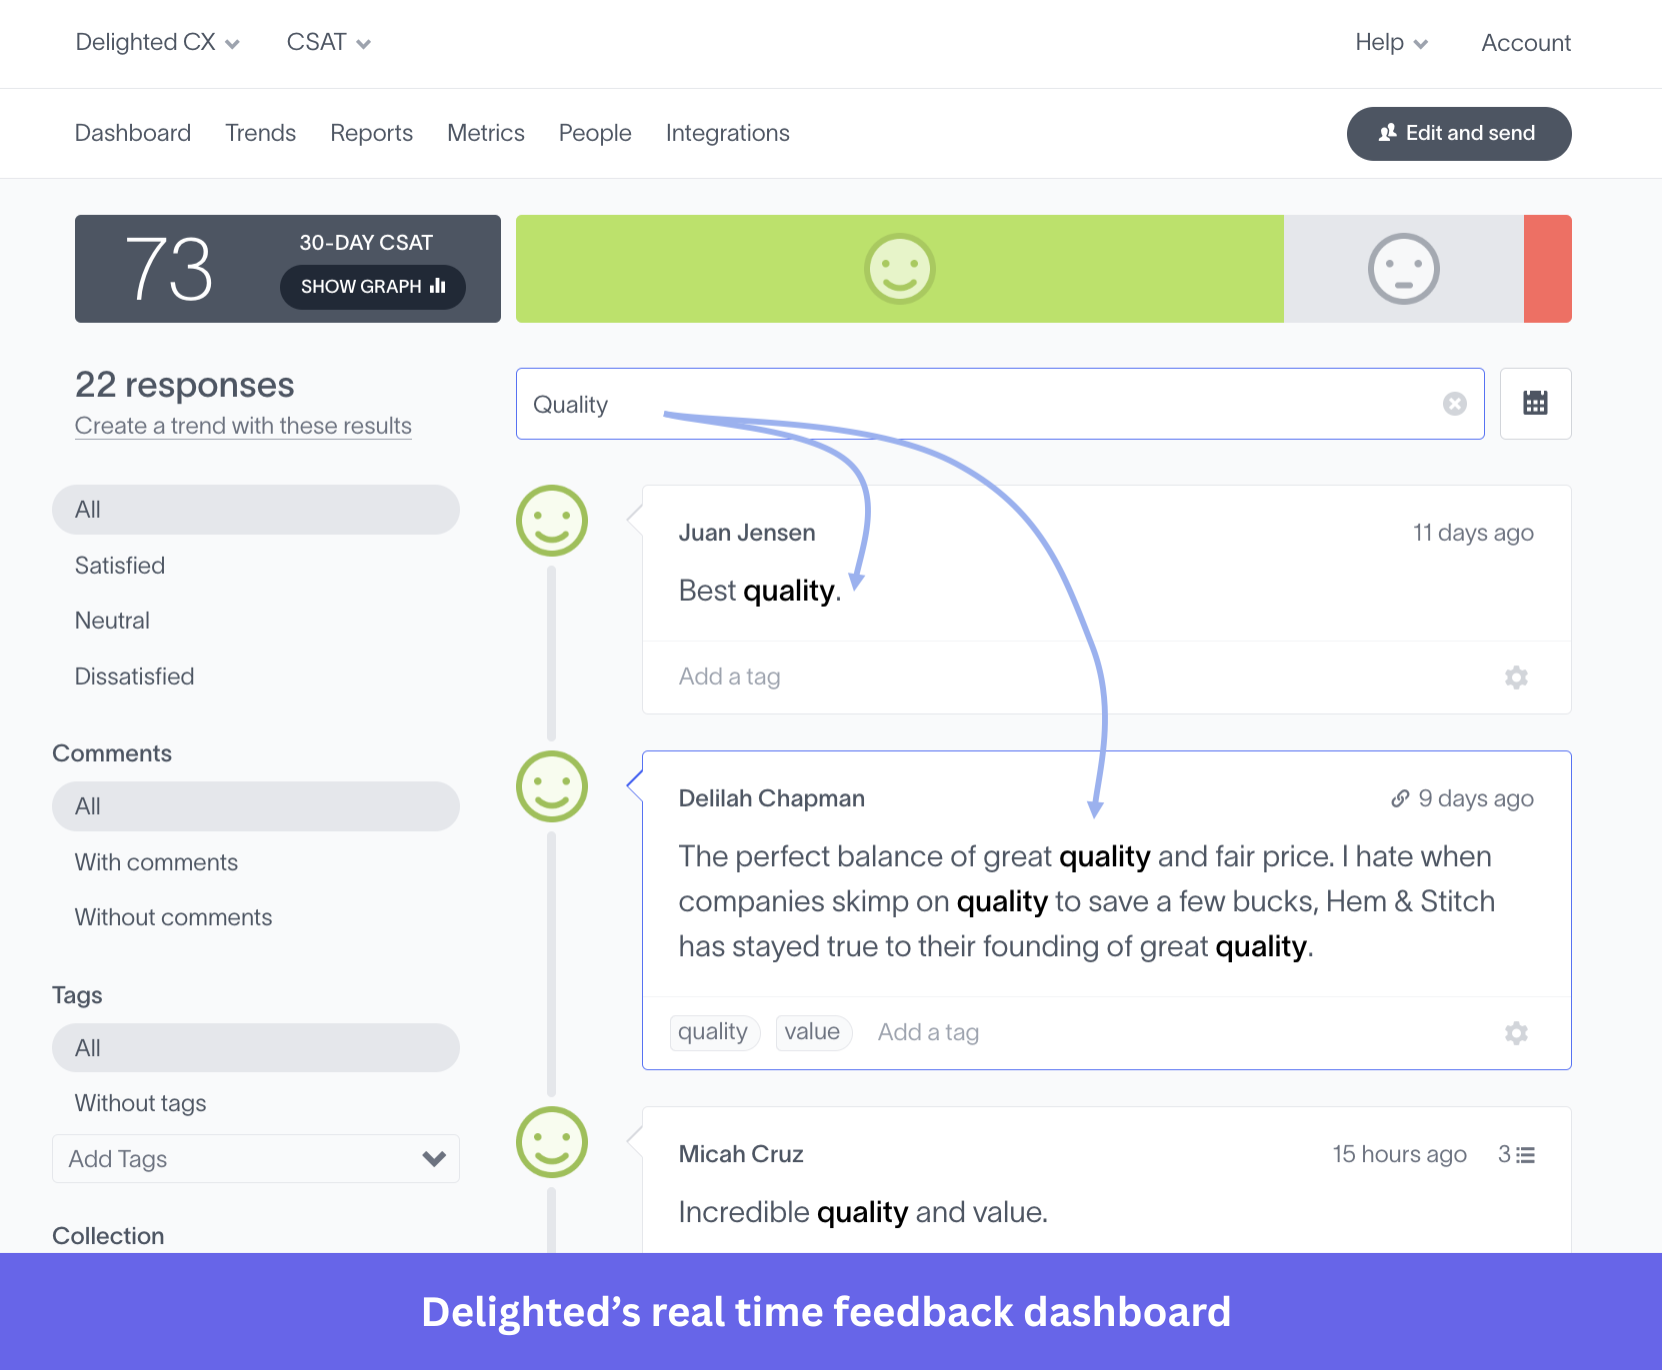
- Real-time feedback dashboards: Delighted organizes responses into simple dashboards so you can track trends and identify unhappy customers quickly.
Delighted pricing
Delighted offers a free plan (about 25 responses/month). Paid plans start at around $19/month, with higher tiers ($39, $149, $249/month) increasing response limits, users, and integrations. Enterprise pricing is custom.
Pros and cons of Delighted
| Pros | Cons |
| ✅ The platform is extremely easy to use and quick to learn, with reviewers calling it “very intuitive” and easy to navigate even without training. | ❌ Customization and setup for certain use cases (like web surveys) can require developer support instead of being fully self-serve. |
| ✅ Integrations with tools like Slack make it easy to route and act on responses within existing workflows. | ❌ Reporting lacks depth, with multiple reviewers saying they need more advanced analytics and year-over-year insights. |
Enhance in-app user engagement
When it comes to customer engagement software, truth be told, there are tons of options to choose from in the market. What you need is a solution that fits the needs of your business just right
And if your current business requirements happen to be:
- Engaging users in-app through videos, checklists, banners, and more.
- Gathering customer insights through session replays.
- Collecting feedback through surveys.
…then Userpilot’s just the solution you need.
Instead of making any bold promises on how this is the best customer engagement software in the whole wide world, I’d personally rather urge you to sign up for a free trial and check out its capabilities yourself!
FAQ
What is a user engagement tool?
It is software that helps you track how users interact with your product and provides channels (like in-app messages, emails, or surveys) to communicate with them based on their behavior.
What is the difference between a CRM and customer engagement software?
A CRM stores customer contact information and sales histories. Customer engagement software acts on that data by tracking live product usage and triggering automated messages to guide user behavior.
How do you measure customer engagement?
The user engagement platforms you choose should empower your product team to monitor these critical performance indicators:
- DAU/MAU Ratio (Product Stickiness): The percentage of your monthly active users who log in daily. This is the ultimate test of habitual engagement.
- Time to Value (TTV): How quickly a new signup reaches their first “Aha!” moment.
- Net Promoter Score (NPS) & Customer Effort Score (CES): Quantitative measures of user sentiment and the perceived difficulty of using your software.
- Feature Adoption Rate: The percentage of your active user base that actively utilizes a specific feature within a given timeframe.
Why do I need in-app messaging if I already send emails?
Emails reach users when they are checking their inbox, not when they are using your product. In-app messaging provides contextual guidance at the exact moment a user needs help, which significantly improves task completion rates.
About the author