Data Analysis For Product Managers: The Complete Guide


Ever launched a feature that flopped? Or wondered why users abandon your product? You’re not alone. But there’s a better way than relying on guesswork: Data analysis for better product management.
As a product manager, I’ll share with you:
- Why product managers should take data analysis seriously.
- Steps to analyze data and make informed decisions.
- Types of data analysis product managers should be interested in.
- The best data analytics tools to use.
What is data-driven product management?
Data-driven product management means your product decisions are primarily informed by analysis of real-world data rather than intuition, guesswork, or competitor actions.
It utilizes data to understand your users, optimize your product experiences, and ultimately achieve core business goals.
Why is data analysis important for product managers?
Data analysis helps product managers transform raw data into meaningful insights, guiding teams to make informed decisions throughout the product life cycle.
Here’s how it plays a key role in various aspects of product management:
- Provides direction for product development: Data analysis lets you identify market trends, customer needs, and value gaps in the current product offerings. By understanding what users truly want and need, you can prioritize features and direct resources more effectively.
- Helps create impactful product enhancements: Continuous monitoring and analysis of user engagement enables product teams to identify which features users value the most and which areas need improvement. The data-driven insights from this exercise ensure that updates solve real problems and contribute significantly to the product’s value proposition.
- Improves the user experience and increases customer loyalty: As mentioned earlier, data analytics reveals improvements you can make to enhance the overall user experience. A better user experience not only attracts new customers but also fosters loyalty among existing users, as they feel their needs and feedback are being valued and addressed.
How to analyze data to make informed decisions
As a product manager, data analytics is all about turning raw data into actionable insights that drive real product improvements.
Therefore, here’s the structured process I use to make data analysis for product managers more effective:
1. Define the objective of your analysis
Start by clearly defining what you want to achieve with your analysis.
This could be understanding user behavior, improving engagement, measuring the success of a new feature, identifying pain points in the user journey, or gauging overall product performance.
You can also use goal-setting frameworks to define the goal of your data analysis.
2. Specify the relevant metrics
Choose product analytics metrics and key performance indicators (KPIs) based on your objectives. These metrics will guide your analysis and help you build strategies based on real numbers.
For example, a product manager trying to improve app engagement would track metrics such as the average session duration, feature usage, and customer lifetime value.
3. Collect user behavior data from multiple sources
One data source is usually not enough to gain a comprehensive understanding of user behavior and needs. Combining both qualitative and quantitative data from various sources allows you to see the full picture and be equipped to make better, data-driven decisions.
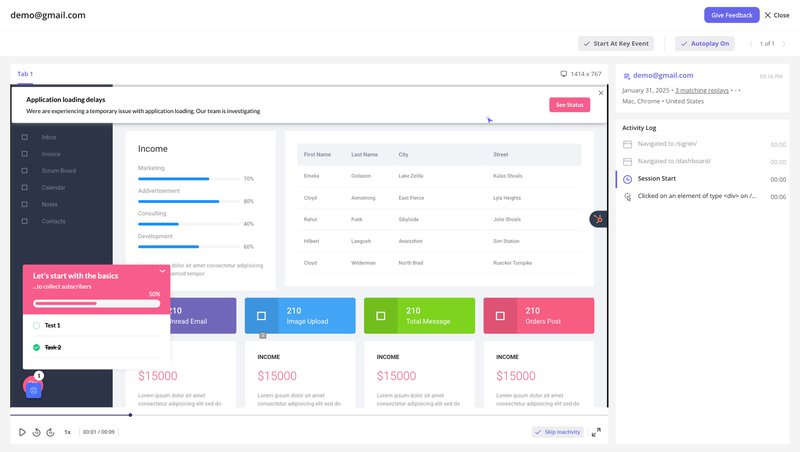
Utilize tools like funnel analysis and trend analysis to gather rich quantitative data. Then, employ qualitative data sources such as customer feedback and session replays to understand the why behind user behavior.
4. Analyze user data to gain data-driven insights
Now that you have comprehensive user data, it’s time to analyze it and draw meaningful conclusions.
Use data analytics tools to make the process easier. These tools help spot patterns and trends in user behavior so you’re able to draw useful insights.
💡 A great example of this is CYBERBIZ, a Taiwanese e-commerce platform. They used Userpilot to collect and analyze user data, which directly informed their admin panel redesign.
By relying on data from in-app surveys, messaging, and analytics, they were able to make informed decisions that led to significant improvements in feature adoption and a reduction in support tickets.
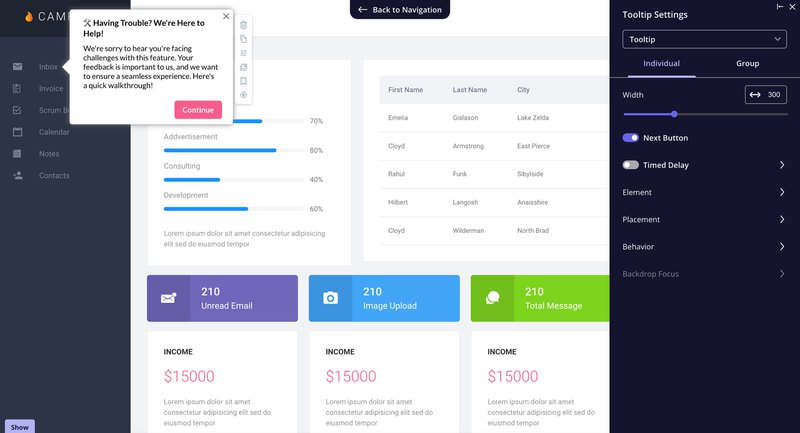
Once you’ve found the connecting dots, it’s time to implement changes and improve the user experience. For example, if the data shows that users have difficulty using a feature, you can introduce tooltips to provide contextual guidance and help users make the most of your tool.
Types of data analysis and how product managers can use them
If you ask data analysts, they can go on and on with numerous data points to track, but no, you don’t need to measure everything. These six data analysis types are enough to help you make solid product management decisions that drive revenue growth.
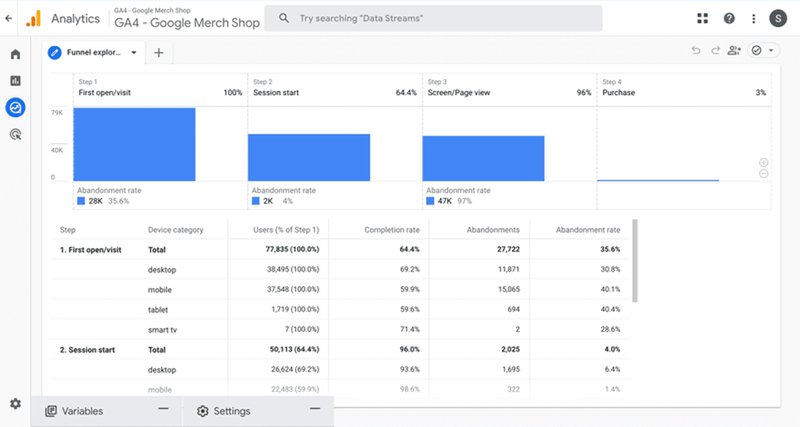
Funnel analysis to understand user journeys
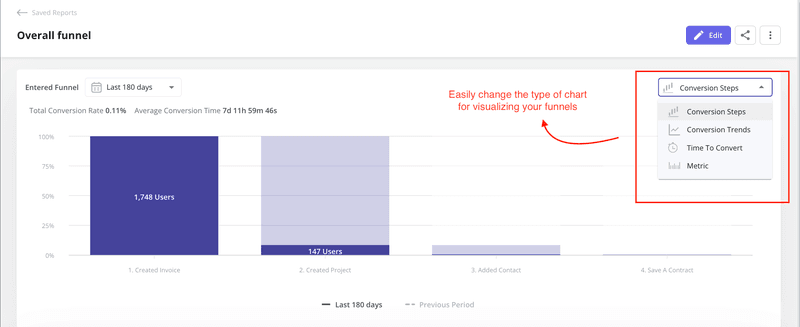
Funnel analysis visualizes the user journey through a sequence of steps leading to a desired action, like completing sign-up, account renewal, or reaching a specific usage milestone.
It’s called a ‘funnel’ because the user base narrows at each stage, highlighting drop-off points where users are abandoning the process. By analyzing how many customers progress through each funnel step, product managers can identify friction and areas for improvement.
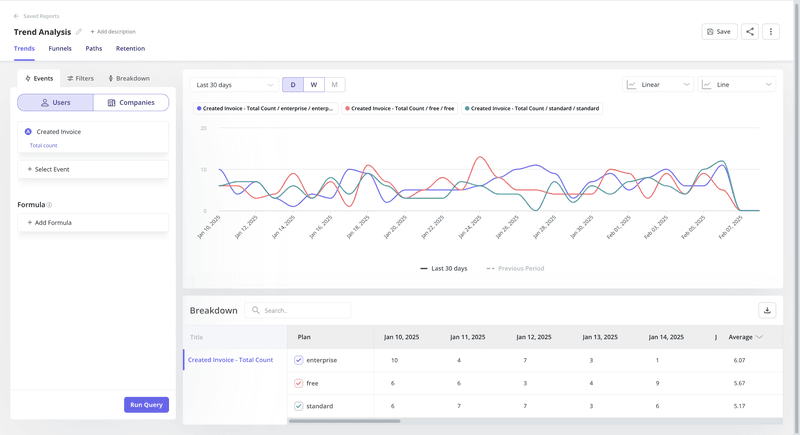
Trend analysis to track trends across the customer journey
Trend analysis involves examining data over time to identify consistent patterns or trends. For product managers, this is particularly useful for tracking engagement and understanding how customer behaviors and preferences evolve. It’s also helpful to track the differences between various segments of your user base.
For example, trend analysis performed over a specific period can help you understand what features and in-app flows drive better adoption. Armed with this information, you can trigger flows relevant to your user segments and boost product usage.
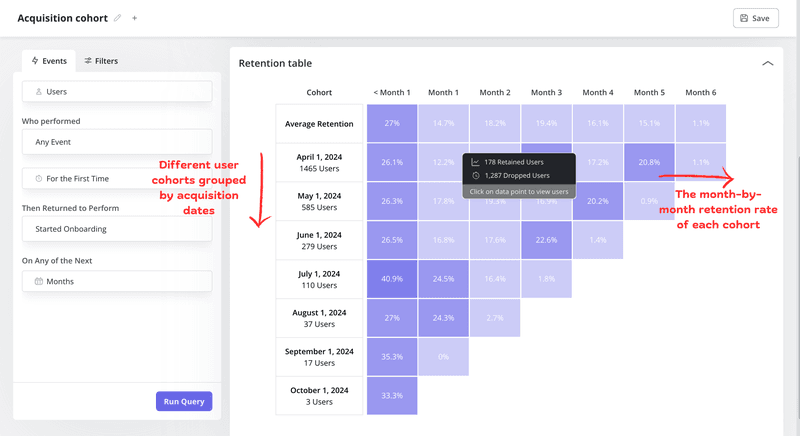
Cohort analysis to track retention
Cohort analysis groups users based on shared characteristics, like sign-up date or feature usage, and tracks their behavior over time.
By using cohort analysis, product managers can identify which user segments are the most loyal and what factors contribute to their continued engagement. This information is crucial for developing targeted strategies to improve user retention.
Customer feedback analysis to monitor user sentiment
Customer feedback analysis delves into the emotions and opinions users express about your product. It goes beyond traditional metrics like user engagement and focuses on understanding the “why” behind user behavior.
By leveraging tools to analyze responses to NPS, CSAT, and other forms of in-app surveys, product managers can identify user preferences and prioritize development efforts.
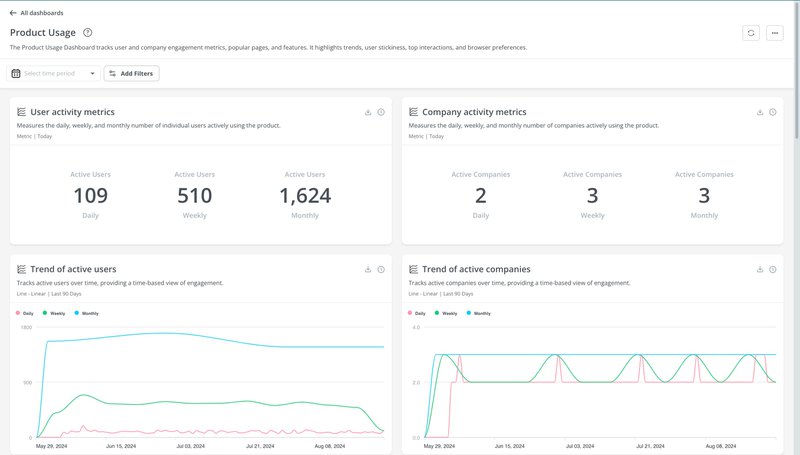
Analytics dashboard for a comprehensive view of all key stats
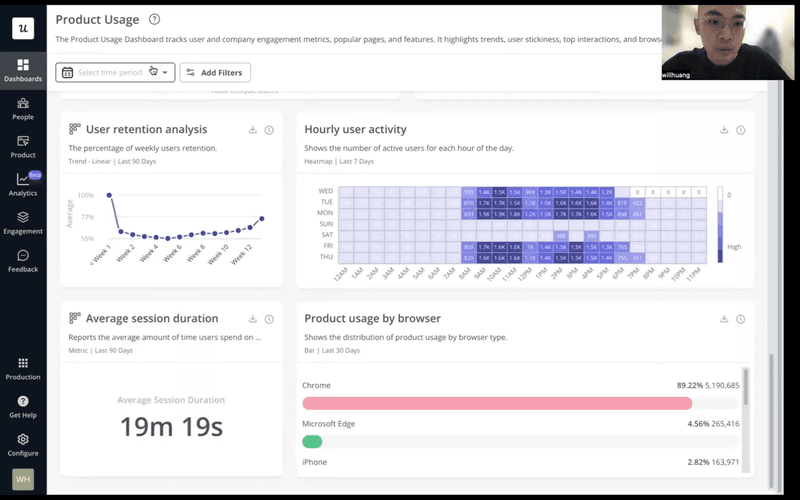
Analytics dashboards aggregate multiple data sources into a single visual interface, providing a comprehensive view of key metrics and stats such as user engagement, conversion rates, revenue, customer satisfaction scores, and more.
Many analytics tools let you customize your dashboard with the metrics you care about and visualize them with different types of charts. A detailed data analytics dashboard gives you access to real-time data, so you’re able to draw fresh insights every time. Also, you can easily spot patterns, trends, and anomalies without having to juggle between different report pages.
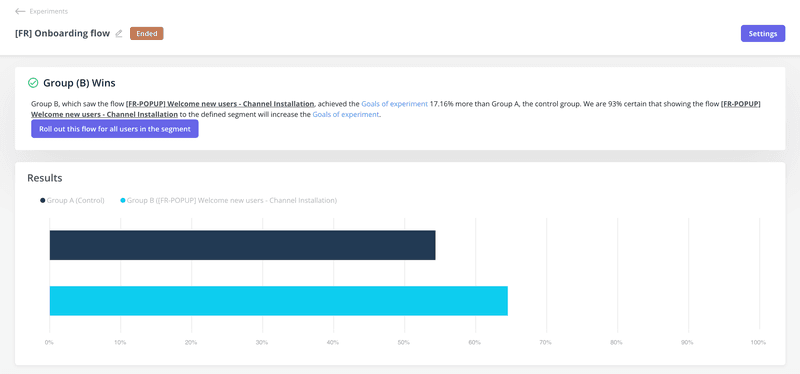
A/B testing to enhance the onboarding experience
A/B testing involves creating two or more versions of a user interface element or feature and sending them to different segments of your user base to see what resonates more.
Implement this data analysis to refine your user onboarding strategy. Test variations of your onboarding flows, UI elements, and calls to action. Then, analyze the result to see which variation was better at helping users realize value and adopt your tool.
Best product analytics tools to enable product teams to gather valuable insights
This section shows you the best tools for web and product analytics. I’ll go over their key features and what they can help you achieve.
Userpilot – Best product analytics tool
Here’s the thing: I’m a product manager. I’ve been in the trenches, wrestling with messy data, trying to piece together user behavior from a dozen different tools. It’s a nightmare, right? That’s actually why I’m so passionate about Userpilot. We designed it as the all-in-one platform I wish I had back then.
So, when I say Userpilot has everything you need for data analysis, I mean it. Here are the features that help me with my daily tasks:
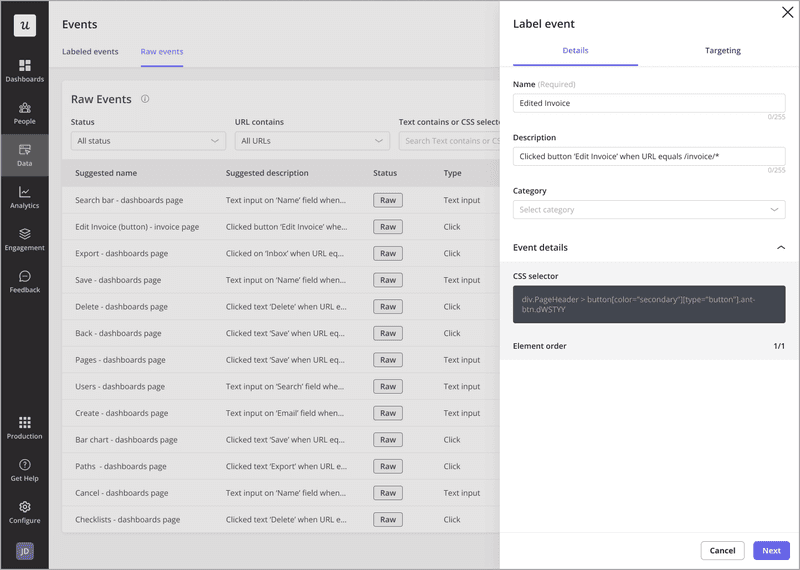
- Autocapture: I can select elements directly and user data streams instantly. This eliminates the typical engineering dependencies, allowing me to start analyzing user behavior without delays.
- Analytics reports (funnels, paths, cohorts, trends): These reports are my go-to. Funnels pinpoint drop-offs, paths visualize user journeys, and cohorts reveal segment behavior. It’s clear, actionable data, not raw spreadsheets.
- Analytics dashboards (custom & templates): Custom dashboards for key metrics and templates for quick overviews. It’s a central hub for product and customer insights, keeping me informed at a glance.
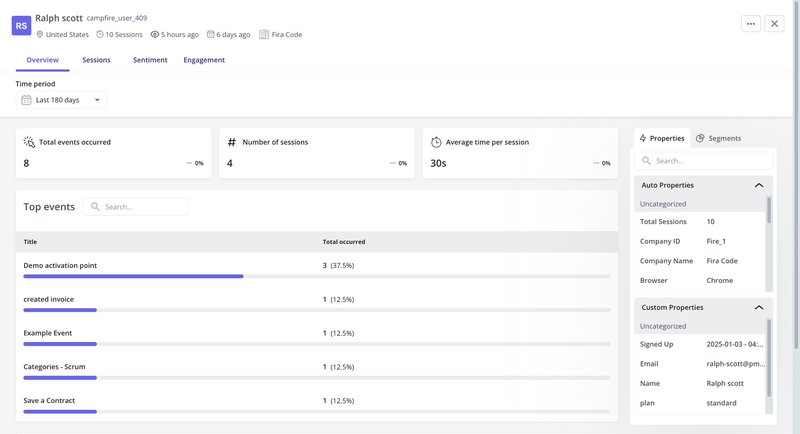
- User/Company profile: I can see a detailed history of their activity, review their feedback, and gain a comprehensive understanding of their experience. This provides a level of granular insight that is typically difficult to achieve at scale.
- Surveys: I use surveys to target specific user segments with relevant questions. This enables me to understand the underlying motivations behind user actions, going beyond basic usage metrics.
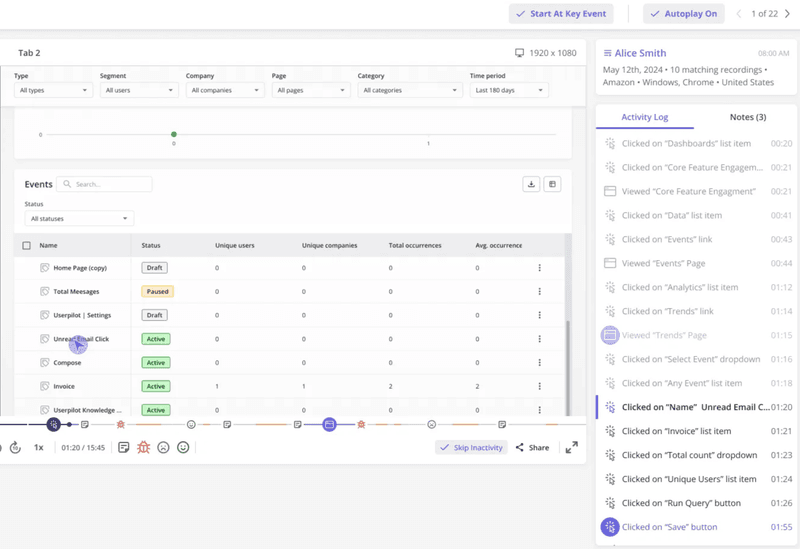
- Session replay: Session replay is where I uncover unexpected user behavior. By watching actual user sessions, I can identify friction points and hidden UX issues that might otherwise go unnoticed. This provides invaluable context for improving the user experience.
Google Analytics – Best web analytics tool
To get a complete picture of our users, I need more than just in-depth product analytics. I also need to understand the broader market landscape. Google Analytics is essential for this. The platform offers a free and paid option, enabling teams at all levels to analyze data and drive growth.
Key features:
- Path analysis: See how visitors navigate your website and identify popular pathways.
- Cohort analysis: Compare the behavior of different visitor groups based on acquisition channels or other criteria.
- Funnel analysis: Track visitor progress through key conversion stages and spot improvement opportunities.
- Event analysis: Monitor specific user actions on your website, like button clicks or page scrolls, to understand engagement and spot ways to convert visitors to paying customers.
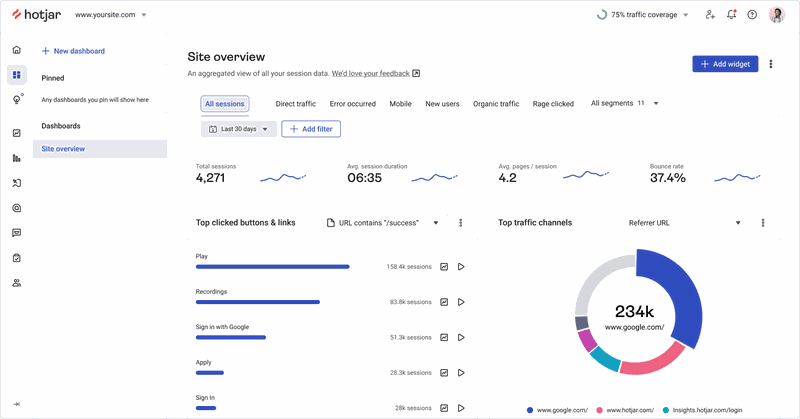
Hotjar – Best tool for qualitative data analytics
If you’re looking for a tool specifically for qualitative data like user feedback or heatmaps, Hotjar is the perfect choice.
Key features:
- Heatmaps: See where users click, scroll, and move their mouse, revealing areas of focus and potential confusion.
- Session recordings: Watch real user sessions to understand how customers interact with your product and identify pain points.
- User feedback: Gather user thoughts about your product or service and find ways to enhance product experiences.
Looking for a data analysis tool?
In order to thrive as a product manager, you need to know how to collect data and analyze it to generate useful insights. It’s fine if data isn’t your strong point; some PMs are more inclined to the creative side of things, and if that’s you, then embracing no-code tools will be a game-changer.
FAQ
Do product managers do data analysis?
Absolutely! Data analysis is a core responsibility for product managers. They use data to understand user behavior, measure product performance, and make informed decisions about product strategy and development.
What are the 5 steps of data analysis?
- Define your questions: Start with clear objectives and questions you want to answer.
- Collect the data: Gather relevant data from various sources.
- Clean the data: Prepare the data for analysis by removing errors and inconsistencies.
- Analyze the data: Use various techniques to identify patterns, trends, and insights.
- Interpret and share results: Draw conclusions, communicate findings, and take action.
What is predictive analytics for product managers?
Predictive analytics uses historical data and statistical techniques to forecast future outcomes. Product managers can use it to predict user churn, anticipate feature adoption, and make proactive decisions about product development.
About the author


![What are Release Notes? Definition, Best Practices & Examples [+ Release Note Template] cover](https://blog-static.userpilot.com/blog/wp-content/uploads/2026/02/what-are-release-notes-definition-best-practices-examples-release-note-template_1b727da8d60969c39acdb09f617eb616_2000-1024x670.png)