
Product analytics can be confusing with how many metrics there are to track. However, the DAU/MAU ratio is certainly one metric that you should keep an eye on to monitor how many users are active users.
In this guide, we’ll go over what the DAU/MAU ratio is, why you should track it, and how to calculate it!
What’s your biggest challenge with the DAU/MAU ratio right now?
How are you currently tracking user engagement and product stickiness?
Discover how to boost your DAU/MAU ratio.
Personalized onboarding and in-app guidance are key to improving product stickiness. See how Userpilot can help you analyze and improve your core metrics.
Try Userpilot Now
See Why 1,000+ Teams Choose Userpilot

DAU/MAU ratio – quick summary
- The DAU/MAU ratio is a metric that calculates the ratio of daily active users to monthly active users to determine how sticky your product is.
- The DAU to MAU ratio is key for tracking daily user engagement, evaluating growth and retention strategies, and analyzing user cohorts to identify which segments have higher engagement levels.
- Calculating the DAU/MAU ratio is simple as you need to divide the number of unique daily users by the number of monthly active users and then multiply by 100 to get a percentage value.
- The industry average DAU/MAU ratio for SaaS companies is 13%.
- There are a number of methods that can help you improve your DAU/MAU ratio as follows:
- You can personalize the user experience from the start as it helps improve the stickiness in the long run.
- Analyzing the usage patterns of your most engaged users is also an effective way to gain insights into how to improve product adoption for other less active users.
- You can also reduce friction through funnel analysis.
- And finally, segmenting inactive users to target them with re-engagement flows can improve this metric.
- Product usage, user engagement, product adoption rate, user retention rate, cohort retention rate, churn rate, and WAU/MAU are other important metrics that you should track in addition to the DAU/MAU ratio.
- With Userpilot, you can collect actionable product insights and create personalized product experiences that will significantly boost your DAU/MAU ratio. Book a demo to see how!
What is the DAU/MAU ratio?
The DAU/MAU ratio calculates the ratio of daily active users (DAU) to monthly active users (MAU) to measure how sticky your product is (i.e., how often people engage with it).
Why should you track DAU/MAU?
There are many engagement metrics that one can track, but the DAU to MAU ratio should take priority. Here’s why:
- It provides a clear picture of how many monthly users engage with your product on a daily basis.
- By monitoring changes in DAU and MAU, you can gauge the effectiveness of your growth and retention strategies.
- Analyzing the DAU and MAU of different user cohorts (e.g., by user acquisition source or feature usage) can provide insights into which segments are more engaged.
How to calculate the DAU/MAU ratio?
Now that you know what the DAU/MAU ratio is and why you should track it, let’s get into the actual process of calculating this metric.
1. Define what counts as an active user
Before you can start comparing the number of daily active users to monthly active users, you first need to define what actually counts as “active users” within the context of your product. Creating a standard definition for active users will help SaaS companies calculate metrics like DAU/MAU ratio as well as DAU/WAU (weekly active users).
You could define active users based on their last login date, which features they engage with, or how often they use the product. It’s also worth noting that some products simply aren’t built to be used daily, so you must factor in this when establishing the definition for active users.
2. Track the number of daily active users
Monitor the total number of unique users who perform the actions that you used to define “active users”, so you get an accurate measure of daily active users. It’s key that you track the number of unique users rather than the raw event occurrence to avoid duplicate data skewing results.
3. Track the number of monthly active users
Next, measure the number of monthly users who perform the same set of actions. Like with the daily users’ example, make sure that these are unique users since monthly users may use a feature multiple times during high-frequency days and then not touch the product again for another week.
4. Calculate the DAU/MAU ratio
The DAU/MAU ratio is also known as the stickiness metric or stickiness ratio. Calculating this metric is simple as all you need to do is divide the total number of daily active users (DAUs) by the number of monthly active users (MAUs), then multiply that number by 100.
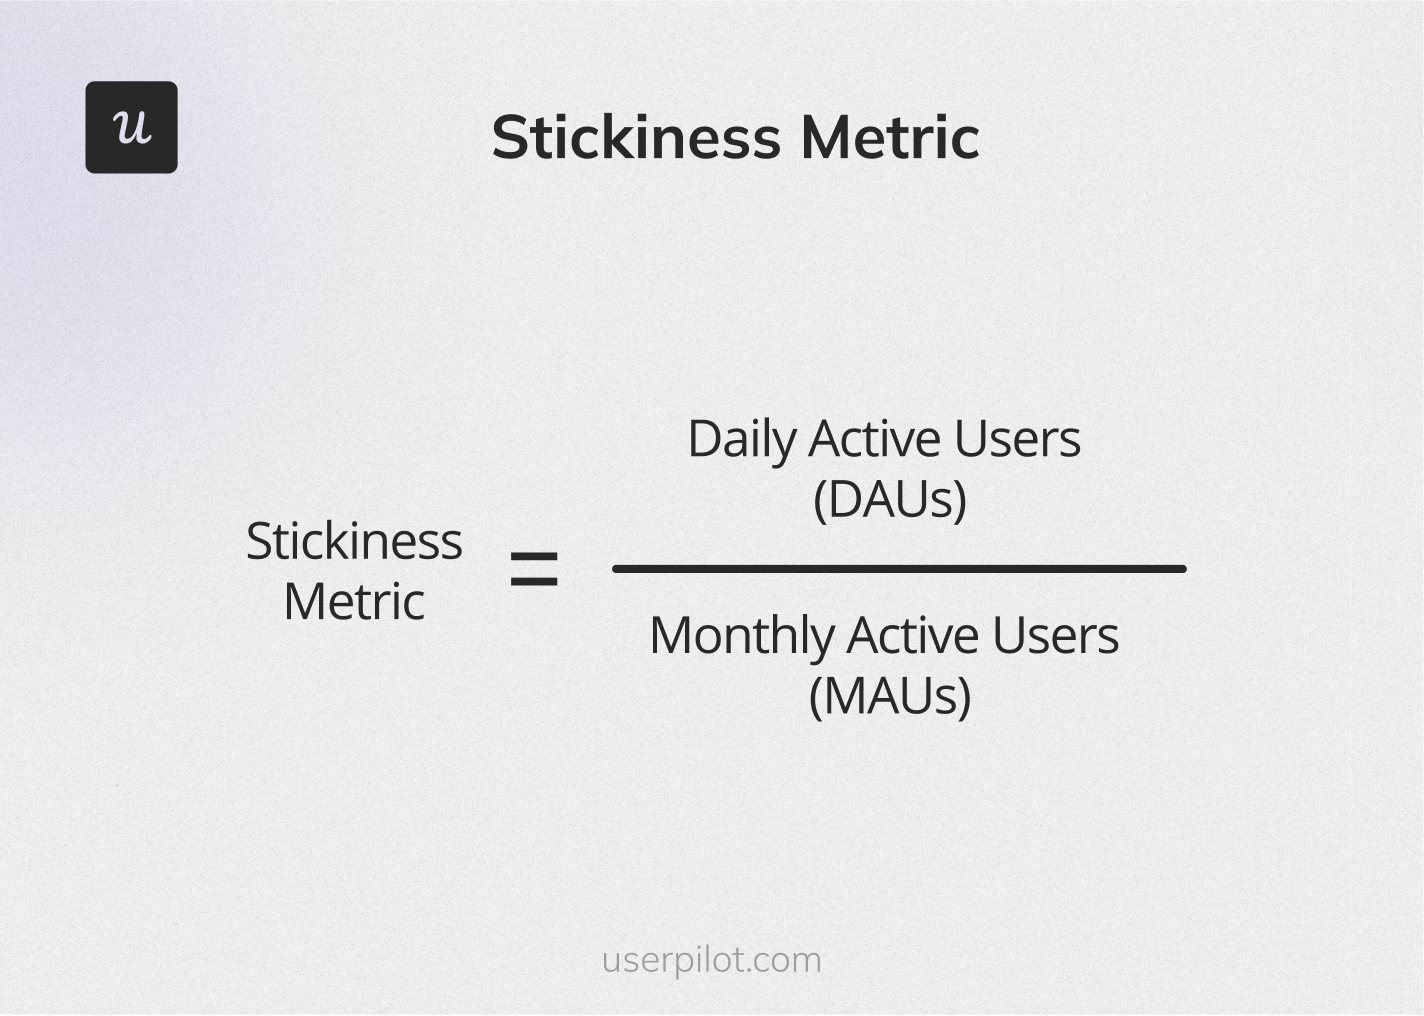
For example, if you have 1,000 daily users but 5,000 monthly active users, then here’s what the calculation would look like:
(1,000 DAUs / 5,000 MAUs) x 100 = 20% DAU/MAU ratio.
Such a result would indicate that 20% of your monthly active users use the product on a daily basis.
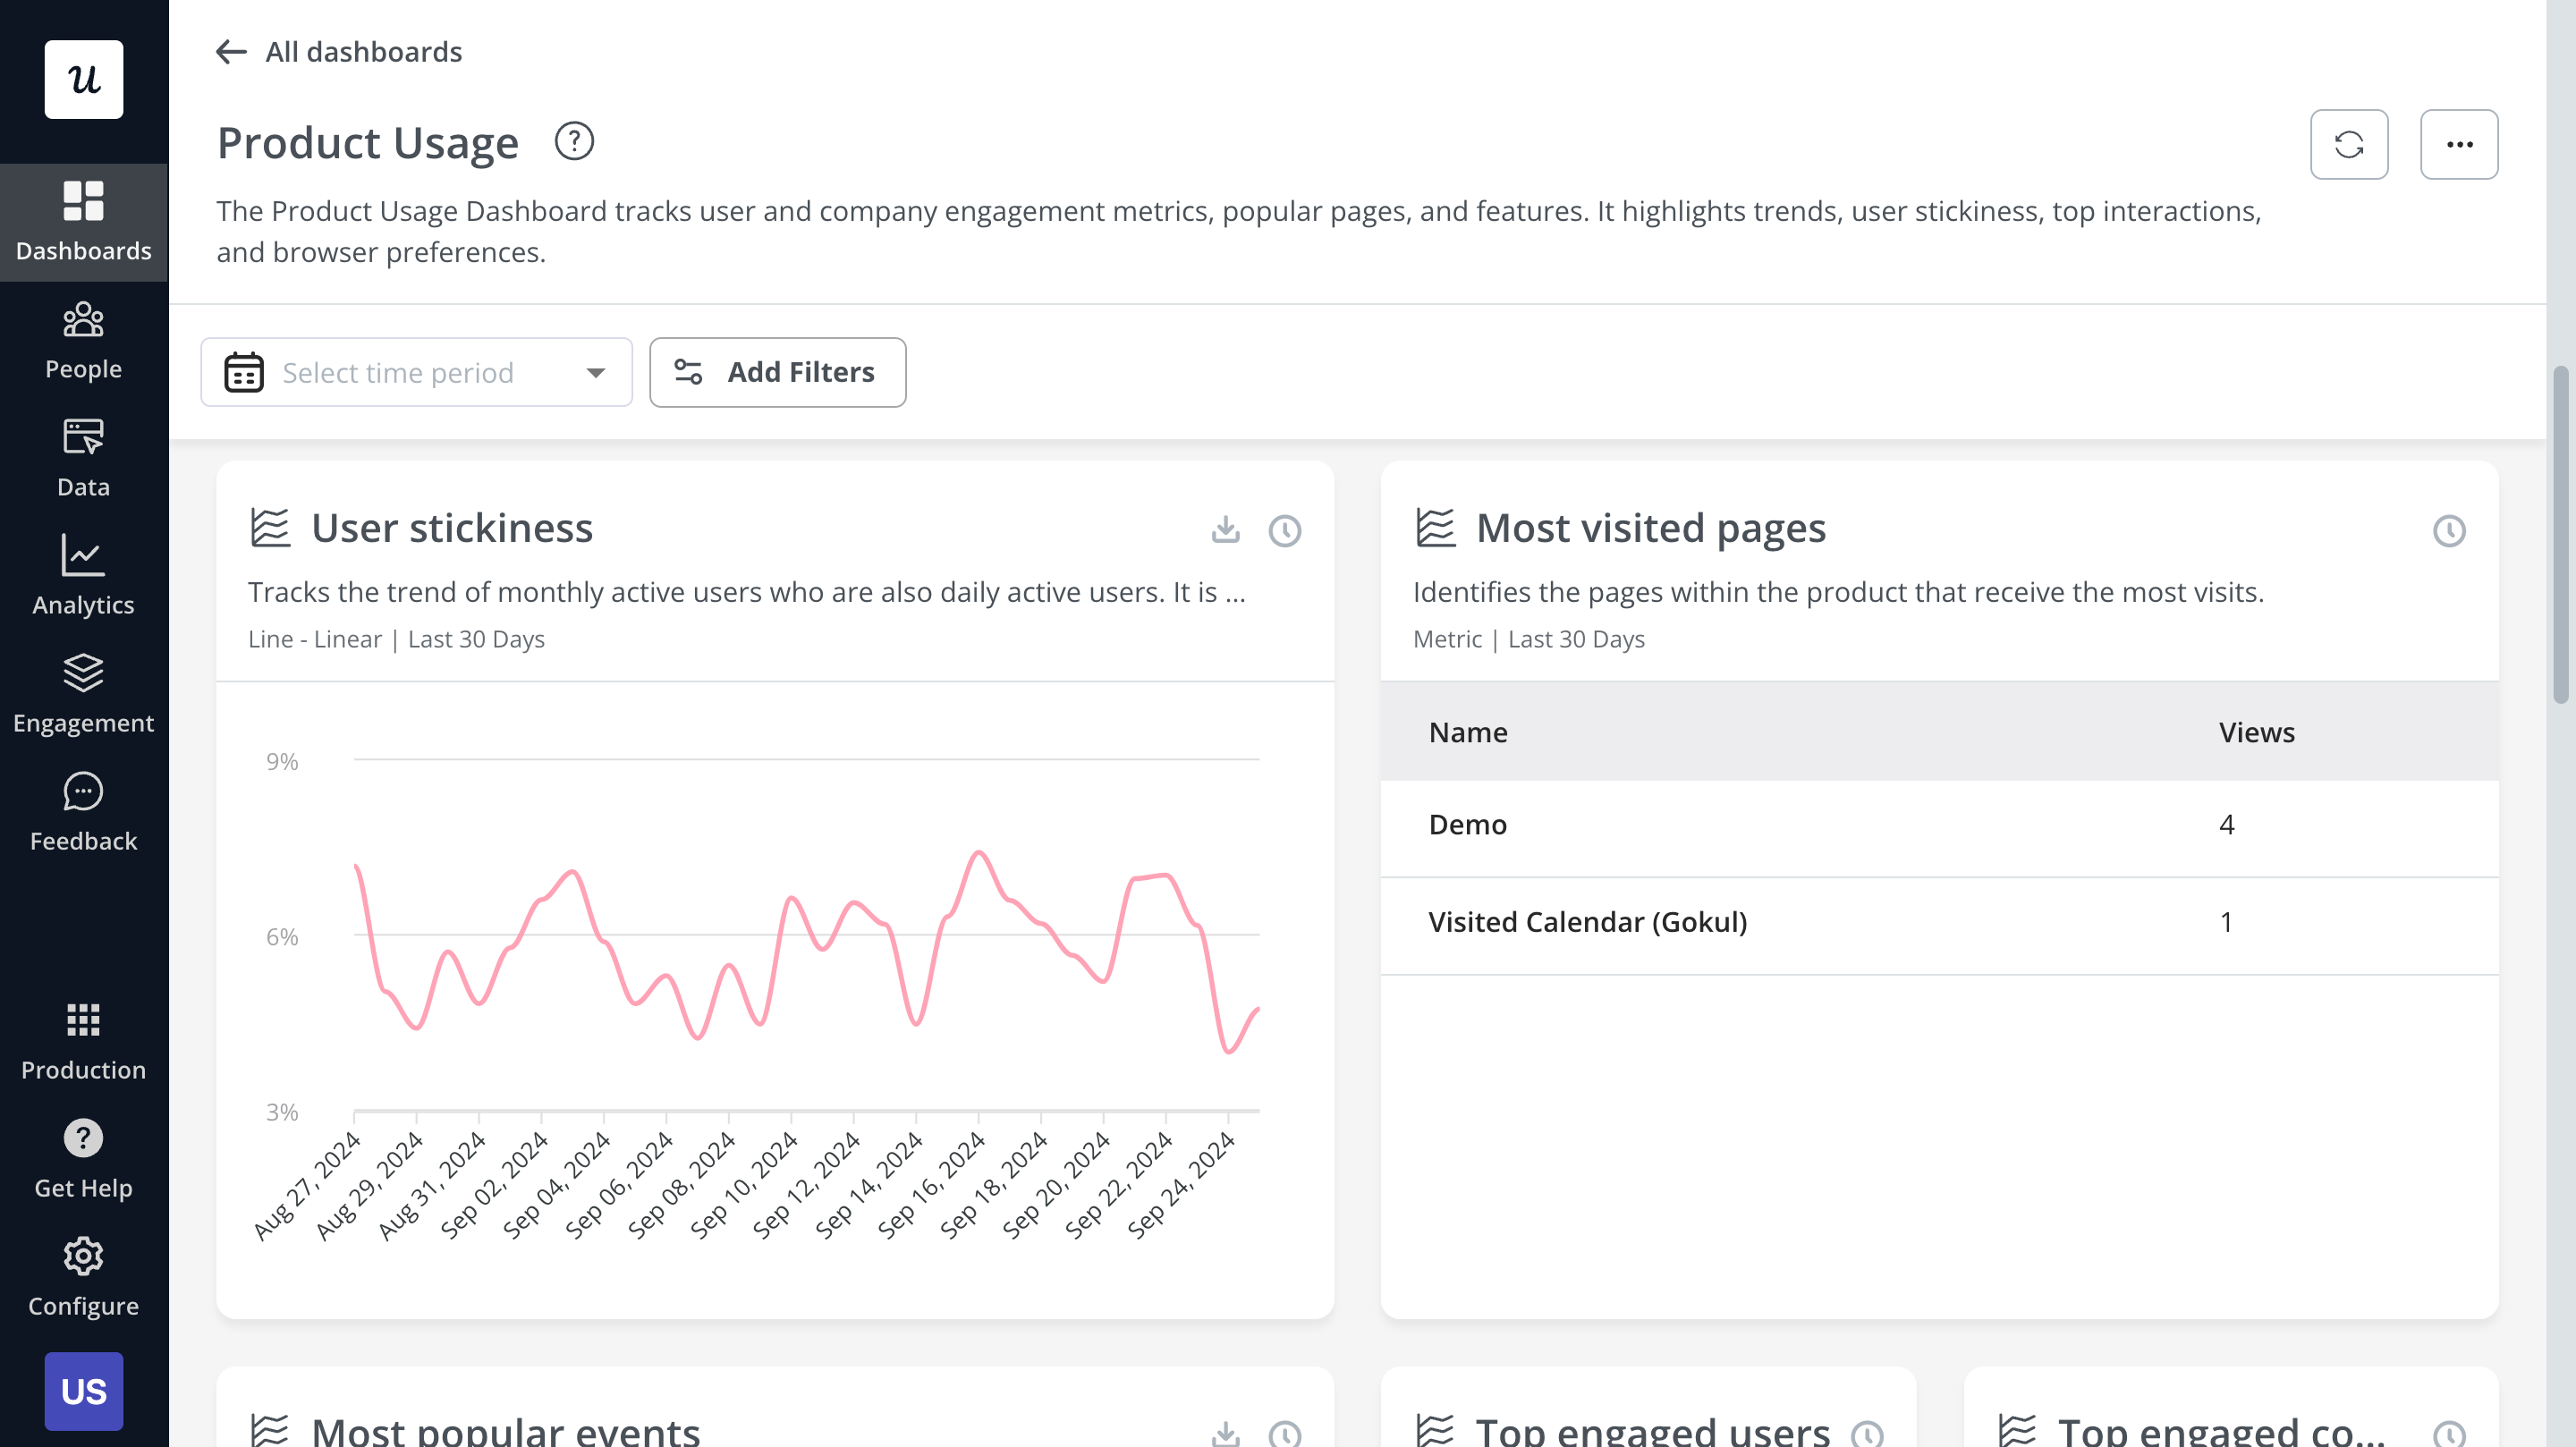
If you have a product analytics tool like Userpilot, you don’t need to calculate this metric manually. Userpilot’s analytics dashboard tracks the DAU/MAU ratio in a real-time.
What is a good DAU/MAU ratio?
The industry average of the DAU/MAU ratio for SaaS companies is 13%. Certain apps are able to surpass 50% (like Facebook), but this is usually reserved for social media apps or messaging platforms that warrant daily use.
How to improve your DAU/MAU ratio?
Improving your DAU/MAU ratio is the most empirical way to increase product stickiness.
A few ways you could improve your DAU/MAU ratio include:
- Delivering personalized user experiences
- Analyzing the usage patterns of power users
- Conducting funnel analysis to reduce friction
- Leveraging segmentation for user re-engagement
Let’s take a closer look at each of these strategies in the sections below!
Deliver personalized experience for new users from the start
Personalizing the user experience from the earliest stages of the customer journey is a high-value endeavor that can make apps much stickier in the long run. Tailoring the onboarding process to each user’s needs and only showing the most relevant features will help you maximize user retention.
The easiest way to begin the personalization process this early is through a welcome survey. Having one of these surveys in your signup flow will make it possible to collect preliminary customer data that serves as a starting point for user segmentation.

Find engagement drivers by analyzing trends among power users
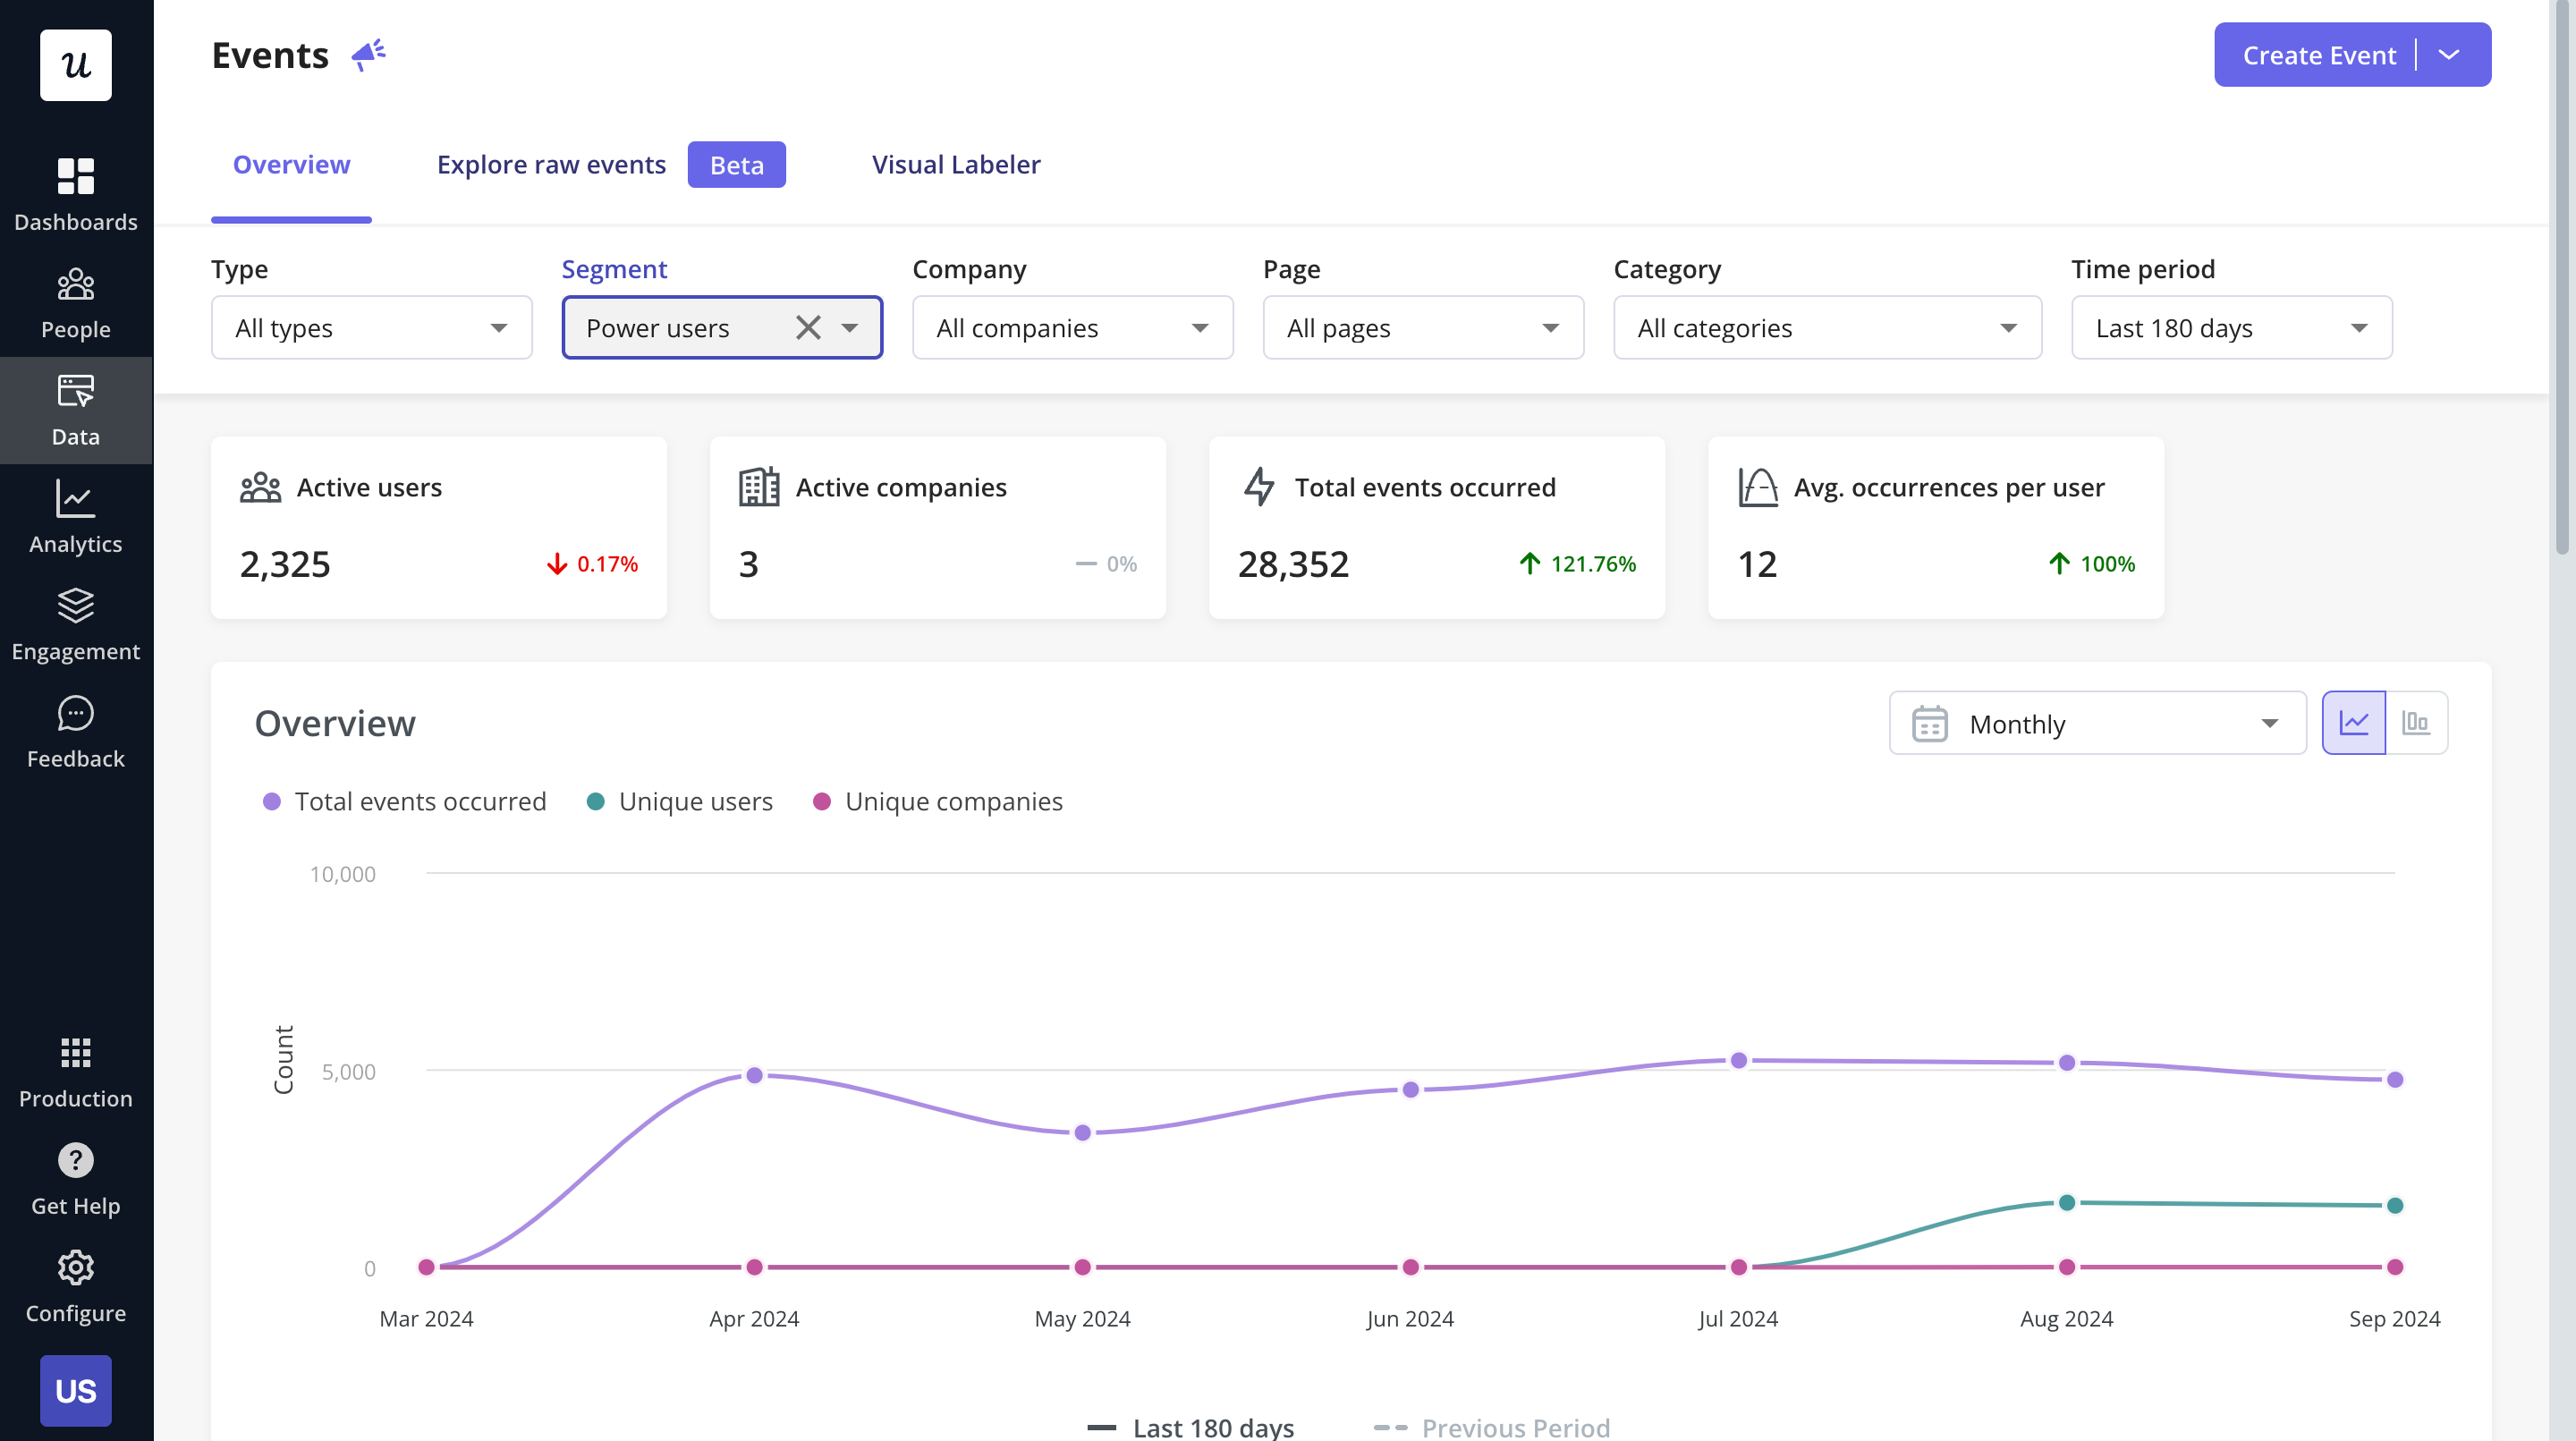
A deep dive into the usage habits of your most engaged users will uncover a wealth of insights. By identifying the most popular features or activities that power users engage with, you’ll be able to repurpose them as engagement triggers for less active users.
Tracking user activity is quite easy with Userpilot’s behavioral analytics, and event data dashboards. Once you have these metrics, you can use tooltips, interactive walkthroughs, or other in-app flows to promote the usage of high-value features.
Use funnels to identify and remove friction
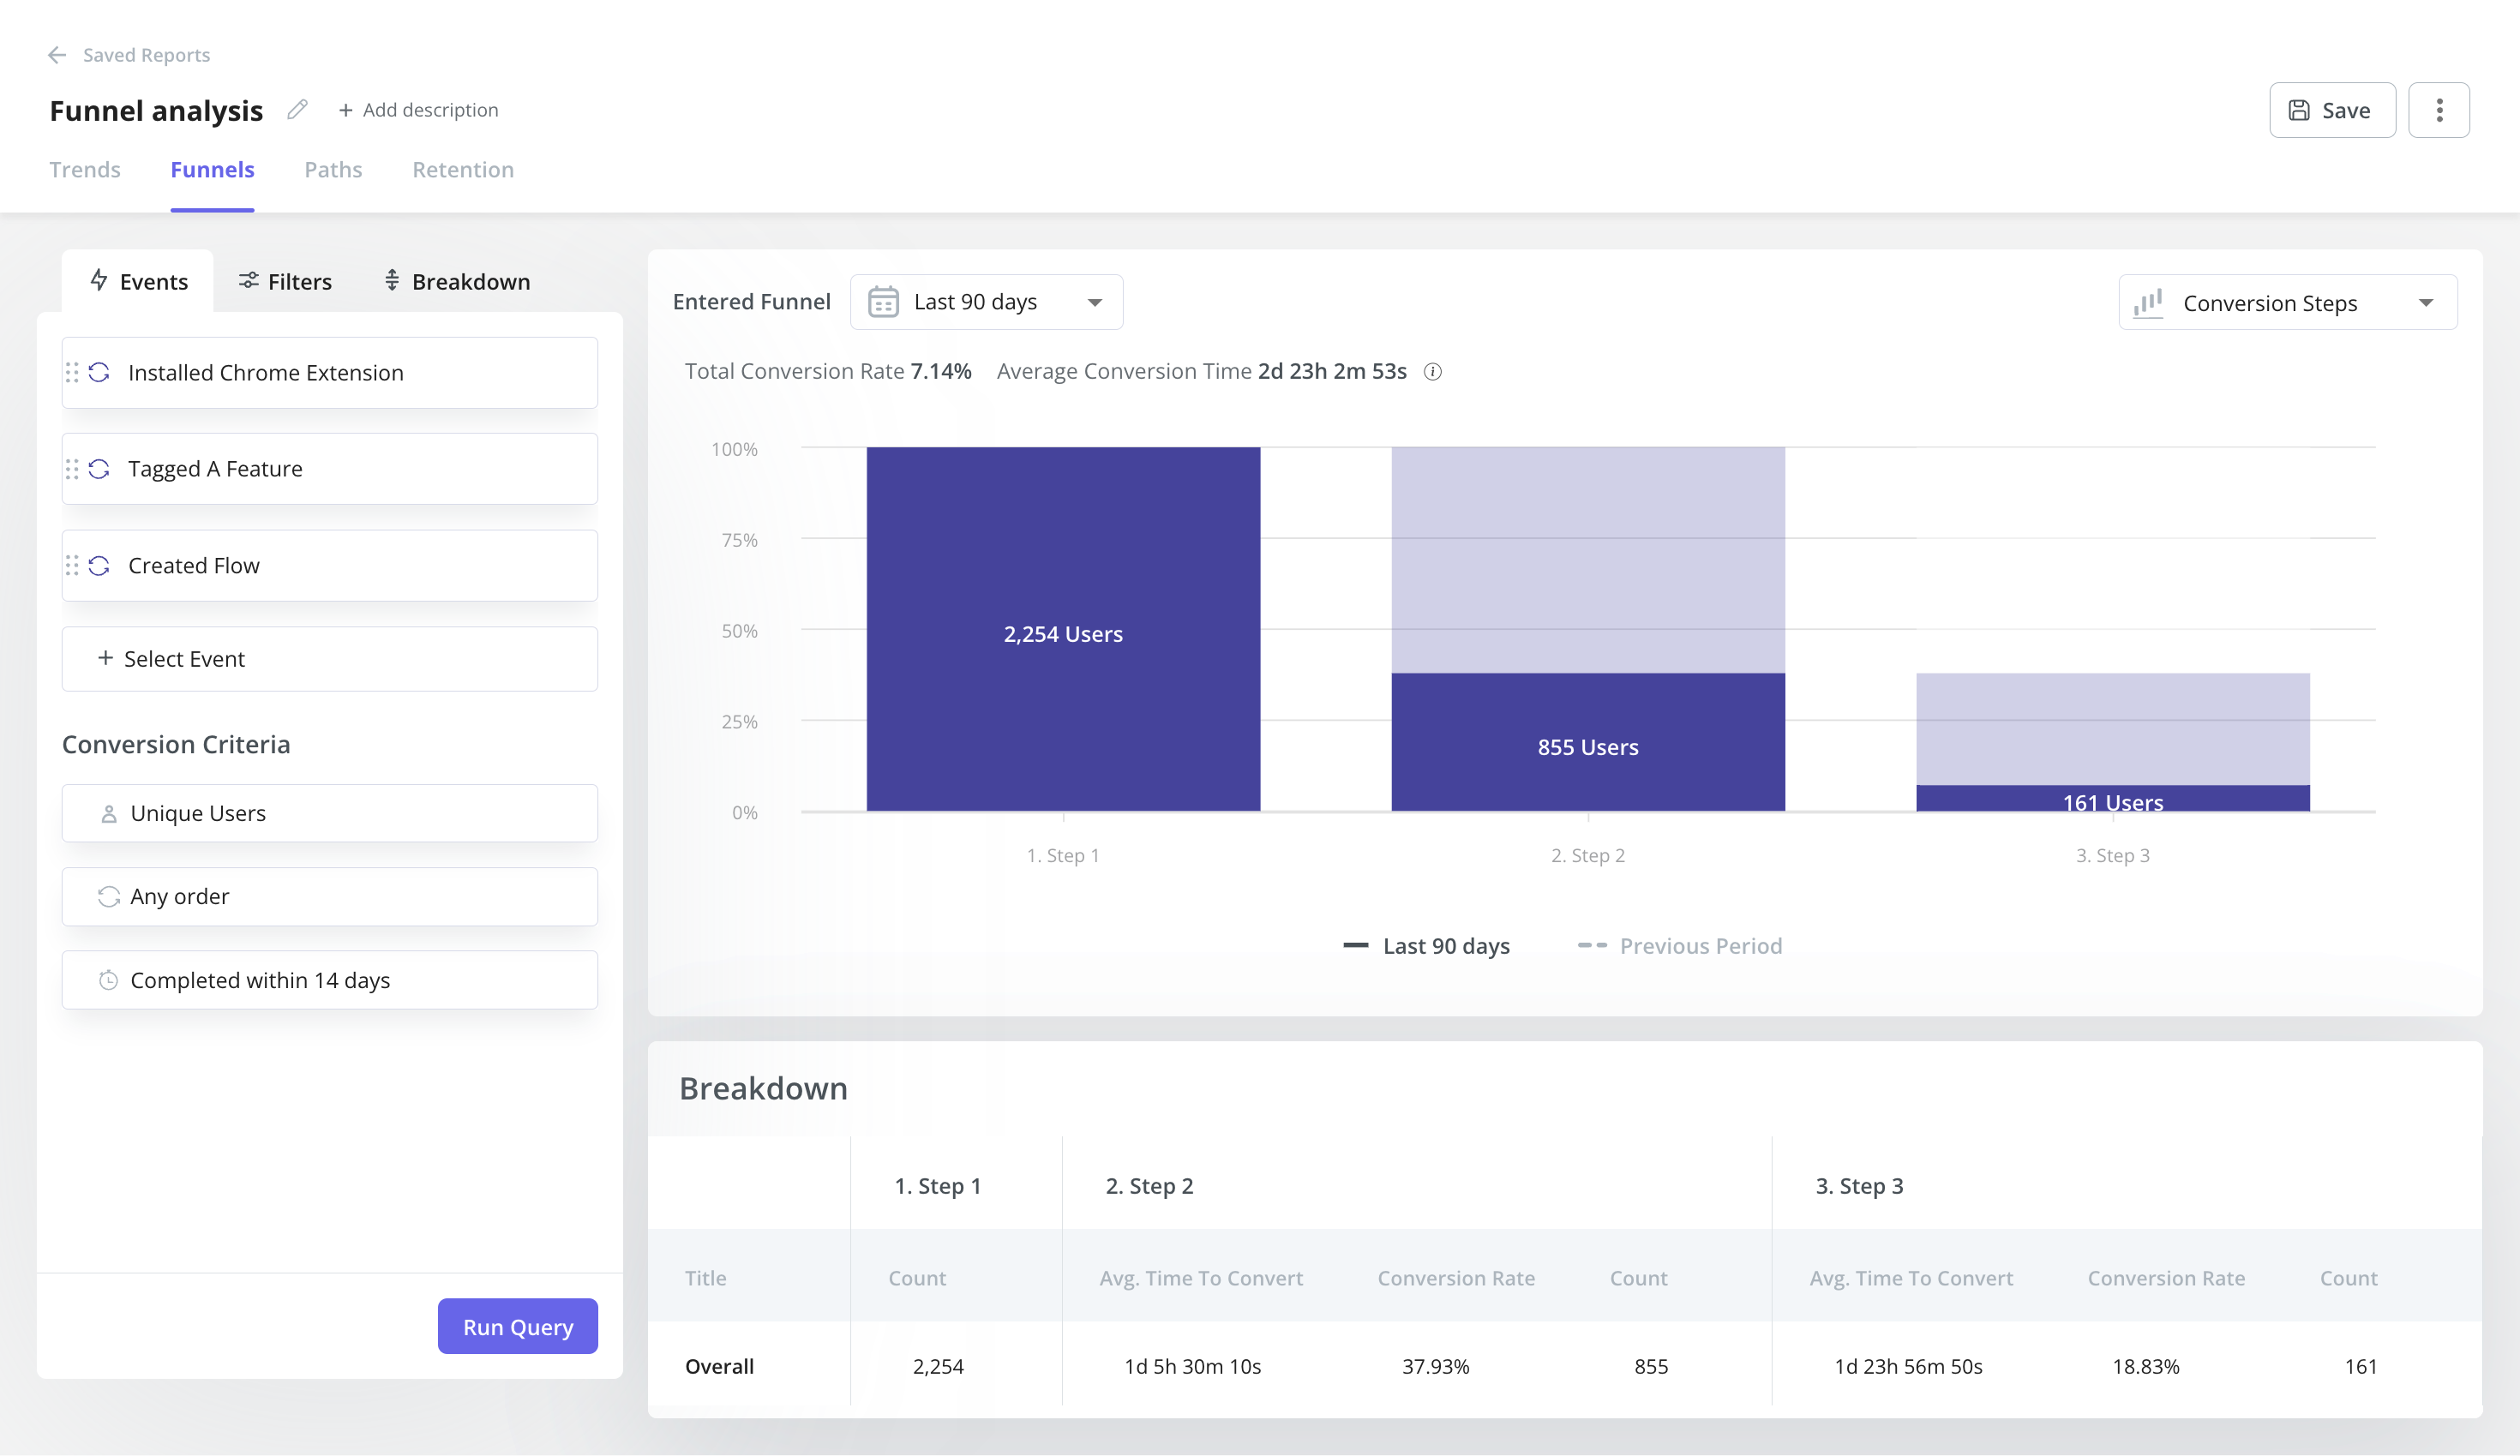
Funnel analysis can help you identify steps with the highest drop-off rates and remove the friction points that users are getting stuck on. Userpilot’s funnel charts let you zoom in on the exact page or feature to find the source of friction and then focus on removing it.
Use segmentation for targeted re-engagement efforts
Segmenting inactive or disengaged users can make it easier to target them with re-engagement efforts. There are plenty of data points you can use to measure how many people are inactive such as their most recent login date, how much money they spend, or how often they interact with a specific feature.
The important thing is you have a standardized way to determine which users should fall into the inactive segment. After all, re-engaging existing users will almost always be cheaper than the customer acquisition cost of getting a new user.
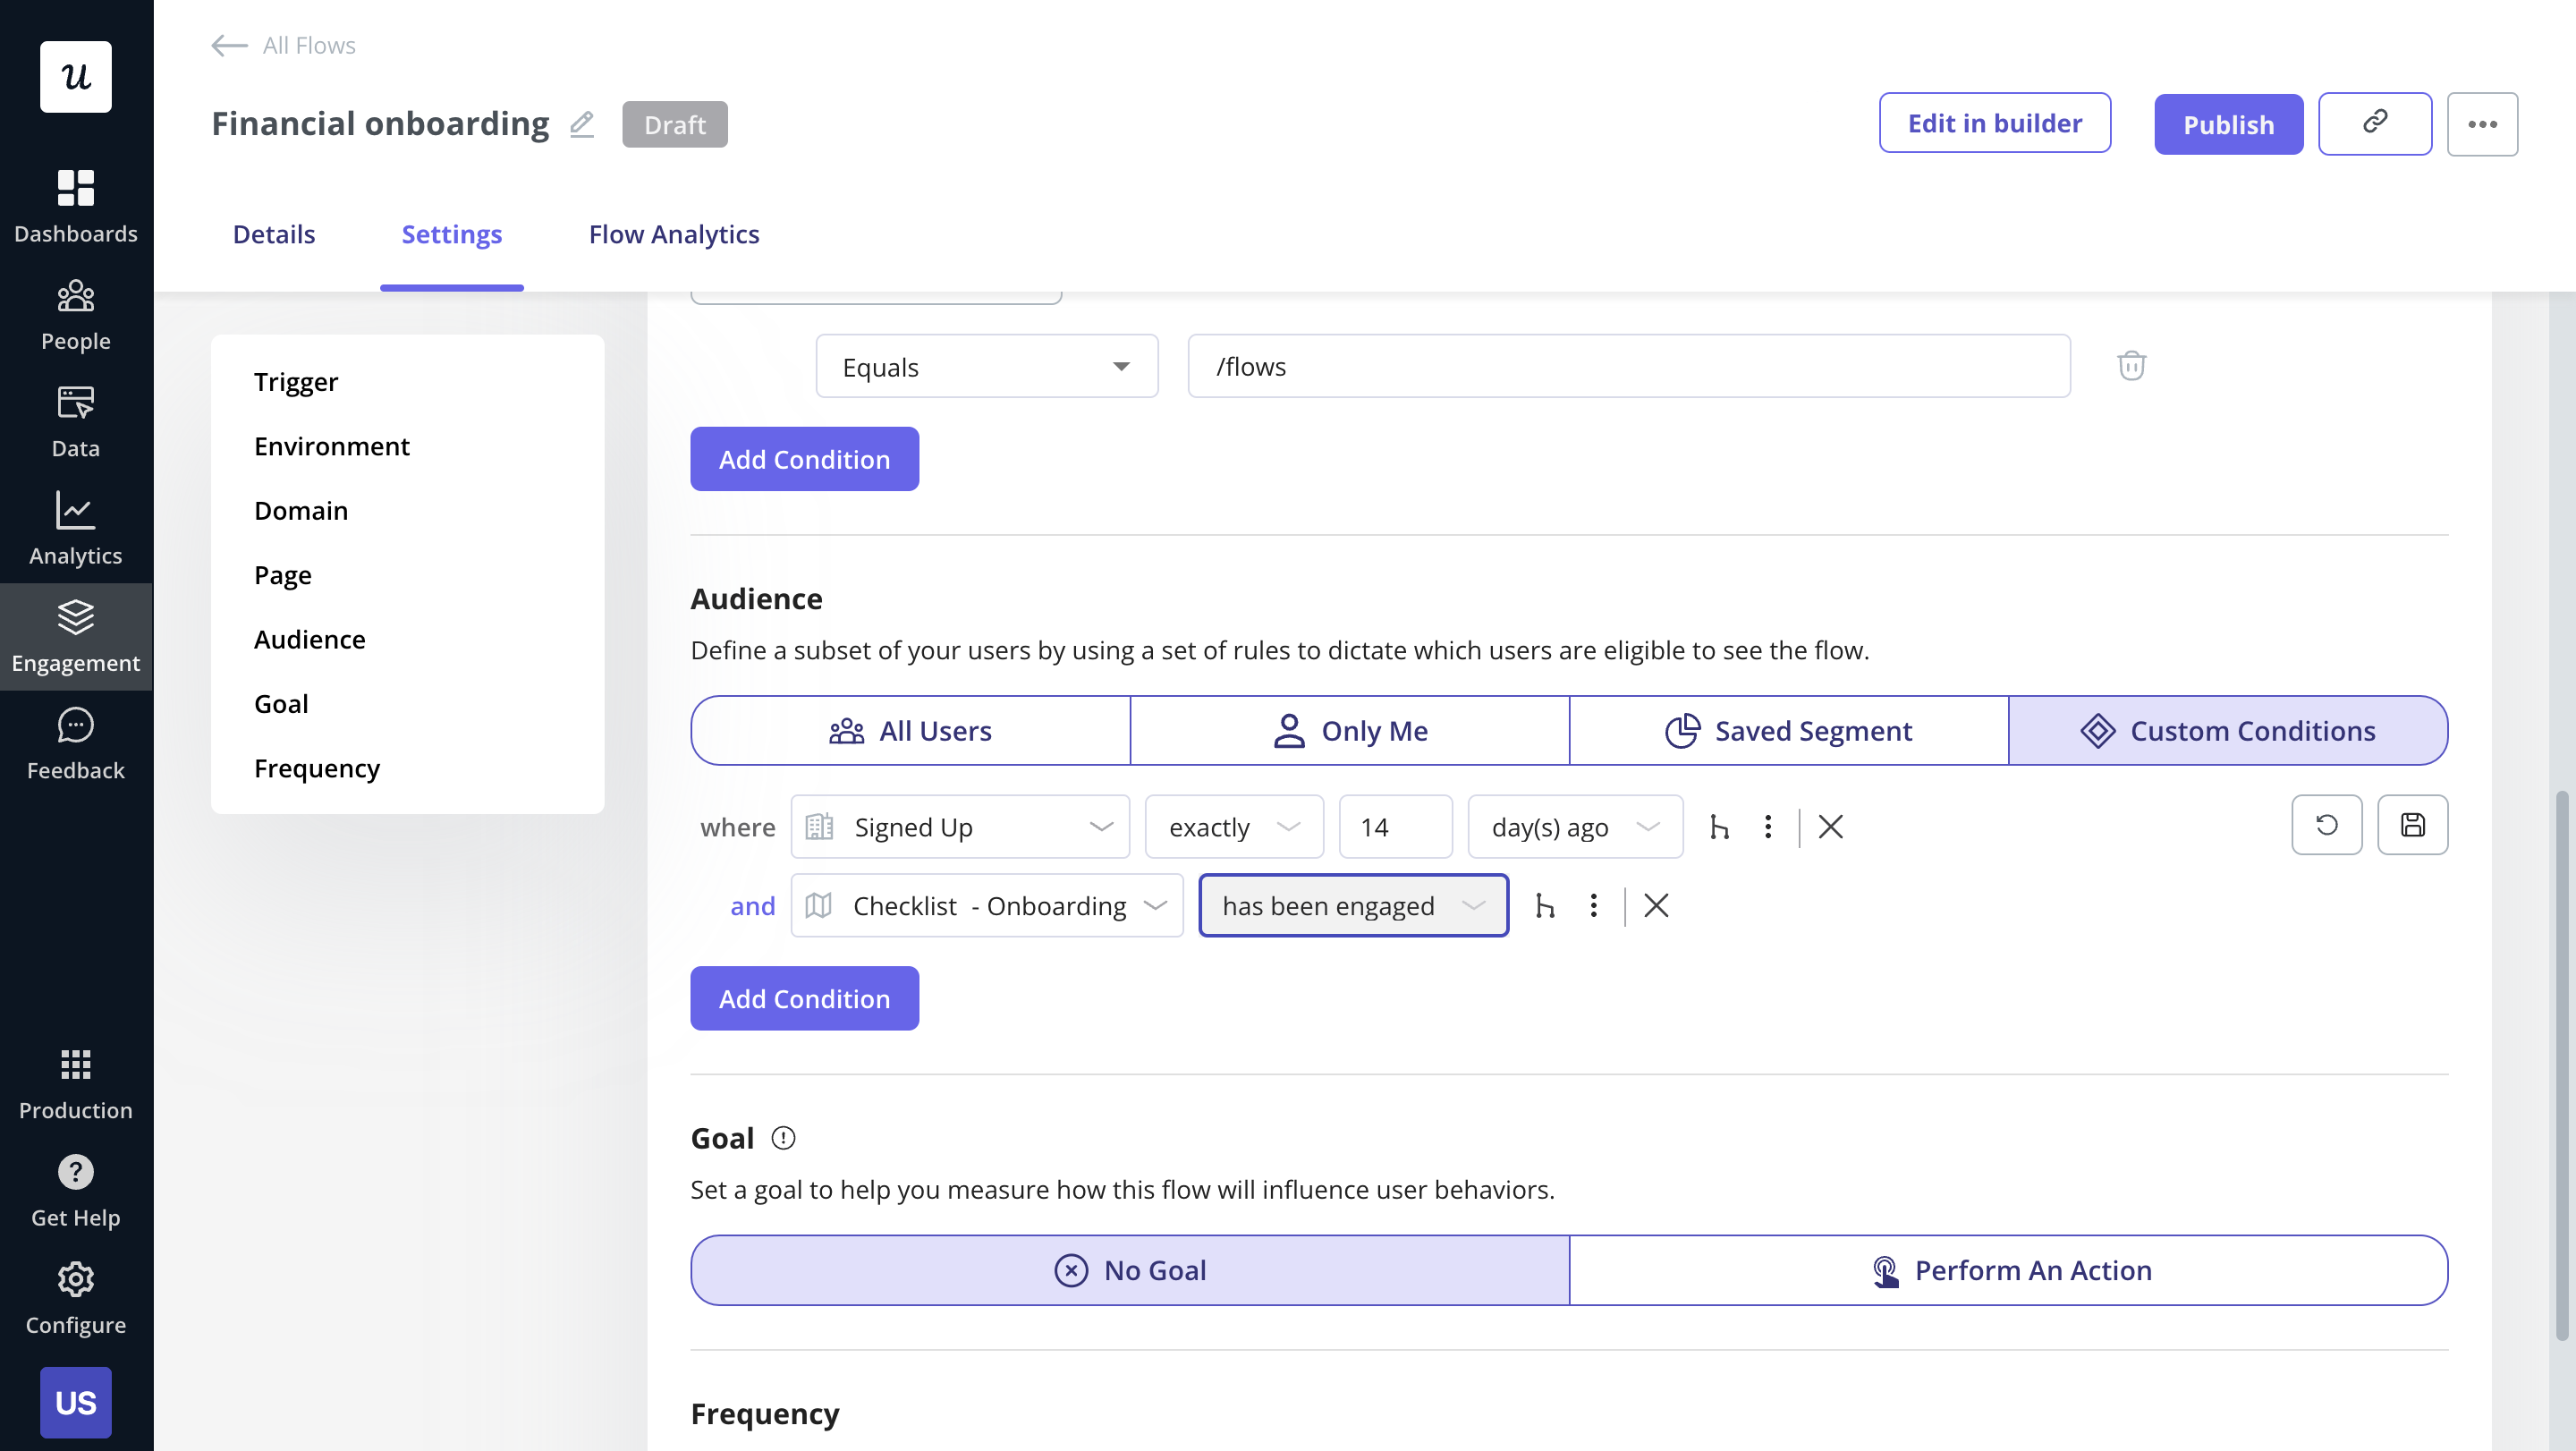
Furthermore, making more users return every single day can help you drive revenue growth by turning your product into a habitual part of their workflow. Userpilot lets you create segments using and/or logic rules to ensure that users are only added to a segment when all specified conditions are met.
Other important metrics to track alongside DAU/MAU
Of course, the DAU/MAU ratio isn’t the only metric that you should look at. There are plenty of other metrics that can show you how repeat users engage with your product. Here are seven other important metrics that you should be tracking:
- Product usage. Product usage can offer you a broader view of how often people use the product and which features they engage with.
- User engagement. User engagement is the overall level of interactivity that users have with your product.
- Product adoption rate. The product adoption rate helps you track the percentage of new users who fully adopt the product.
- User retention rate. The customer retention rate is the percentage of customers that a company retains over a specific time period (usually a month or year).
- Cohort retention rate. Cohort retention analysis helps you compare how different customer groups engage with a product over time (and how that impacts their retention period).
- Churn rate. The customer churn rate measures the percentage of users that cancel their subscription and/or stop interacting with the product over a specific time period.
- Weekly active users (WAUs). For products that aren’t designed to be used daily, a WAU/MAU ratio may be more applicable. Which metric is the right for you will depend on your business model and user base. There’s a wide variance between most companies (even within the same industry).
Conclusion
As you can see, the DAU/MAU ratio is a telling metric for gauging user engagement. There are plenty of other metrics worth tracking, but the percentage of monthly active users who use SaaS products every single day can be a good predictor of potential revenue growth.
If you’re ready to start offering a more personalized experience to each user so you can increase that percentage, then it’s time to get your free Userpilot demo today!


![What are Release Notes? Definition, Best Practices & Examples [+ Release Note Template] cover](https://blog-static.userpilot.com/blog/wp-content/uploads/2026/02/what-are-release-notes-definition-best-practices-examples-release-note-template_1b727da8d60969c39acdb09f617eb616_2000-1024x670.png)
