Engagement Data: How to Collect and Use it to Improve Customer Satisfaction


As a product manager, I rely on engagement data to see how users are finding value in our product, which features are resonating, and what isn’t working.
But getting actionable insights from product engagement data is a challenge when the platforms are fragmented, instrumentation is broken, and any analysis requires developers’ assistance.
At Userpilot, I’ve been able to avoid most of these obstacles just by having the right tools at my disposal. I’m going to share my process for collecting engagement data to improve my product, fix friction points in the user journey, and ultimately boost retention.
Let’s start by clarifying the basic concepts:
What is engagement data?
Engagement data is any measurement related to how users interact with a product. It’s often collected at different stages of the user journey, revealing feature interactions, friction points, and how long it takes to achieve activation. Analyzing engagement data provides valuable insights into improving the product experience.
To get the widest range of insights, you need to collect both qualitative and quantitative data.
Qualitative data
Qualitative data refers to insights that can’t be measured or calculated. It often reflects opinions and subjective perspectives on specific points of your product.
Qualitative data sources include:
- Customer feedback: Comments that a user makes about your product in open-ended survey questions or feature request forms.
- Customer reviews: Thoughts and opinions about your product on platforms like G2 or Capterra.
- Focus groups or customer interviews: You can also invite one or multiple users to answer specific questions about your product and how it can improve. Make sure to have a moderator for customer interviews.
Quantitative data
Quantitative data includes any metric or KPI that measures the performance of your product engagement strategies with a numerical score. It includes engagement metrics such as:
- Core feature usage: Indicates how frequently your users interact with core features.
- Trial-to-paid conversion rate: Reflects the percentage of trial users who convert into paid customers.
- User activation rate: Shows the percentage of new users who reach the activation point.
- Net Promoter Score (NPS): Quantifies the number of promoters versus detractors, ranging from -100 to 100.
How to collect engagement data: 6-step approach
Now, let’s go over my 6-step process for collecting customer engagement data with Userpilot that ensures I have varied sources and good data quality.
Step 1: Learn customers’ jobs-to-be-done from the welcome flow
My first step to collect engagement data is during the signup process.
A welcome flow can serve more than just greeting customers to create a positive first experience with our product. Since customers are more likely to engage during a signup, I include a microsurvey to gather data about their jobs-to-be-done (JTBD), job roles, use cases, and expectations with our product.
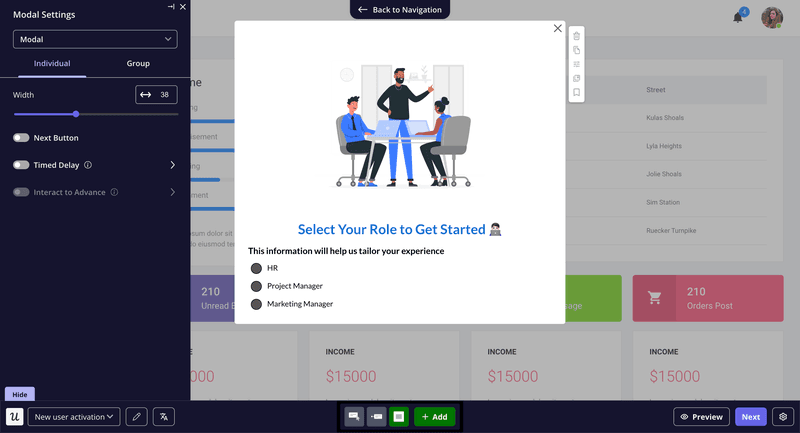
This customer data is extremely useful later on to segment customers based on their JTBDs, observe how different groups interact with our product, and come up with personalization strategies.
Step 2: Track in-app behavior for actionable insights on feature usage
After setting up the welcome survey, my next step is ensuring I’m tracking the right in-app events to analyze feature engagement.
With Userpilot’s autocapture, all clicks, user inputs, and submissions are tracked automatically after you set up the tool, with no need for developers’ help. All I need to do is tag those events with the visual labeler.
With this, I can instantly create charts to see which features are used most, which are underused, and which users are inactive (a churn risk).
Step 3: Use funnel and path analysis to understand the customer journey
Besides looking at feature usage, I also use behavioral reports.
These reports visualize events and combine them to showcase how users navigate through our product. This can include the customer journey from signup to activation, the adoption process of a new feature, or how trial users upgrade to a paid plan.
These specific reports help me figure out what activation steps generate more friction, giving me opportunities to improve the onboarding flows.
The behavioral reports I use the most are:
- Funnel analysis: This report shows how users progress through pre-defined funnel steps, be it for activation, adoption, or conversion. It reveals what steps have the biggest drop-offs so I can further investigate and fix them.
- Path analysis: Unlike funnels, path reports illustrate actual product usage patterns from a starting point to an end point. Instead of showing drop-offs on a fixed customer journey, they let me see what processes users follow to achieve business success and learn what drives product stickiness.
- Trend reports: These show trends in feature usage and identify changes in user behavior (e.g., using tax calculators during tax season).
- Retention cohorts: Group users into different cohorts and track their retention rates over time. This way, I can target re-engagement strategies to cohorts with low retention and learn what experiences lead to less churn.
Step 4: Watch session replays to bring context to engagement data
Between the welcome surveys and the quantitative analyses, I often come up with different hypotheses about how users interact with our product.
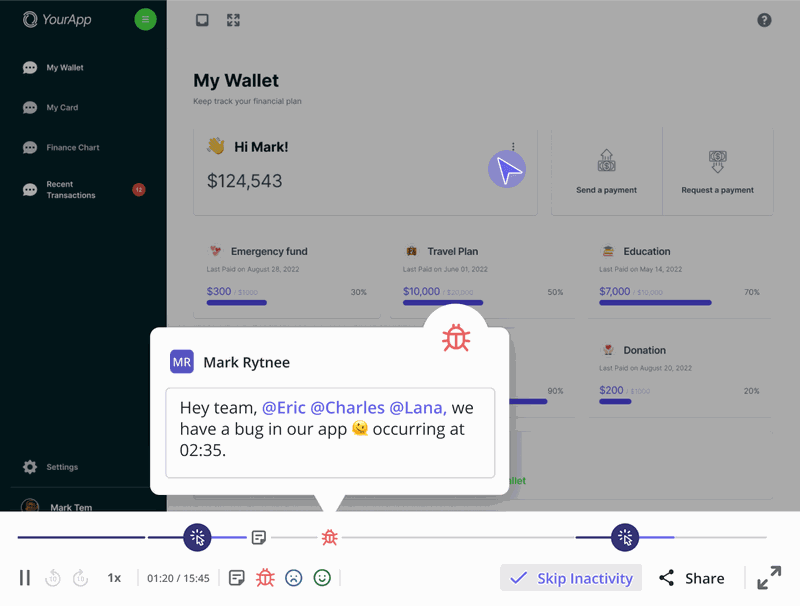
Watching session replays connected to specific points in the customer journey is perfect to cross-reference these hypotheses, validate assumptions, and find new insights I might have ignored.
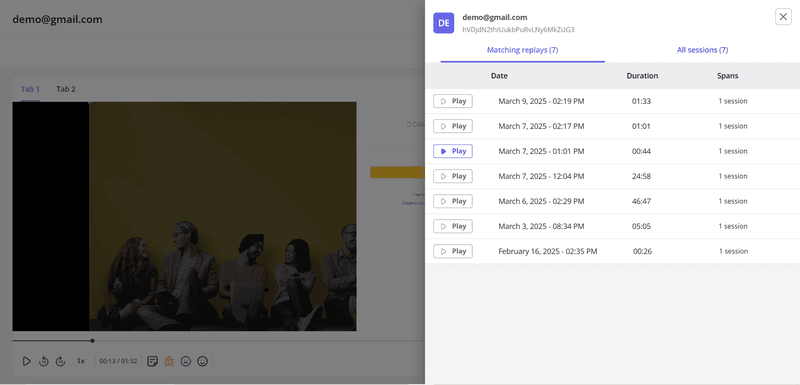
For instance, if I think there’s a bug interrupting the onboarding process, I can watch sessions at the drop-off step to pinpoint the issue.
This process gives a qualitative perspective on quantitative data. So instead of finding a bug, I might spot a usability issue where a button is hard to find.
Step 5: Collect feedback to learn real sentiments and track customer satisfaction
While quantitative data shows what users do, qualitative data tells us why.
To gather feedback, I use Userpilot to send in-app surveys asking users about their experience, new features, or the issues they encountered.
In my experience, NPS surveys are one of the most valuable feedback tools. NPS score correlates with product engagement (more promoters = more power users), but it also helps me segment promoters and detractors. This way, I can get even deeper insights from path analyses, see if any user attributes correlate with NPS answers, and find opportunities to re-engage detractors.
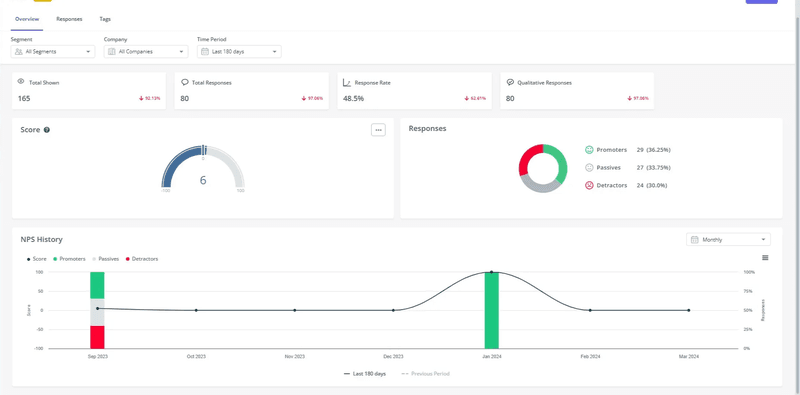
Userpilot’s logic and branching allow me to trigger follow-up NPS questions based on the user’s score and specific conditions, such as visited pages or other previous actions.
Step 6: Test and optimize flows to adjust strategies
Finally, I believe in constant iterative testing to refine my engagement strategies.
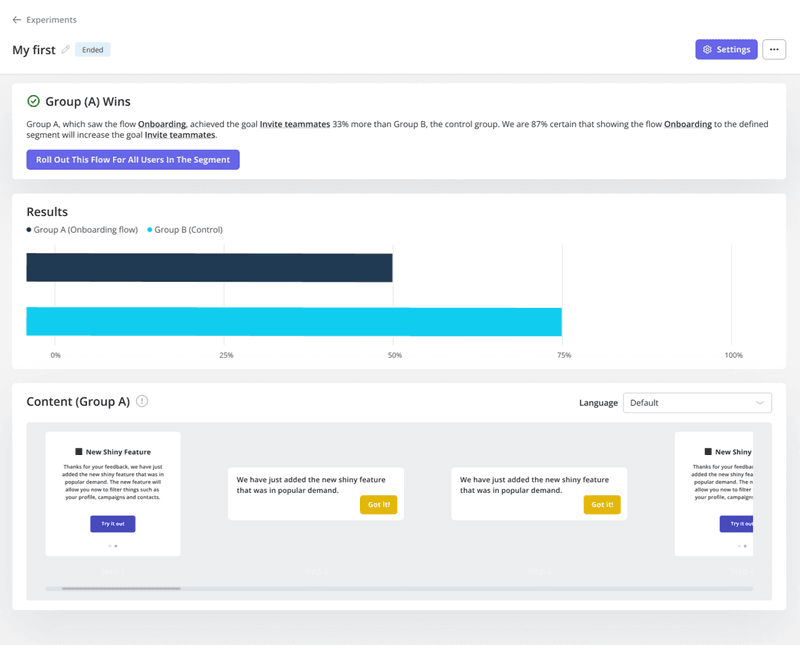
With A/B testing, I can try different versions of our product tours, experiment with various in-app messages, or even tweak button text to see what drives the most engagement.
Moreover, Userpilot lets me perform three types of experiments:
- Controlled testing for comparing the performance of one flow versus having no flow.
- Head-to-head testing for comparing the performance of two different flows.
- Multivariate testing for finding the most optimal combination of buttons, headings, UX copy, and placements to optimize performance (Warning: requires a bigger sample size).
How to use engagement data? Tactics to boost satisfaction and re-engage customers
Once I’ve collected engagement data, it’s time to turn valuable insights into action. Here’s how I approach this process:
Create personalized onboarding flows
Remember the welcome survey, funnel report, and path analysis I used to monitor engagement data? They serve as building blocks for a personalized onboarding experience.
Since now I know what a successful activation path looks like for each segment and recognize the steps with the most drop-offs, I can create a targeted and optimized onboarding flow. Here’s what I do:
- Segment existing users based on the JTBDs they chose in the welcome survey.
- Create a path report from signup to activation for each JTBD and observe the most successful users. This lets me predict users’ engagement paths and identify common challenges with funnels or session replays.
- Build a personalized onboarding process for each segment based on the previous analysis, including checklists, interactive walkthroughs, and hotspots. I can also design a mobile onboarding if applicable, using the same segments.
- Design the flows and target them to selected user groups.
This gives me the power as a product manager to optimize the customer journey, reduce time to value, and prevent funnel drop-offs.
Identify and replicate high-impact experiences
When the data shows that a particular workflow or a specific feature is driving high engagement, I analyze it closely. What made it successful? Can we apply those lessons to other areas of the product?
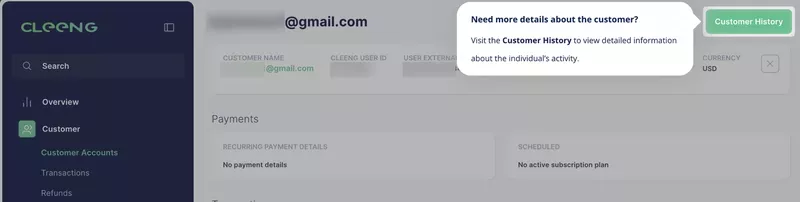
For instance, feature engagement data helps me identify our product’s “sticky” elements, and then design targeted in-app messages (e.g., product tours or native tooltips) to guide more users to value. They can be a part of a secondary onboarding, pointing users to features they may not have used while completing the initial activation flow.
Improve your product by eliminating friction points
As I explained, tools like funnel reports or session replays help me pinpoint exactly where users struggle.
Spotting friction points helps prioritize our product roadmap by ensuring the features causing drop-offs of the most valuable clients are fixed first.
I carefully watch frustrated sessions to spot the source of the friction. I always look for rage clicks, repeated interactions, or any indicator that something is wrong.
For example, if a user performed the same activation task repeatedly without completing the next one, then it’s a clear sign that there’s a friction point. Watching that same session lets me observe what happened and see whether the problem comes from a misplaced button, a bug, or a server issue (while also making it easier to fix).
Re-engage disengaged customers via email
Another use of engagement data is to re-engage dormant users who no longer show in-app activity or are NPS detractors (dissatisfied with the app).
Since they’re outside the product, in-app marketing strategies using modals, pop-ups, or tooltips won’t work, which means I need to set up automated emails as a product manager.
Many popular email marketing automation tools can’t trigger emails based on in-app behavior. But with Userpilot, I can set up re-engagement campaigns that target the segments I already tagged as “dormant” or “detractors.” These might involve sending a gentle invitation to finish their task, showing a new feature that was previously missed, or offering a discount to improve click-through-rates (CTR).
A good example is how Grammarly sends a simple message along with a writing report showing zero activity. It adds an element of gamification that might induce a sense of FOMO in the users.

FAQ
What is customer engagement in SaaS?
Customer engagement refers to activities and interactions that happen in the app. It’s usually measured in the number of repeated user interactions with your product and other touchpoints in the user journey.
Why do you need customer engagement data?
Any product manager must track customer engagement data to:
- Get insights into the customer journey: To break down the entire customer journey into small steps and examine all the activities behind activation, adoption, and conversions. For instance, you can analyze the “Aha” moment stage to see the users’ path from signing up to understanding the value of your product.
- Detect patterns that drive engagement: Find friction points and opportunities for improvement in your product.
- Improve customer satisfaction and retention: Either by providing a frictionless product experience or re-engaging inactive users, improving MRR in the process.
About the author