What Is Pendo in 2026: A Strong Platform That Just Got a Lot More Complicated


Pendo is not the same digital adoption platform you evaluated 18 months ago. Since mid-2025, they’ve shipped Agent Analytics (now GA), launched an MCP Server connecting live Pendo data to Claude, ChatGPT, and Cursor, acquired Chisel Labs for agentic roadmapping, and started migrating their entire Feedback customer base to a new module called Listen. If you’re a product team mid-evaluation or heading into a renewal conversation, that list matters.
The tension I keep running into is this: Pendo is making genuinely smart bets at the AI frontier, and Agent Analytics in particular is first-mover territory. At the same time, pricing has increased 20–34% year-over-year depending on your segment; Feedback is being sunset in favor of a more expensive replacement, and monthly payment terms are gone.
So let me walk you through what’s changed.

What is Pendo.io?
Pendo is a software experience management platform that helps companies understand and improve how users interact with their software, whether those users are human or AI agents. The Pendo platform combines product analytics, customer feedback collection, and in-app guidance into an all-in-one platform, with a dedicated layer for tracking AI agent interactions added on top. Product teams use it to drive business outcomes across the full user journey, from onboarding through expansion.
Pendo serves three main markets:
- Startups and early-stage SaaS teams looking to accelerate product-led growth and product adoption.
- Mid-market and enterprise software companies with complex product portfolios and multi-team adoption needs.
- Enterprise and regulated industries, including financial services, that need to drive internal software adoption across large employee bases.
What is Pendo used for?
Pendo is built for cross-functional teams. Here’s how each persona typically uses it:
| User persona | How they use Pendo |
|---|---|
| Product managers | Track feature usage and identify which new features are gaining traction; prioritize the roadmap using key metrics and user feedback; measure the impact of product changes on engagement metrics and retention. |
| Product marketers | Identify user behaviors that correlate with conversion and trigger upsell campaigns at the right moment; target specific user segments with tailored in-app campaigns; sync product data with CRM for more accurate lead scoring. |
| UX designers | Analyze user paths and drop-offs; measure interaction with design changes; recruit usability test participants. |
| Customer success managers | Automate user onboarding and guide users toward first value without in-person training; identify at-risk users who show signs of frustration and intervene before they leave; improve customer loyalty and user satisfaction by reducing support friction with in-app help. |
| IT and operations teams | Drive adoption of internal tools; track usage of mandatory systems; surface workflow bottlenecks across apps. |
| Sales teams | Use product usage data to identify expansion opportunities and prioritize outreach based on engagement signals. |
What are Pendo’s core features?
Pendo’s feature set covers everything from product analytics and in-app guidance to user feedback and roadmapping. They include:
Product analytics
My favorite feature in this product analytics platform is retroactive analysis, which lets you tag a feature today and view historical data from when the snippet was first installed, without needing to re-instrument anything. Pendo’s full analytics suite covers:
- Autocapture: Records clicks, page views, and text inputs without manual event tagging.
- User paths, funnels, and retention cohorts: Understand how users navigate your product, spot usage patterns and drop-offs in the user journey, and track what drives long-term engagement.
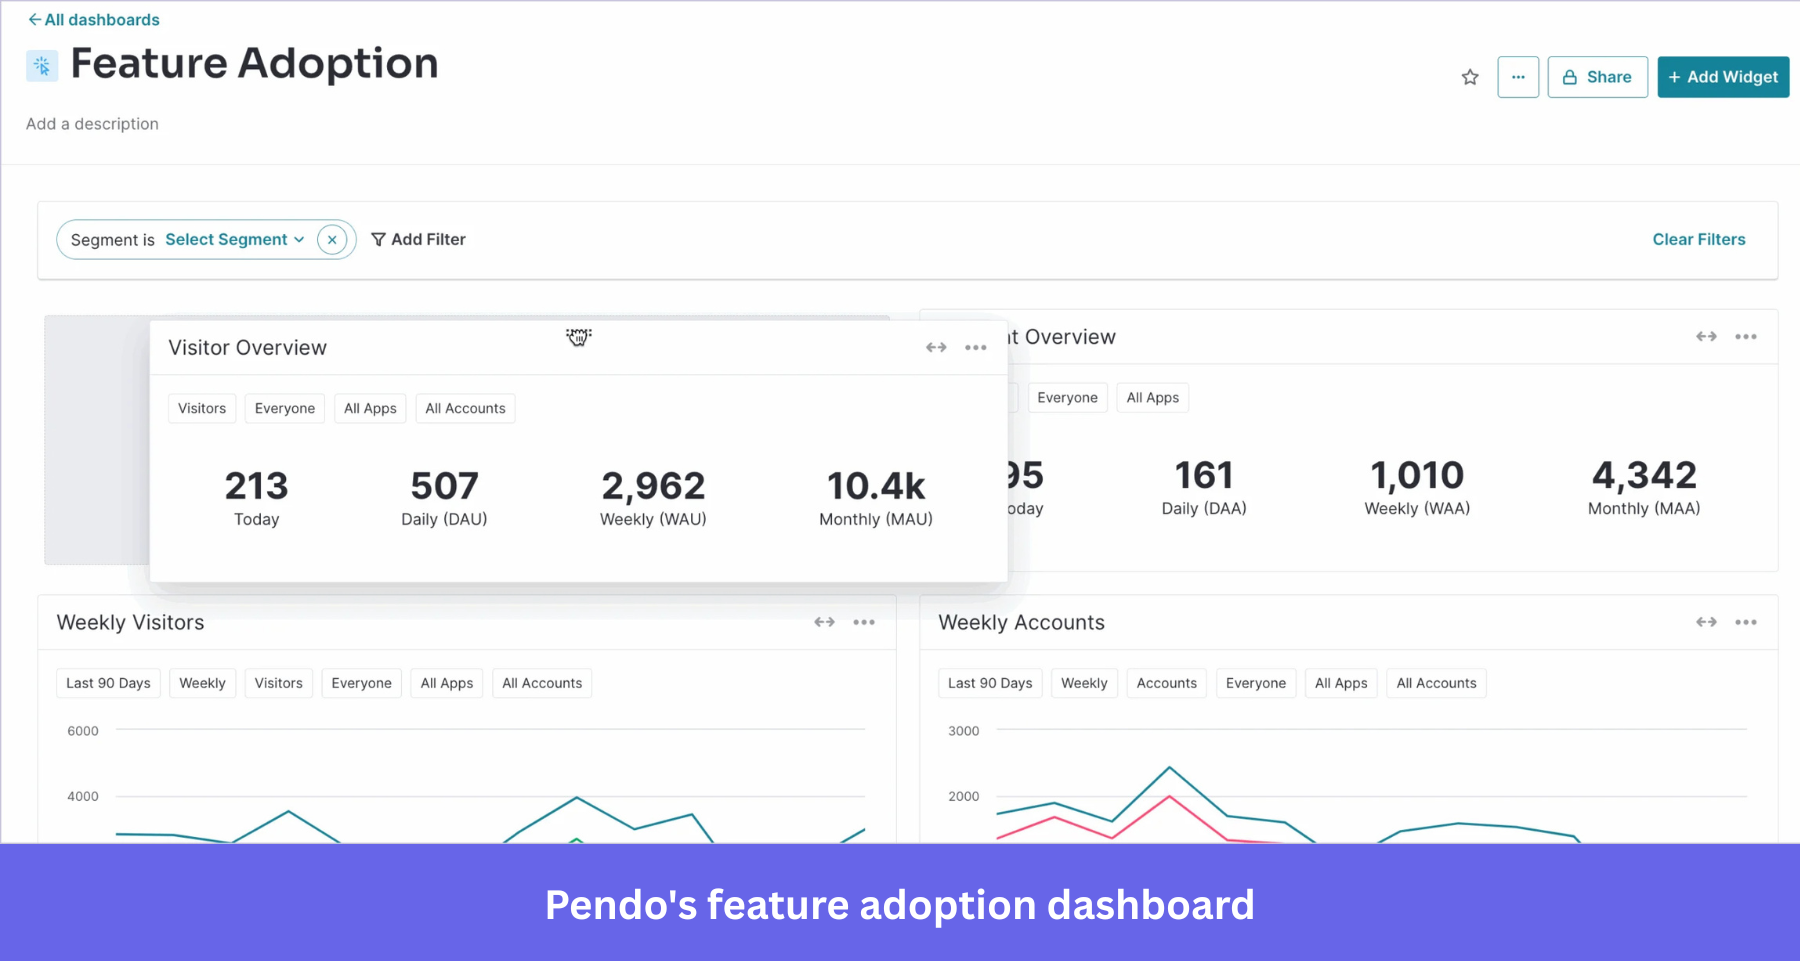
- Custom dashboards: Drag-and-drop widgets to monitor key metrics, including how many users are active, feature adoption rates, and engagement metrics across user groups.
- Product Engagement Score (PES): A composite metric combining adoption, stickiness, and growth into a single health number, useful for identifying power users and at-risk accounts.
- Session replay: Video-like recordings that let product teams identify friction points, usability issues, and bugs through playbacks of actual user sessions, with notes, comments, and Jira issue flagging.
- Heatmaps and clickmaps: Visual overlays showing where users click, scroll, and spend time.
- Data export: Stream product data to Snowflake, Redshift, BigQuery, and BI tools for deeper analysis.
In-app engagement (Pendo Guides and Orchestrate)
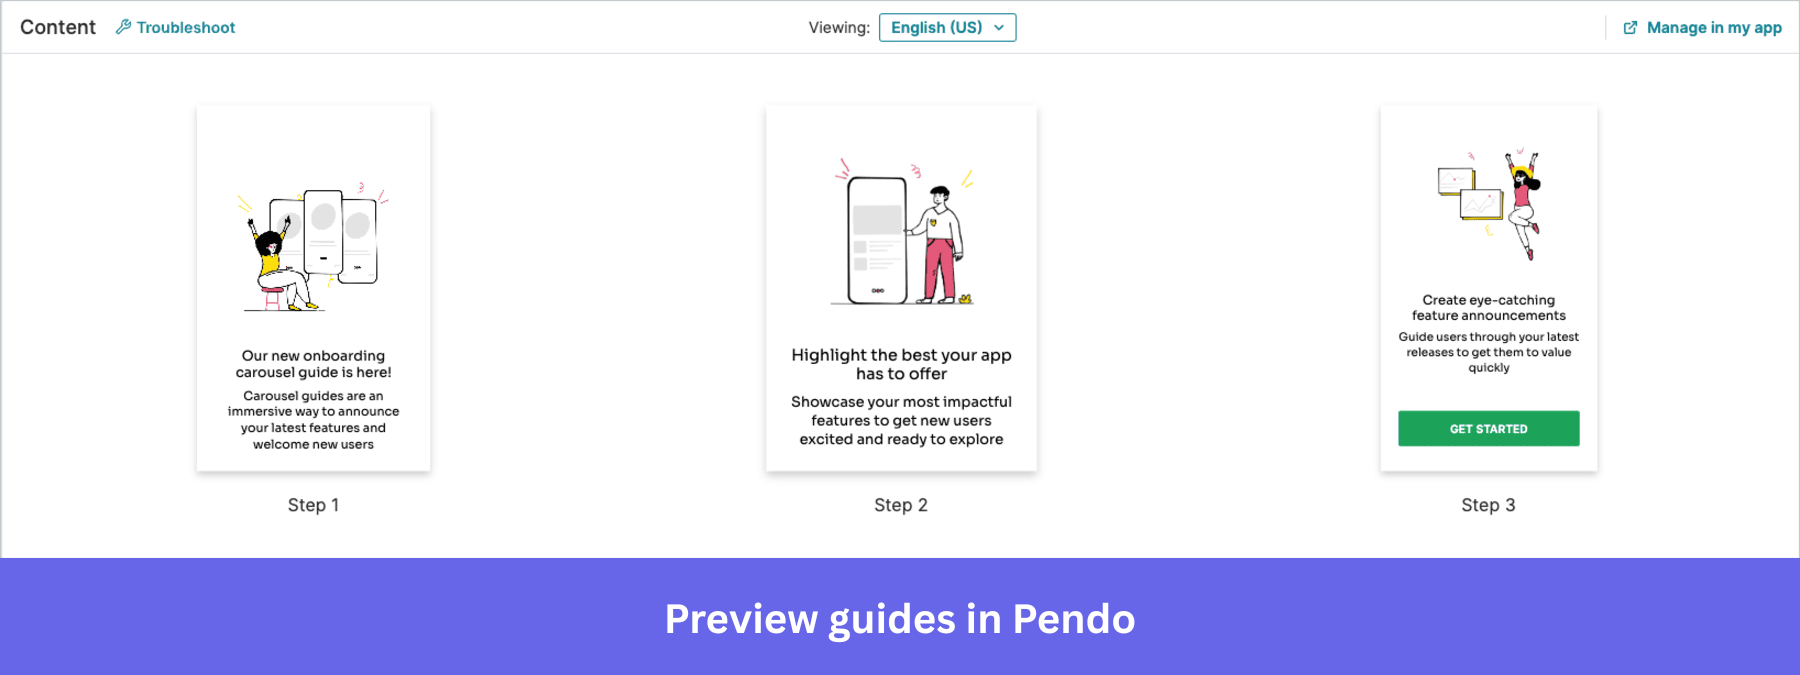
Pendo Guides lets product teams create user guides, helpful tips, and in-app experiences (modals, tooltips, banners, slideouts, and badges) across web and mobile apps. Teams use it heavily for user onboarding of new features, guiding users toward the first value without in-person training. There are also AI-generated guides via Google Generative AI, where you provide a prompt, a starting URL, and a tone preference, and Pendo builds a multi-step guide automatically.
For cross-channel journeys that combine in-app guides with email, Pendo uses a separate product called Orchestrate. Guides is focused on in-app messages only; Orchestrate handles multi-channel sequencing.
What’s included in Guides at standard tiers:
- UI patterns: Modals, tooltips, banners, slideouts, and badges.
- Resource center: A self-serve hub with documentation, video tutorials, and triggered walkthroughs.
- Mobile SDK: Pendo extends its capabilities to mobile users via native SDKs for iOS and Android, as well as cross-platform frameworks such as Xamarin, MAUI, React Native, Expo, Flutter, and SwiftUI.
What requires Guides Pro (Ultimate plan or paid add-on):
- Standalone checklists: Only available inside the resource center or as a Task List in Guides Pro. Not a native flow type at lower tiers.
- Conditional branching: Skip-ineligible steps and metadata-based flows require Guides Pro.
User feedback and the Listen transition
This is where the most has changed since mid-2025, and most teams don’t find out until they’re in a renewal conversation. Pendo is sunsetting Pendo Feedback and replacing it with Pendo Listen. Existing customers can renew with Feedback through 2026, but Listen will be required after that.
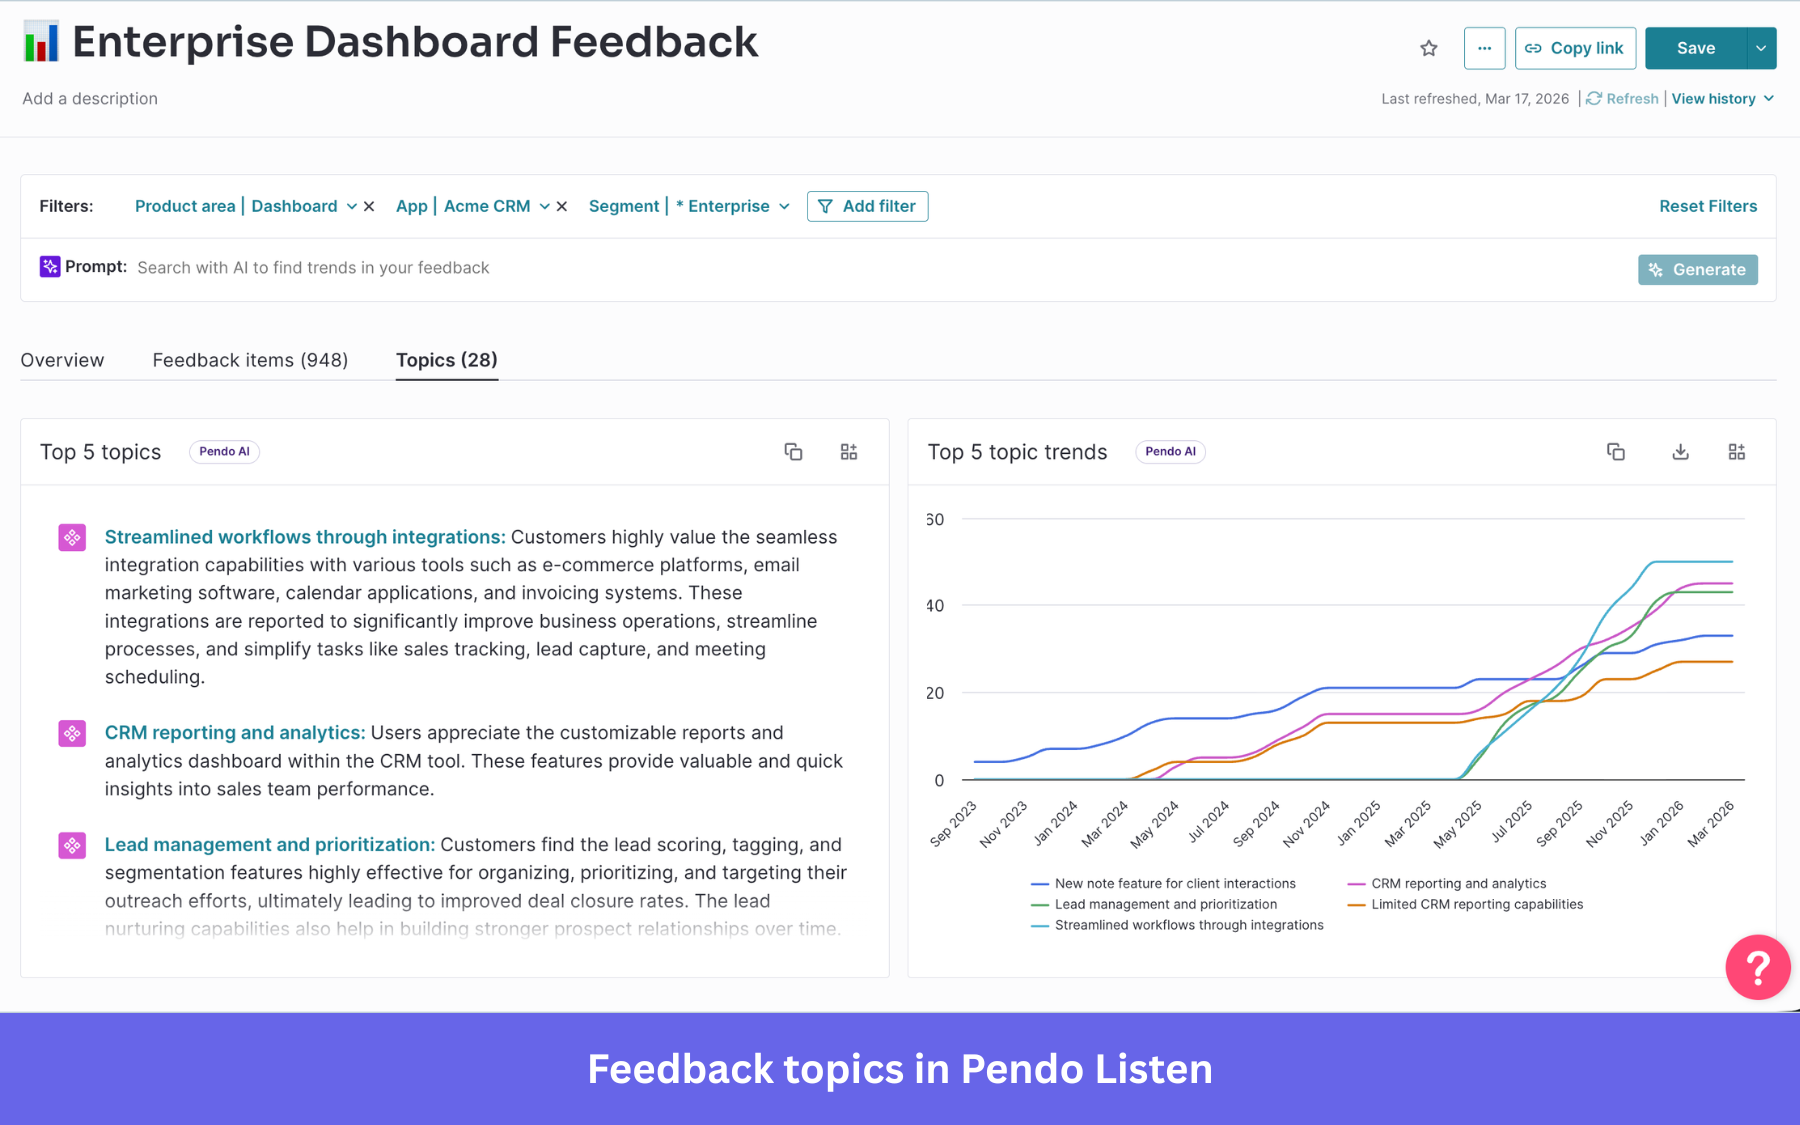
Listen includes automated theme detection, trend alerts, idea validation, a product roadmap tool, and AI-powered sentiment analysis. The problem is what it costs.
According to procurement data from Vendr, Listen runs at roughly 30% of your existing contract ARR, though reps have been offering up to 50% discounts for teams who add it at renewal rather than mid-term. On a $50,000 annual contract, that’s a conversation starting around $15,000–$25,000.
Teams on Base or Core plans using Pendo NPS to collect customer feedback and track user satisfaction need to plan for this explicitly. The polls embedded in standard Guides (two templates, no branching logic) still let you capture basic signals, but richer customer feedback collection, including sentiment analysis, feature requests, and idea validation, requires Listen. Budget for it or scope an alternative before your next renewal.
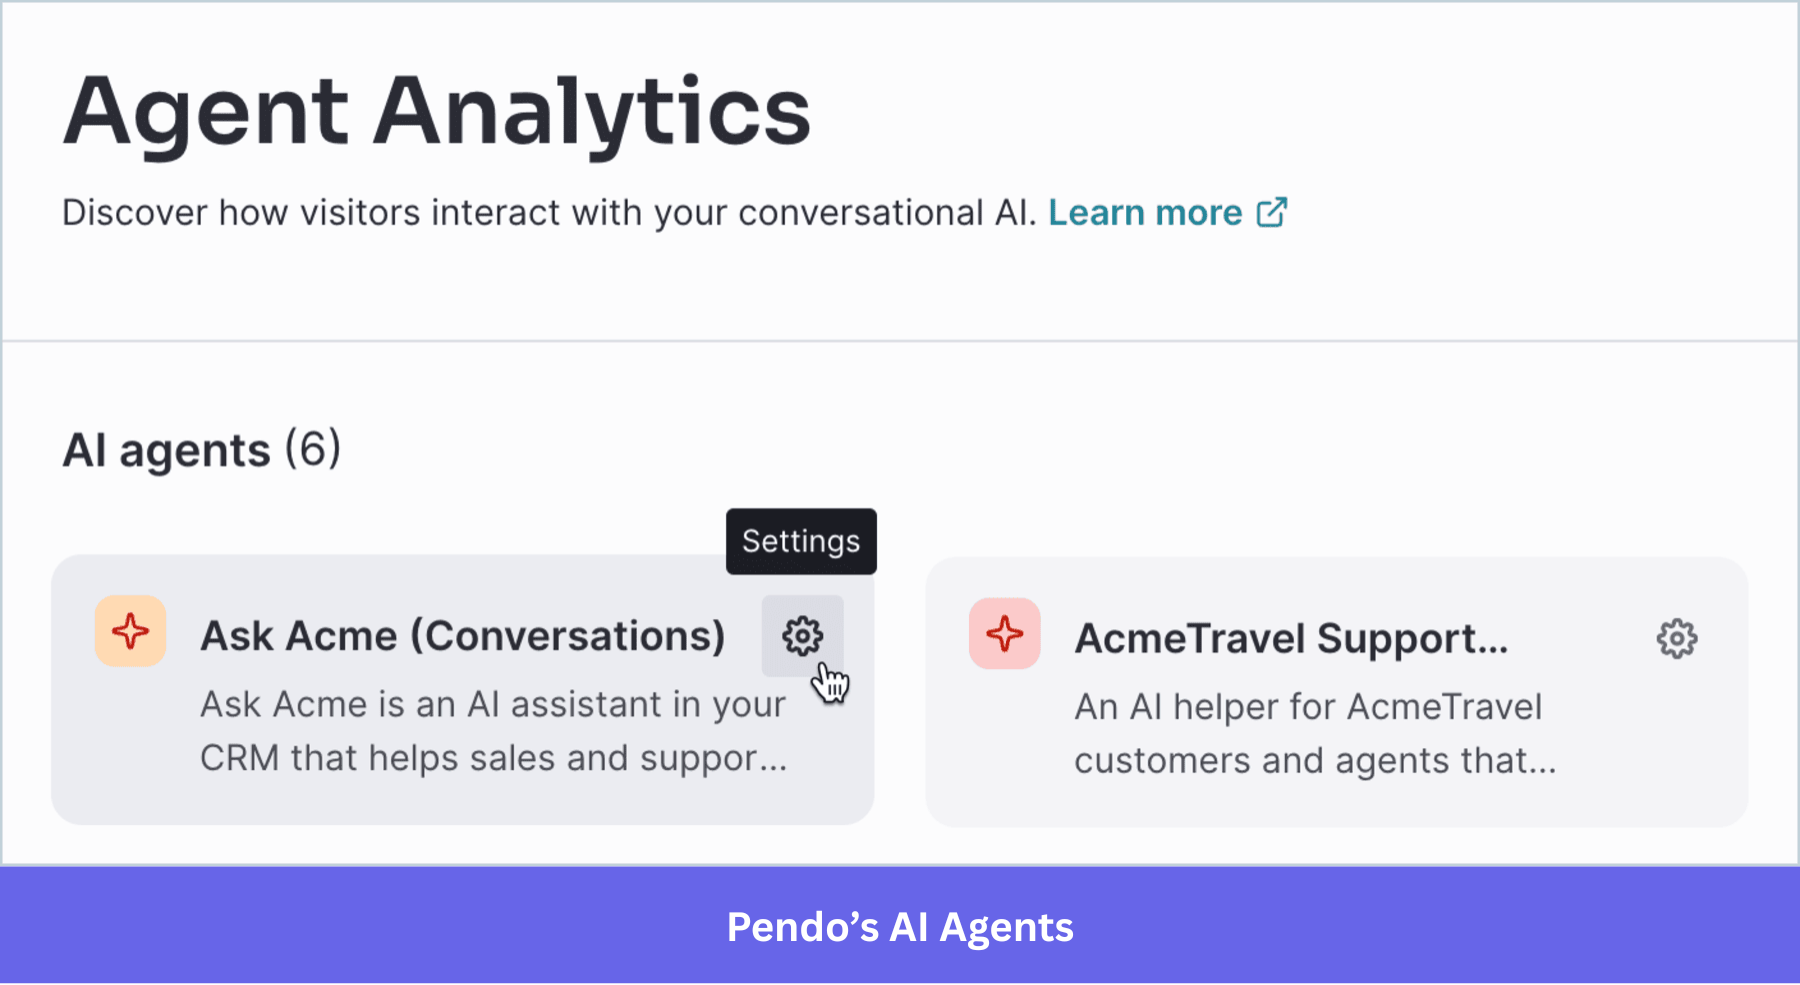
Agent Analytics
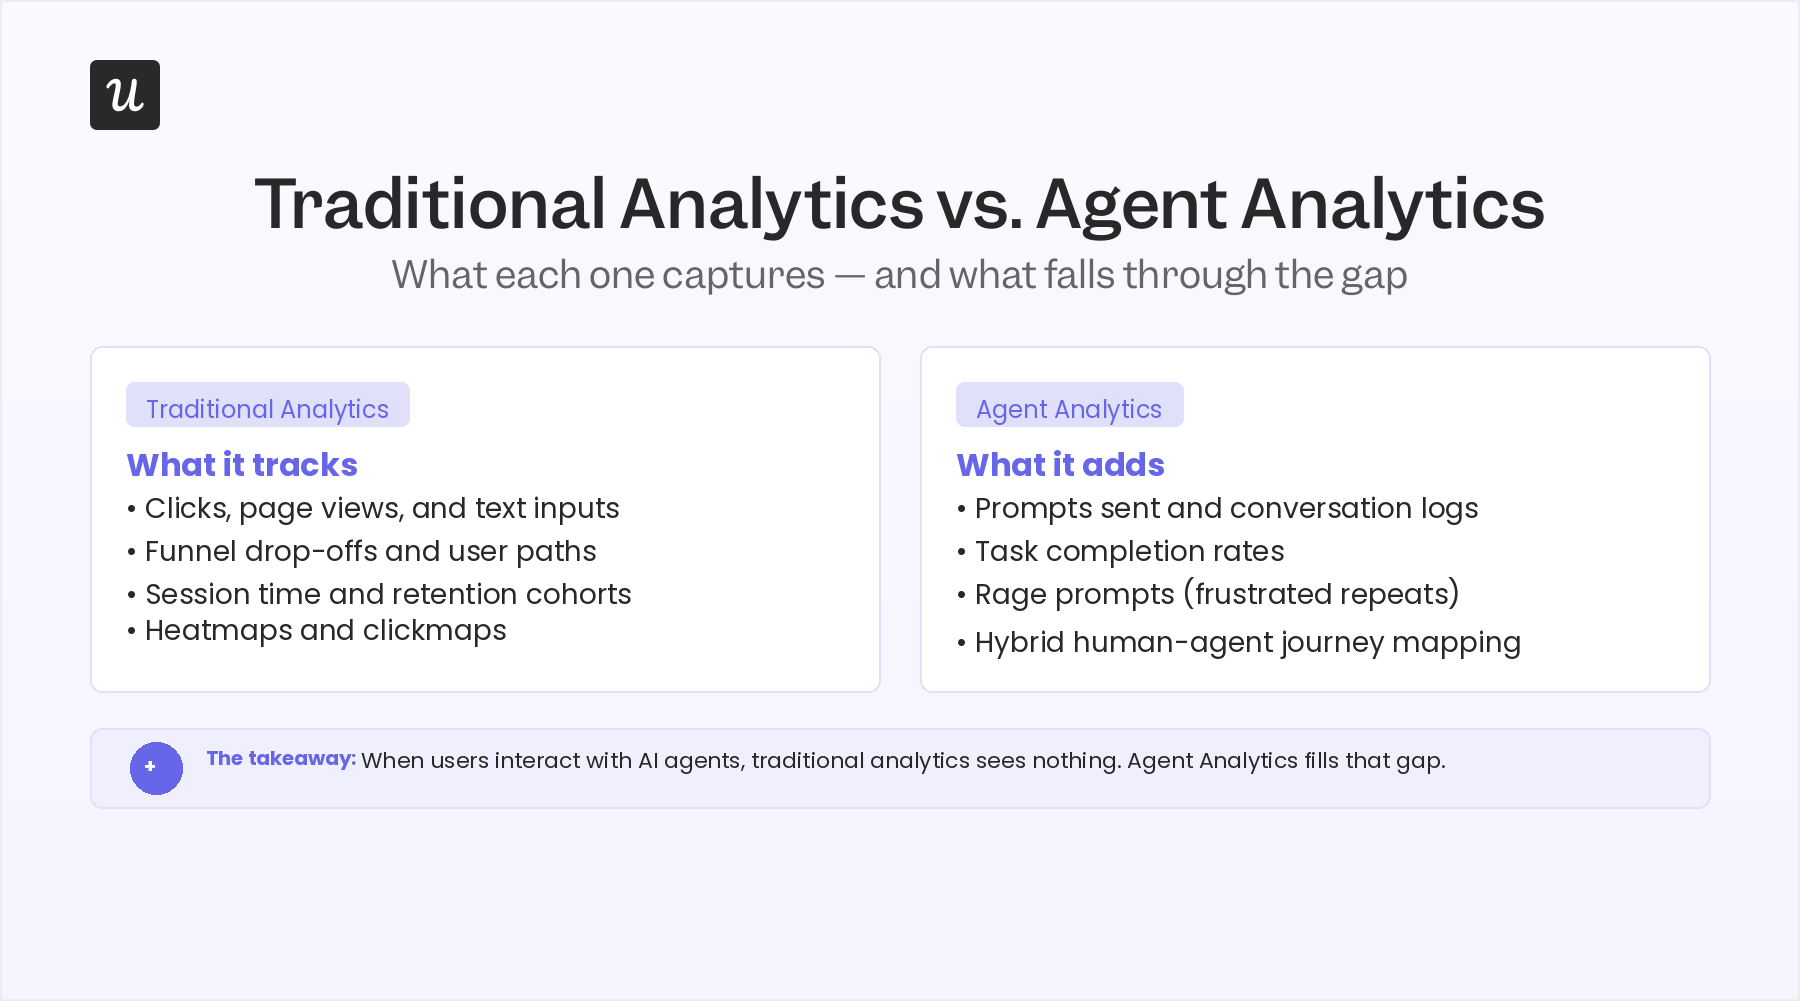
Agent Analytics is Pendo’s most significant launch since session replay, reaching general availability in 2025. Traditional analytics tools were built around clicks, page views, and session time, so they miss many user interactions that occur within AI agent conversations. Agent Analytics fills that gap by tracking the signals that matter for AI-powered features:
- Hybrid journey mapping: How users move between traditional UI interactions and agent conversations, and what they do before and after.
- Prompts and conversations: What users are asking agents to do, and how often.
- Task completion rates: Whether agents are actually finishing what users asked.
- Rage prompts: Repeated frustrated attempts that signal friction or failure.
The Pendo MCP Server, also now GA, connects live product data to MCP-supported AI clients: Claude, ChatGPT, Cursor, Gemini CLI, and Windsurf. From those tools, you can query visitor metadata, pull analytics, and search Pendo objects using natural language. Leo, Pendo’s AI assistant, does the same directly from the Pendo interface.
Agent Analytics is most useful for teams that have already shipped AI agents to users and need to validate whether those agents are working. If you haven’t shipped agents yet, you’re buying infrastructure for a use case you don’t have yet. It’s also priced separately and is not included in any standard Pendo plan.
Employee productivity features
You can also deploy Pendo on top of internal applications to improve employee software adoption and team innovation. Pendo for Employees covers three main use cases:
- SaaS portfolio insights: Visibility into app usage and license activity to reduce software waste.
- Process analytics: Track how employees navigate workflows across apps to uncover bottlenecks.
- In-app walkthroughs: Step-by-step guidance for training employees on enterprise tools like Salesforce or Zendesk.
How much does Pendo cost?
Pendo software pricing has always been sales-gated and opaque, so it is rarely clear from a first conversation. According to Vendr data covering over 500 Pendo purchases, typical annual contract values range from $17,945 to $150,124, with a mid-market median of around $49,015.
Three changes that weren’t in the picture 18 months ago:
- Year-over-year increases: SMB pricing up roughly 19.9%, enterprise up roughly 33.9%, per SpendHound’s procurement data. These are real increases, not MAU-driven growth.
- Annual-only billing: Monthly payment terms are gone. Semi-annual carries a 5% surcharge.
- The Listen migration: Teams that rely on Pendo Feedback for NPS, sentiment, or roadmapping are being moved to Listen, which is priced at roughly 30% of contract ARR. Negotiated discounts of up to 50% are available at renewal, but only for teams who know how to ask.
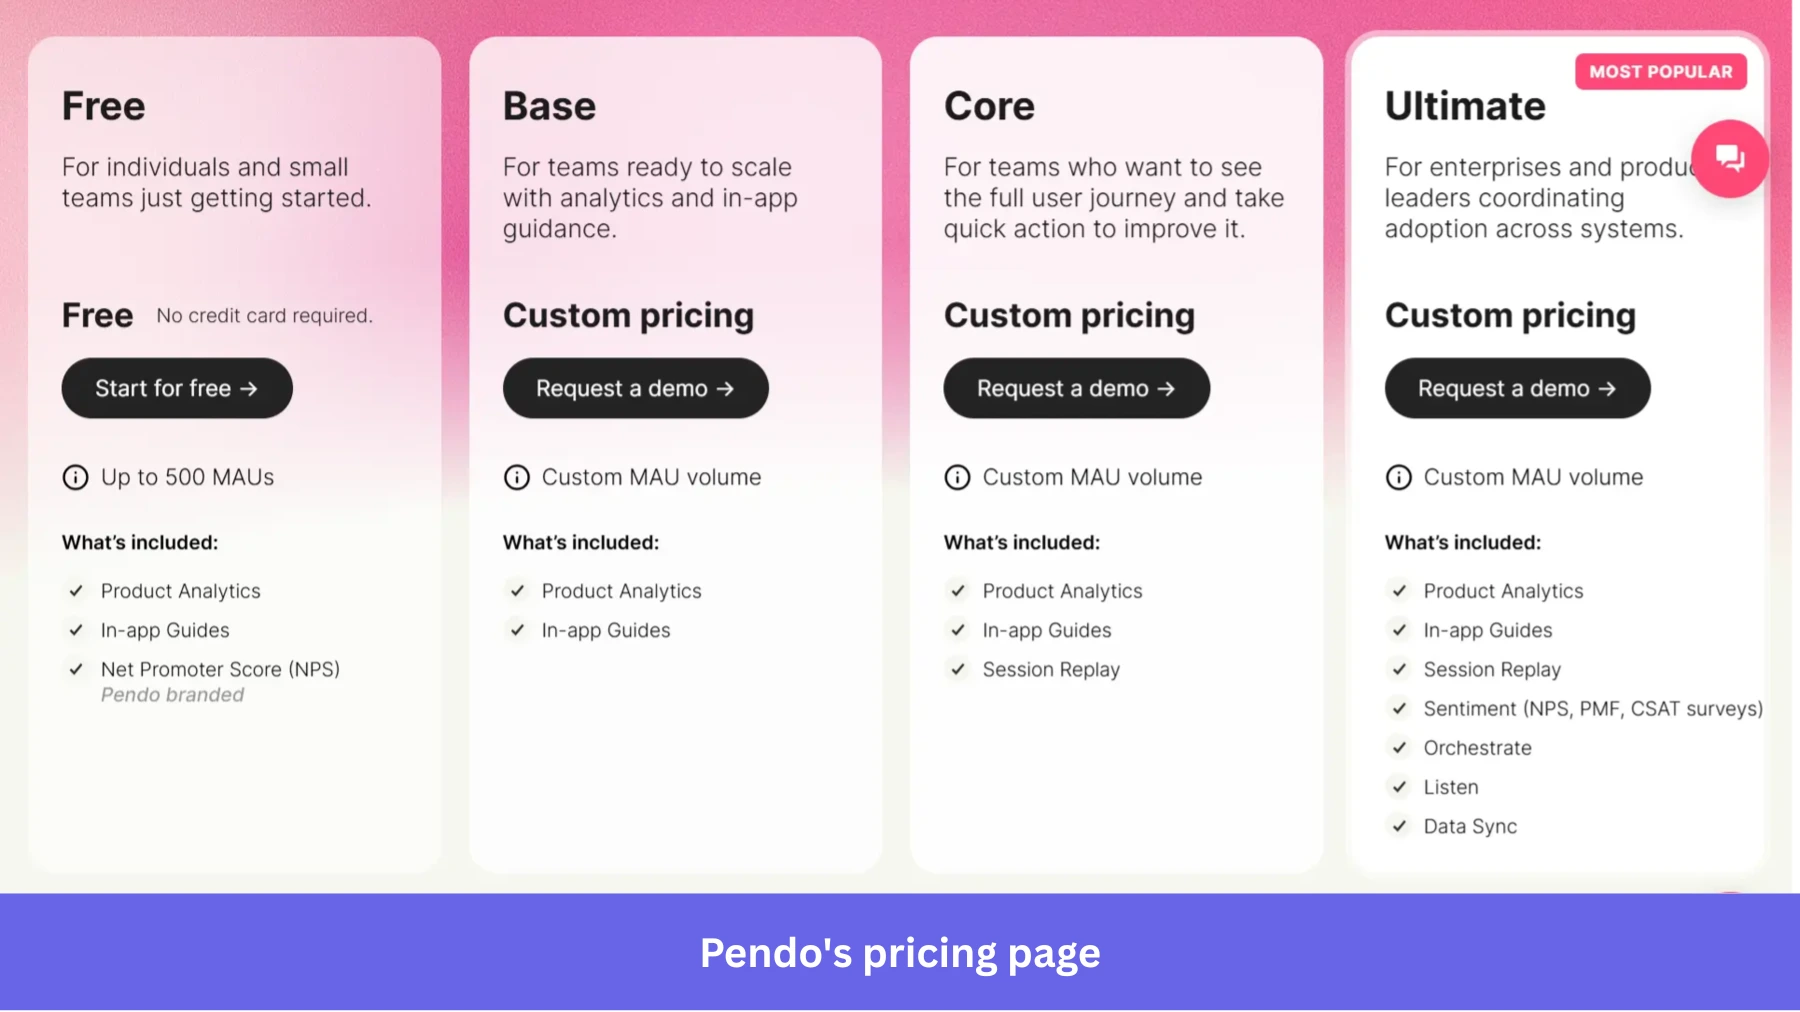
Pendo currently offers four plans: Free, Base, Core, and Ultimate. Pendo Free is free forever for up to 500 MAUs and includes access to basic analytics and in-app guides. Paid plans scale based on how many users you need to track and which modules you need.
Most headline features are available in standard plans, but the advanced features that make them genuinely useful (conditional branching, standalone checklists, AI translation, sentiment analysis) are locked behind Guides Pro or Listen. Include a line item for add-ons before comparing the total cost with alternatives.
Is Pendo worth the investment?
After going through user reviews and tracking what’s changed in the past year, here’s where I land on Pendo’s strengths and weaknesses:
| ✅ Advantages of Pendo | ❌ Disadvantages of Pendo |
|---|---|
| Retroactive analytics: Tag a feature today, see historical data from day one of the snippet, without re-instrumenting anything. | High complexity: Setup requires metadata configuration, manual feature tagging, and segment management. Feature underutilization is a documented outcome for teams without a dedicated Pendo admin. |
| Unified platform: An all-in-one platform combining analytics, in-app guidance, feedback, roadmapping, and employee adoption, with fewer tools to stitch together at enterprise scale. | Pricing increases: SMB contracts up ~20% year-over-year, enterprise up ~34%. Monthly billing is gone. The Listen migration is adding unexpected cost at renewal for most customers. |
| Agent Analytics: Dedicated capability for measuring AI agent interactions: prompts, task completion, rage prompts, failure signals. Among the most mature solutions in this space. | Guide limitations at standard tiers: Advanced features like standalone checklists and conditional branching require Guides Pro (Ultimate plan or paid add-on). Email and cross-channel sequencing require Orchestrate, a separate product. |
| MCP Server: Live Pendo data is queryable from Claude, ChatGPT, Cursor, and Gemini CLI, making analytics accessible without opening a dashboard. | Feedback sunset: Pendo Feedback is being replaced by Listen, which costs roughly 30% of contract ARR on top of existing plans. |
| Enterprise integrations: 70+ native integrations across CRM, BI, ITSM, and analytics tools, including Salesforce, HubSpot, Okta, and Jira. | Fragmented module structure: Analytics, Guides, Listen, Orchestrate, and Agent Analytics are separate surfaces with separate pricing. Understanding the full cost requires a detailed scoping conversation. |
The G2 reviews below reflect these patterns consistently:
“Because the tool is so robust, it is a full-time job for someone. It requires a lot of time and effort to take advantage of all the pages and features per product, and we found that we needed to leverage their professional services team for assistance in this regard. The pricing model could be cost prohibitive for some organizations, especially if their products receive lots of visitors or they require many application keys.” — Chris P., G2
“Editing guide templates can be frustrating due to the lengthy steps it takes to edit one. I’m also worried that they may be releasing too many AI features that will potentially lead to feature bloat and a declining user experience (also to mention increased pricing as a consideration here).” — Brittany N., G2
“We’ve been using Pendo for the last 6 years and I just love the overall product. It does everything it claims to do, and more. My favorite is the retroactive analytics. Forget to tag something? Tag it now and Pendo will go back to when the snippet was first added to the page.” — Verified user in computer science, G2
Pendo’s depth is real, and product teams that invest in it properly get significant value toward product success. Whether that investment (setup time, budget, and ongoing complexity) is the right trade-off depends on how much of that depth you’ll actually use.
Userpilot: A more transparent alternative for most teams
Pendo makes the most sense when you need enterprise-grade analytics depth, retroactive tracking, or Agent Analytics for AI features you’ve already shipped. But if the goal is to drive product adoption, improve user onboarding, and help product teams act on in-product behavior without the full complexity overhead, Userpilot is worth a direct comparison.
Like Pendo, Userpilot combines omnichannel engagement, product analytics, and user feedback. The difference is that we’ve built it to be usable without a dedicated platform admin. When we asked former Pendo customers why they switched:
- 82% said they found better in-app engagement features with Userpilot.
- 78% said cost was their primary challenge with Pendo.
- 64% found more value in Userpilot’s survey features than Pendo’s.
Shelterluv is a good example. They initially invested in Pendo to drive adoption, but the tool’s complexity became the bottleneck. Matthew, Senior Customer Solutions Manager at Shelterluv, put it plainly:
“One of the biggest feedback the team had about Pendo was like, we just don’t know how to use it. And it’s hard to figure out.”
After switching to Userpilot, they streamlined customer communication and significantly reduced the number of support tickets. The migration itself was faster than expected.
Cuvama had the same experience with configuration complexity. Leyre Iniguez, Customer Experience Lead at Cuvama, described it this way:
“Pendo was complicated to setup and maintain. With Pendo, I could not do, or at least I didn’t know how to easily do, specific flows for specific companies. Because Userpilot is easier to configure and to work with, I’m getting much more value than with Pendo.”
How much does Userpilot cost?
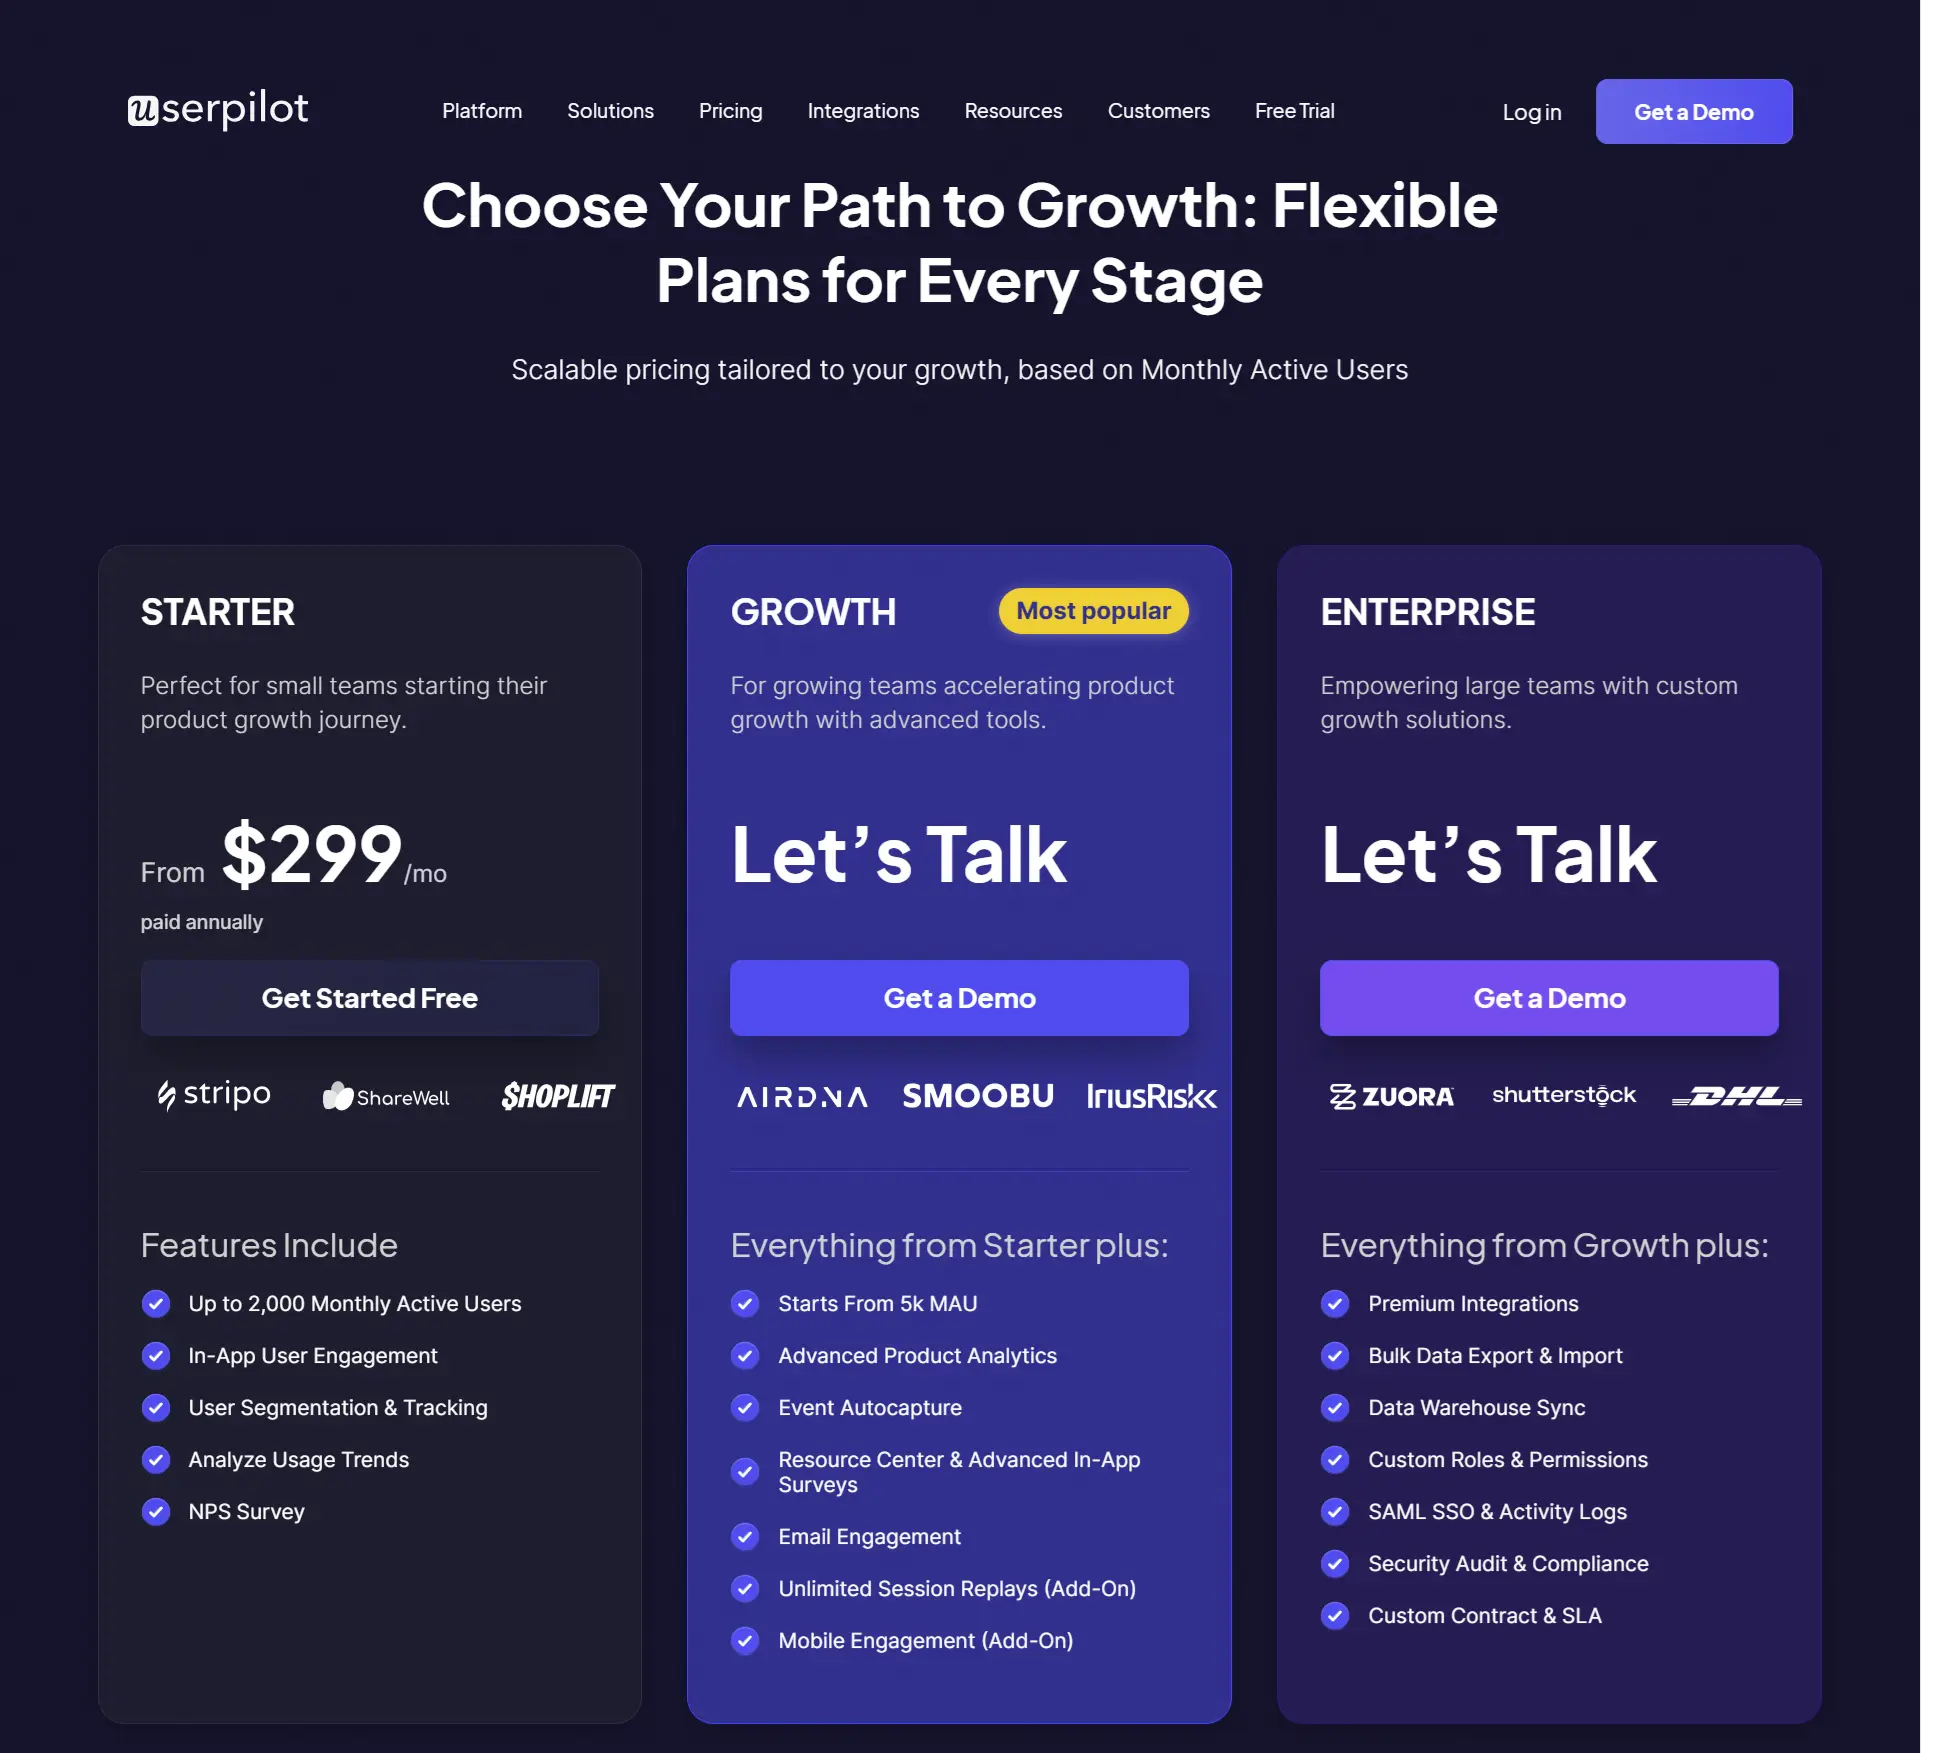
Userpilot’s pricing is tiered, public, and doesn’t require a sales call to understand:
- Starter: $299/month (billed annually) for up to 2,000 MAUs. Includes in-app engagement, segmentation, trend analysis, NPS surveys, and core product analytics. Best for small and mid-market SaaS teams.
- Growth: Custom pricing. Adds advanced analytics, event autocapture, resource centers, in-app surveys, email engagement, and session replay.
- Enterprise: All Growth features plus bulk data handling, premium integrations, SOC 2 Type 2 compliance, custom roles, and enterprise support.
Pendo vs. Userpilot: Product analytics
Both platforms offer autocapture, funnels, paths, custom dashboards, session replay, and retroactive event tracking. Beyond analytics, Pendo offers advanced segmentation capabilities to define user groups and segment users based on behavioral or account attributes. Pendo has the wider overall feature set, including heatmaps, clickmaps, AI-powered insights, and the Product Engagement Score, while Userpilot counters with a no-code setup, real-time data, and instant access to all custom properties as filters.
| Feature | Pendo | Userpilot |
|---|---|---|
| Trends, funnels, paths, retention | ✅ | ✅ |
| Retroactive event tracking | ✅ Retroactive analytics across all captured events | ✅ Retroactive events autocapture |
| Event tracking setup | ✅ Autocapture + Suggested Features auto-tagging | ✅ Autocapture; Visual Labeler for naming events; no snippet changes needed |
| Segmentation and filtering | ❌ Requires custom metadata via a snippet to segment users based on attributes; manual feature tagging and separate segment setup are needed | ✅ Instantly segment users based on any custom property or user group; no snippet changes or manual tagging needed |
| Heatmaps and clickmaps | ✅ | ❌ |
| AI-powered insights | ✅ | ❌ Coming soon |
| Product Engagement Score | ✅ Composite: adoption, stickiness, growth | ❌ No single composite PES; engagement tracked via Trends and Retention reports |
| Setup complexity | ❌ Steep learning curve; multiple modules | ✅ No-code; minimal training required |
| Session replay | ✅ Notes, comments, Jira flagging; complex initial setup | ✅ Notes, comments, built-in filtering; no Jira integration |
| Agent Analytics | ✅ Dedicated GA module (separate pricing) | ✅ Available |
Pendo vs. Userpilot: User feedback
Userpilot offers integrated survey tools to gather user and customer feedback, with over 30 pre-built templates, branching logic, and survey analytics that link responses directly to in-app behavior. You can see exactly what a user did in your product before filling out a survey, with no additional modules or manual exports required.
With Pendo, the polls embedded in Guides (two templates, no advanced branching) remain available, but the full feedback suite (sentiment analysis, theme detection, roadmapping, idea validation) has moved to Listen and requires a separate purchase. Survey responses require manual export unless you’re on Listen.
| Feature | Pendo | Userpilot |
|---|---|---|
| NPS | ❌ Only on Core and Ultimate plans, or as an add-on; Free plan NPS is Pendo-branded | ✅ Unlimited NPS on Starter plan |
| Polls and surveys | ❌ Polls embedded in Guides only; 2 templates | ✅ Dedicated survey modal; 30+ pre-built templates |
| Sentiment and roadmap | ✅ Via Listen: theme detection, idea validation, roadmap, at ~30% of contract ARR | ❌ Promoter/passive grouping only; no roadmap |
| Survey analytics | ❌ Requires Listen; otherwise manual export | ✅ Built-in: responses linked to clicks, hovers, and form submissions automatically |
Pendo vs. Userpilot: User engagement
Both platforms support modals, banners, interactive walkthroughs, and slideouts. Userpilot adds hotspots, unlimited customizable checklists, and branched flows with if-then logic, all available without add-ons.
Userpilot’s resource center supports inline video playback, full search across in-app content and external knowledge bases, and search term analytics. It also includes push notifications on mobile devices and automatic translation for right-to-left languages such as Arabic and Hebrew.
Pendo has a meaningful edge in AI-assisted guide creation: AI-generated guides from a prompt are more developed in Pendo than in Userpilot, where only a basic AI writing assistant is available today. Pendo Guides also supports RTL layouts, though RTL localization is not currently supported in Guides.
| Feature | Pendo | Userpilot |
|---|---|---|
| Guide types | ✅ Modals, banners, polls, walkthroughs, slideouts, badges ❌ No hotspots ❌ Standalone checklists only in Guides Pro (Ultimate or add-on) |
✅ Modals, banners, polls, walkthroughs, slideouts, badges ✅ Hotspots ✅ Unlimited customizable checklists |
| Resource center | ❌ Limited video support ❌ No general search ❌ No search term analytics ❌ One RC per plan unless Ultimate |
✅ Inline video ✅ Searches RC and external knowledge bases ✅ Search term analytics ✅ Unlimited RC from Growth plan |
| Branching and targeting | ❌ Conditional branching requires Guides Pro | ✅ Native branched flows with if-then logic; no add-on needed |
| Localization | ⚠️ RTL layouts supported; RTL language localization not supported in Guides | ✅ Automatic translation including RTL (Arabic, Hebrew) |
| AI guide creation | ✅ AI generation from prompt, start URL, and tone (beta) | ❌ Basic AI writing assistant only |
| Cross-channel (email + in-app) | ✅ Via Orchestrate (separate product) | ✅ Included in Growth plan |
| Mobile push notifications | ✅ Available | ✅ Available |
Get more value with Userpilot!
Pendo is a capable platform, but its pricing and bundled approach can make it difficult to justify if you’re only looking for a few core capabilities.
If you want to improve product adoption, create personalized in-app experiences, collect user feedback, and analyze product usage—all without paying for features you don’t need, Userpilot is a strong alternative.
Ready to see how Userpilot compares? Book a demo and discover how you can deliver better product experiences for less.
Disclaimer: Userpilot strives to provide accurate information to help businesses determine the best solution for their particular needs. Due to the dynamic nature of the industry, the features offered by Userpilot and others often change over time. The statements made in this article are accurate to the best of Userpilot’s knowledge as of its publication/most recent update on June 29, 2026.
FAQ
What does Pendo do?
Pendo is a product experience platform and product analytics app that helps companies understand user interactions with their software, collect customer feedback, and guide users with in-app messaging. The Pendo app also tracks how users interact with embedded AI agents via Agent Analytics.
Is Pendo like Google Analytics?
Both track user behavior, but they’re built for different purposes. Google Analytics focuses on website traffic, marketing metrics, and acquisition.
Pendo tracks behavior inside web and mobile applications and adds in-app guidance, feedback collection, and AI agent tracking on top, making it a product management tool rather than a marketing analytics platform. A more useful comparison is how Pendo stacks up against purpose-built product analytics tools.
Do I need a developer to use Pendo?
Initial setup requires a developer to install Pendo’s JavaScript snippet (web) or SDK (mobile). After that, most day-to-day work (creating guides, building segments, launching surveys) is no-code. Custom event tagging and passing user metadata for segmentation may still need developer support depending on your product architecture.
What is Pendo Agent Analytics?
Agent Analytics tracks how users interact with embedded AI agents inside your product: prompts sent, task completion rates, failure signals, and conversation logs. It reached general availability in 2025 and is priced as a separate module and is not included in any standard Pendo plan.
About the author