Pendo Pricing in 2026: Hidden Costs and When To Look Elsewhere


The last time I helped a team evaluate Pendo, the first question after the demo was, “What does this cost?” This question is largely because every paid tier on Pendo’s pricing page says “custom pricing.”
Pendo is a software experience management platform that tracks, guides, and improves user experiences across customer-facing products, internal tools, and AI agents. It lists four tiers: Free, Base, Core, and Ultimate. Public procurement datasets suggest Pendo often lands in five-figure annual contracts.
Vendr reports a median of $49,015 across 564 purchases, while SpendHound reports an average annual spend of $54,757 for SMB customers and $214,512 for enterprise customers.
In this article, I’ll break down what each tier includes, where costs accumulate beyond the subscription line, how negotiation typically plays out, and when pricing no longer makes sense for your stage.

How much does Pendo cost, and what do you get?
As a product analytics platform, Pendo’s pricing tiers scale with monthly active users (MAUs). As volume increases, the per-MAU rate drops, but every paid plan is quoted on a custom basis, and there’s no self-serve checkout. The tier you choose determines which functionality you can access, and several features most buyers expect as standard are either add-ons or require upgrading to a higher tier.
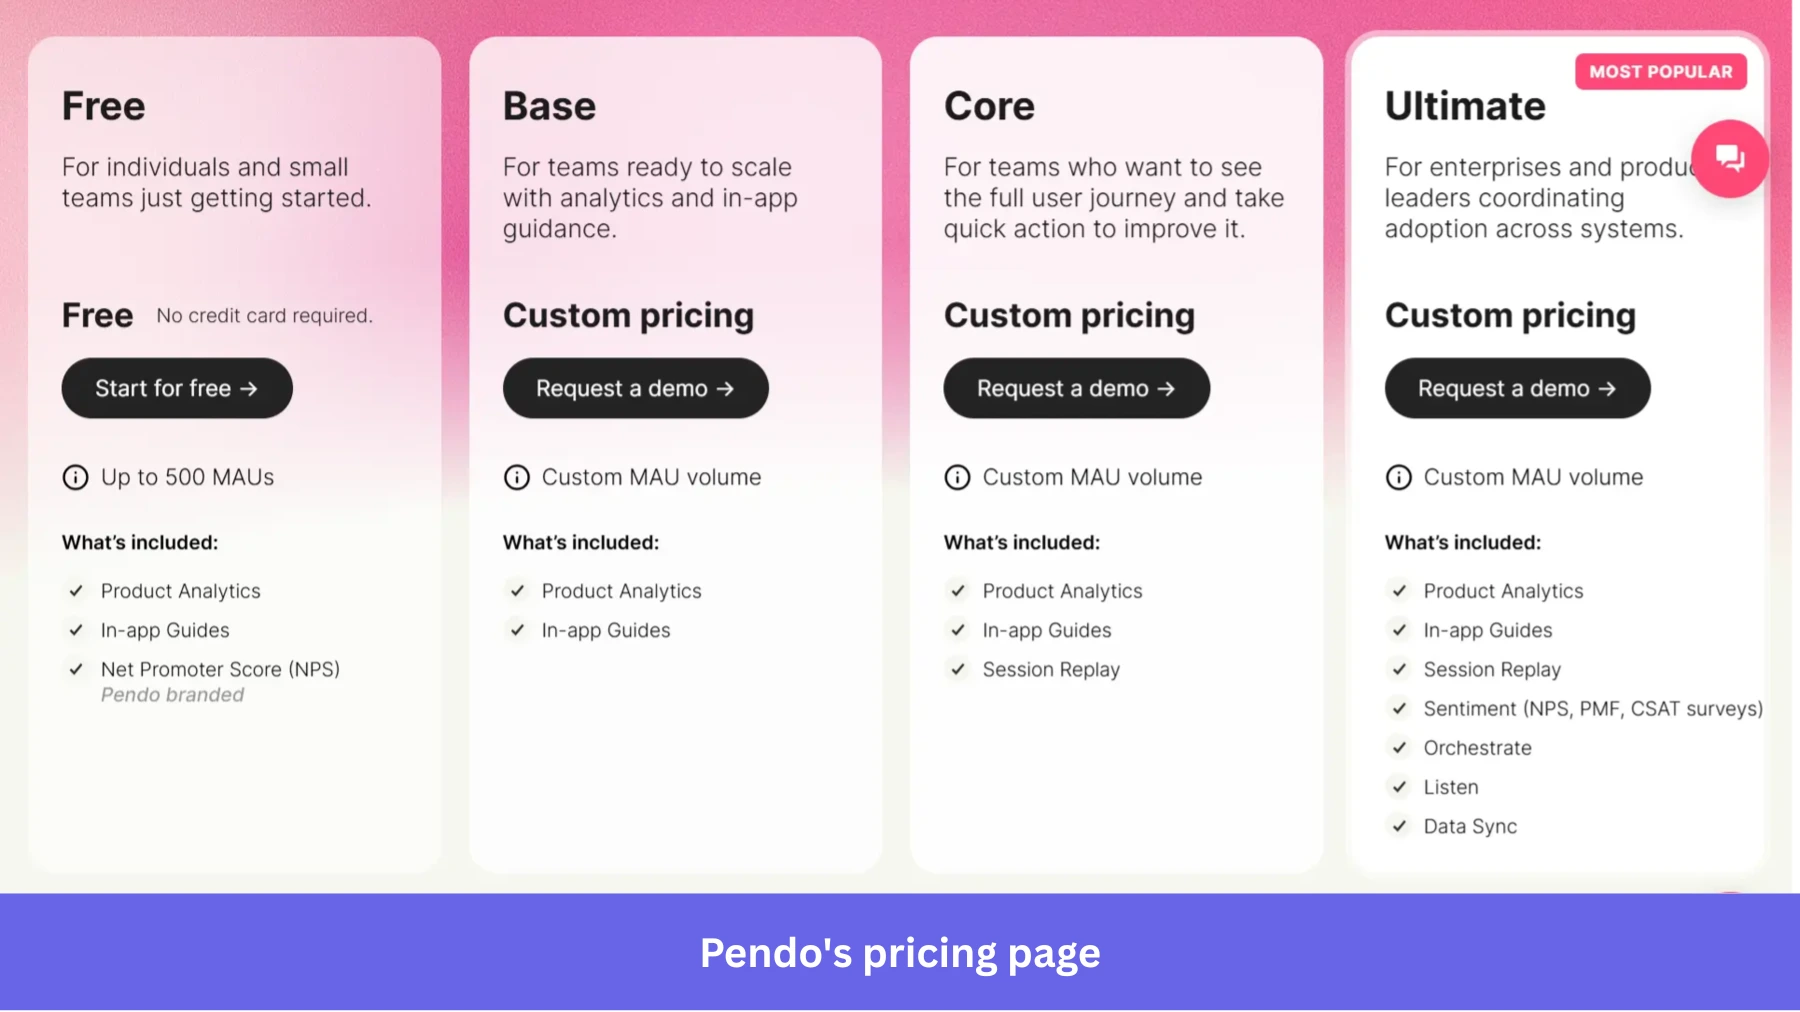
Pendo Free
The free plan supports up to 500 MAUs and includes basic product analytics, in-app guidance, and Pendo-branded NPS surveys. There are no third-party integrations at this tier, and the MAU cap limits user onboarding flows. It serves as a proof of concept, but you can quickly hit the 500 MAU ceiling, making it unsuitable for operational use.
Pendo Base
Base is the first paid Pendo plan, offering behavioral analytics and in-app guidance to track user behavior and feature adoption at a custom MAU volume. Session replay and NPS surveys are both separate add-ons here, meaning two of the most-evaluated user engagement tools in this category each carry their own line item. For comparison, Userpilot’s Starter plan at $299/month includes NPS and checklists at up to 2,000 MAUs, with no add-ons required.
Add-on pricing at Base can run well above what the plan rate implies.
I did a bit of digging on Reddit to see what customers were paying, and some of the numbers were eye-opening. One older r/SaaS thread mentions being quoted $30,000 per year just for webhook access. In another r/ProductManagement discussion, a user said they were paying $2,000 per quarter for 2,000 MAUs. While these are individual experiences rather than official pricing, they show that the total cost can look very different from what the plan name alone suggests.
Pendo Core
Core adds Session Replay and more advanced analytics to track feature adoption and understand how users interact with your product. Sentiment/NPS, discovery/listening workflows, and journey orchestration require Ultimate or paid add-on packaging, depending on your contract. Session replay is now a baseline expectation for teams evaluating this category, so requiring a step beyond Base to access it is worth factoring into your budget model from the start rather than discovering it mid-evaluation.
Pendo Ultimate
Ultimate is Pendo’s enterprise plan and its most complete tier: advanced analytics, in-app guidance, session replay, NPS, and CSAT surveys for customer feedback collection, journey orchestration, Pendo Listen, and Data Sync. On Vendr, deals at this tier run $75,000 to $150,124.
Ultimate is positioned for enterprises and product leaders coordinating adoption across systems. It is usually a better fit for multi-product or more complex organizations (teams that need premium features and data synchronization across several products) than single-product mid-market teams.
Pendo AI add-ons
Pendo now lists AI capabilities, including two add-ons that layer on top of any paid plan. Pendo Predict models churn risk and integrates with CRM and BI tools. Agent Analytics monitors how AI agents and users interact with your product, covering adoption, usage patterns, and failure signals.
Predict is sold through custom pricing. Agent Analytics is free to get started, with paid capacity available as usage grows. The free allowance covers up to 500 prompts per month per subscription; after 500 prompts/month, free accounts stop collecting new prompt events for the rest of the month. Leo, Pendo’s natural-language query assistant for product data, is included at no additional cost on all plans, including Free.
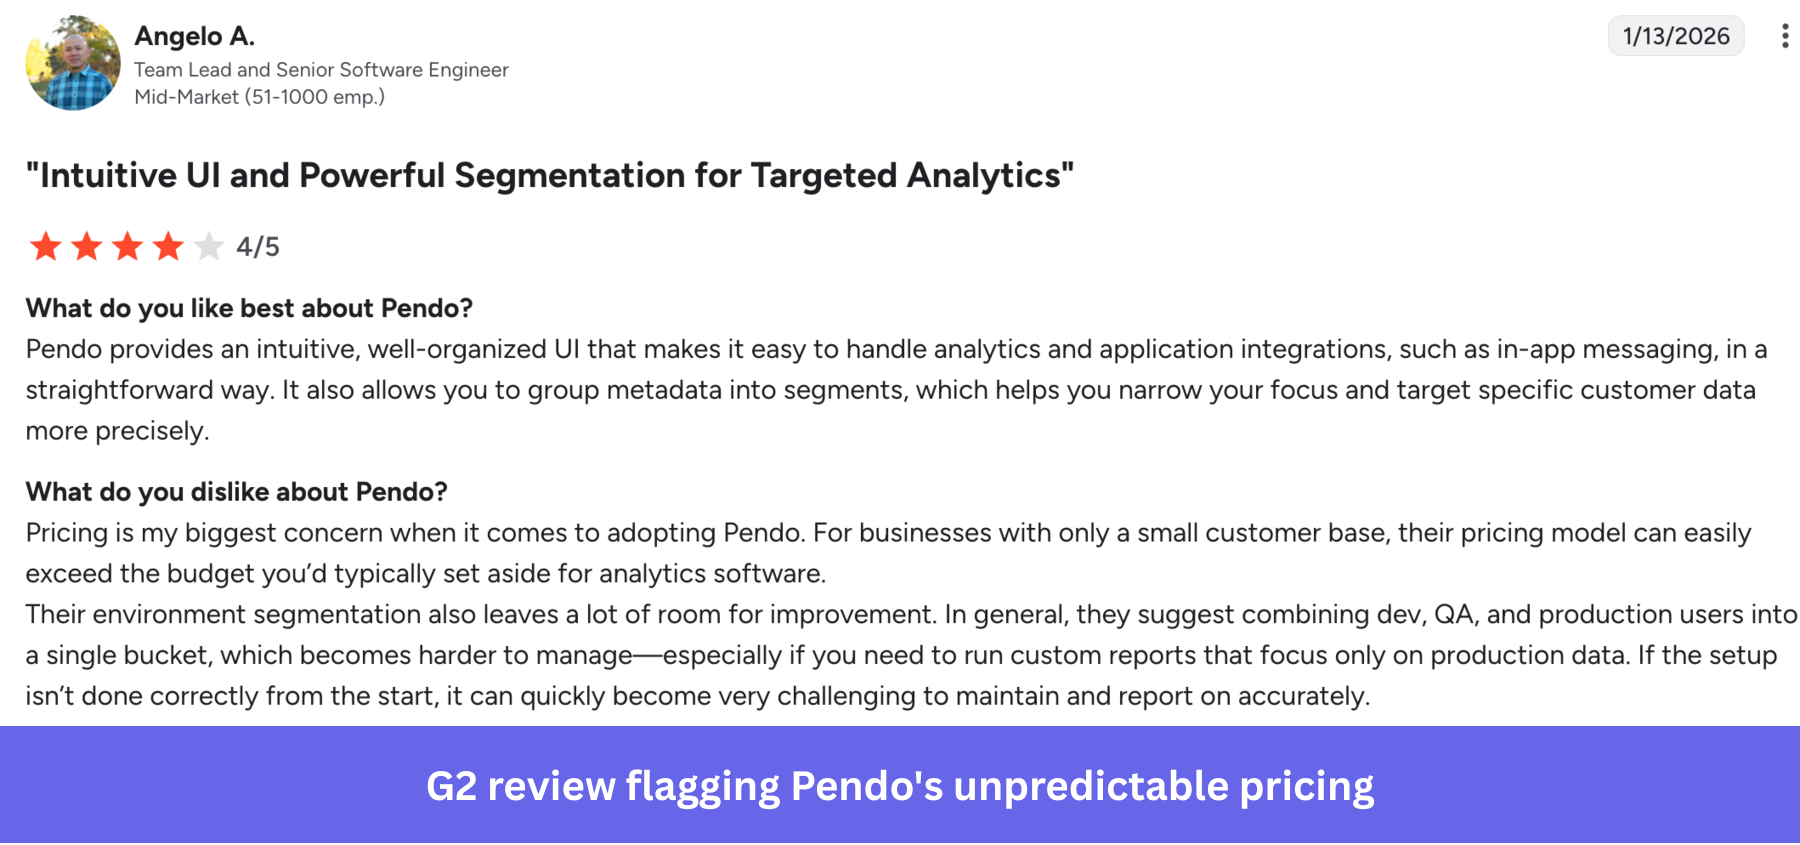
The hidden costs buyers often miss
The subscription quote is only one part of the cost model. Implementation, internal admin work, add-ons, MAU growth, and support needs can change the real first-year and renewal cost. This G2 reviewer described the gap:
Implementation and user onboarding services
These run $5,000 to $25,000 for typical deployments. Larger enterprise implementations can exceed that amount, depending on scope. Budget for internal engineering time alongside any professional services quote.
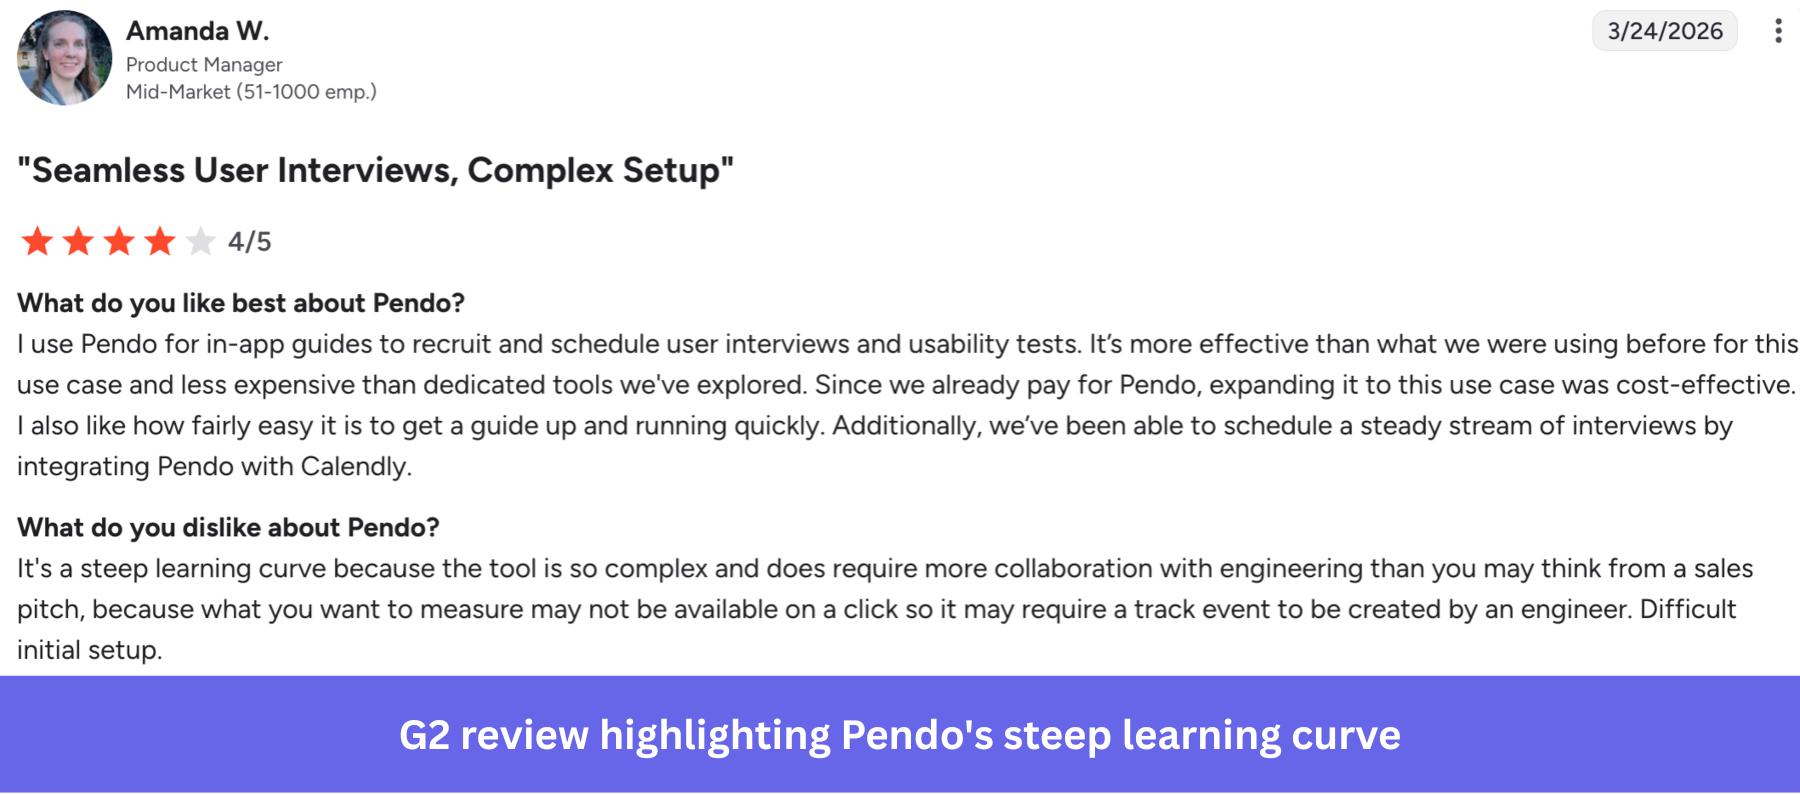
The setup requires more collaboration with engineering than the sales pitch typically implies, and one G2 reviewer who went through a recent deployment described the curve directly:
“It’s a steep learning curve because the tool is so complex and does require more collaboration with engineering than you may think from a sales pitch.”
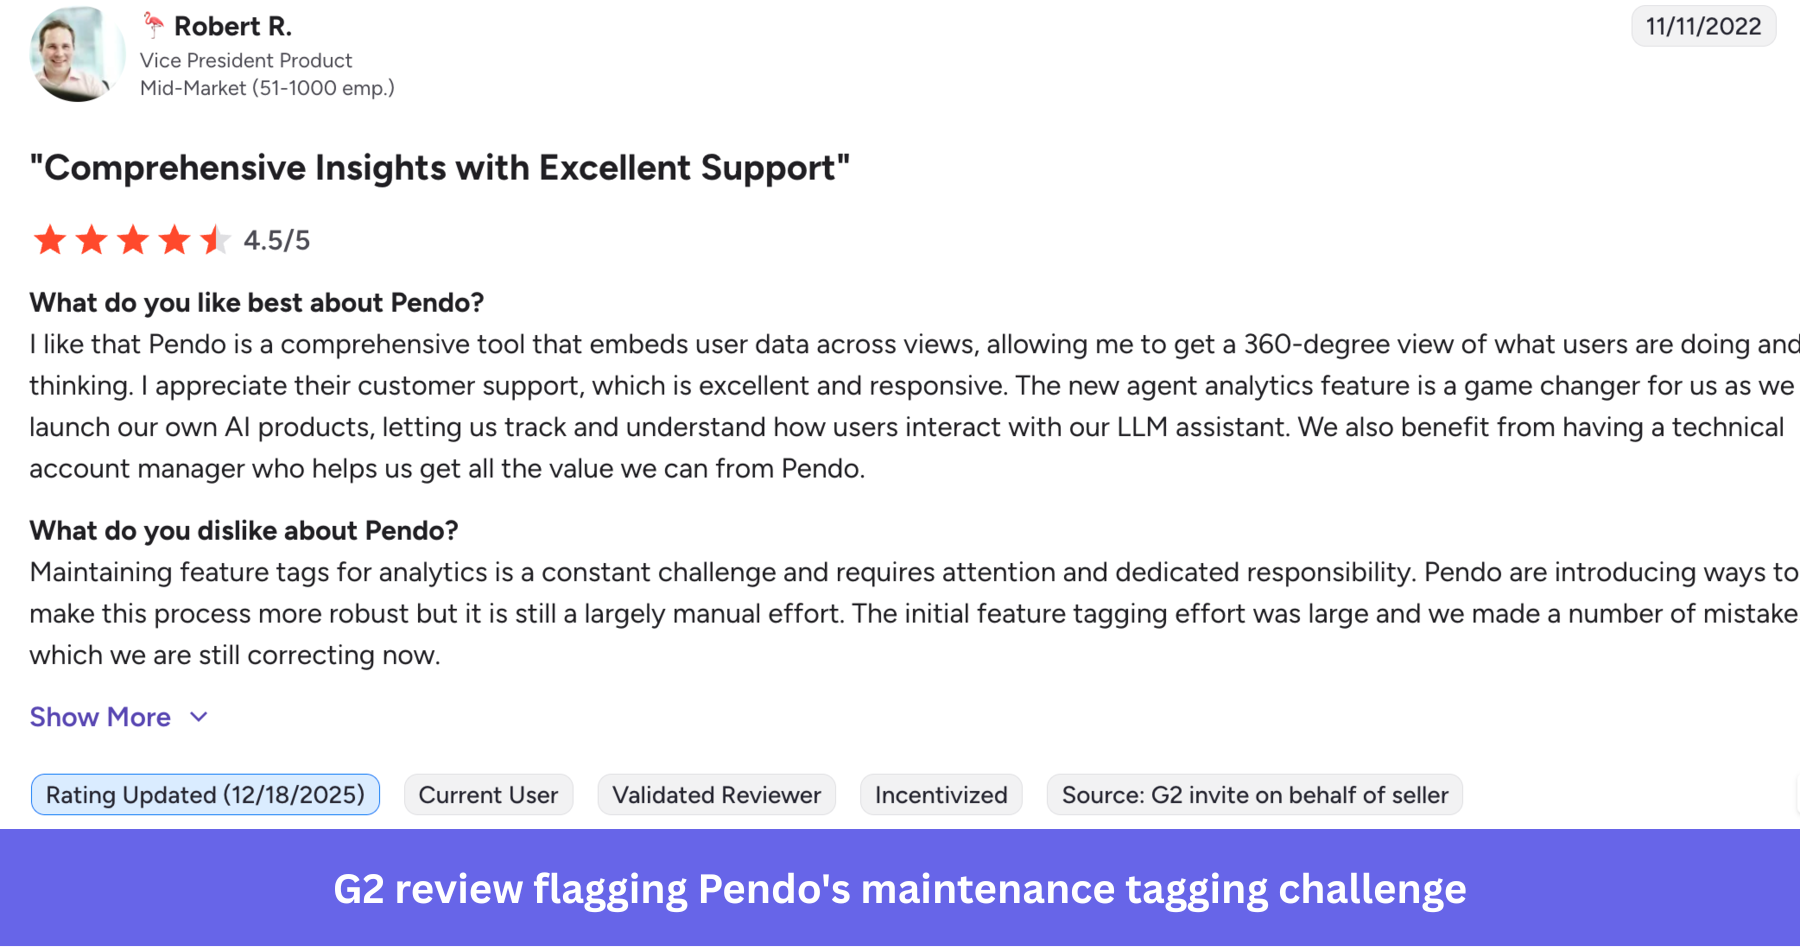
Ongoing tagging maintenance
This cost doesn’t end at deployment. Feature tags need to stay current as your product evolves, and another G2 reviewer described this as “a largely manual effort” requiring “dedicated responsibility” over time. Your analytics accuracy is only as reliable as the tagging underneath it, and that tagging doesn’t maintain itself.
Add-on modules
Some modules and advanced capabilities are packaged as paid add-ons or contract-specific features, each with its own implementation overhead not included in the original onboarding work. Pendo Listen is included in Ultimate, but feedback and discovery capabilities may require an add-on or contract update on lower or legacy plans.
MAU overage
While MAU isn’t a simple hard cutoff, it can still affect both reporting and your contract. Pendo’s paid-plan customers who exceed their MAU limit won’t see core functionality interrupted, and an account representative will reach out to determine whether the increase reflects expected growth or a configuration issue.
Pendo’s MAU-limit documentation also says that when a subscription exceeds its MAU threshold, report and dashboard data may shift to generalized trends based on a daily random sample equal to the MAU threshold. In other words, you should model MAU growth before signing because overage can become both a reporting limitation and a commercial conversation.
Annual renewal risk
You can be exposed to this risk if your plan, MAU tier, or startup-like package changes at renewal. One r/UXDesign user said Pendo was discontinuing their roughly $7,000/year starter plan and requiring a move to a $35,000+ tier. Locking in a 3 to 5% annual escalation cap at signing is worth the negotiation effort and is much harder to get at renewal than at the initial close.
Premium support
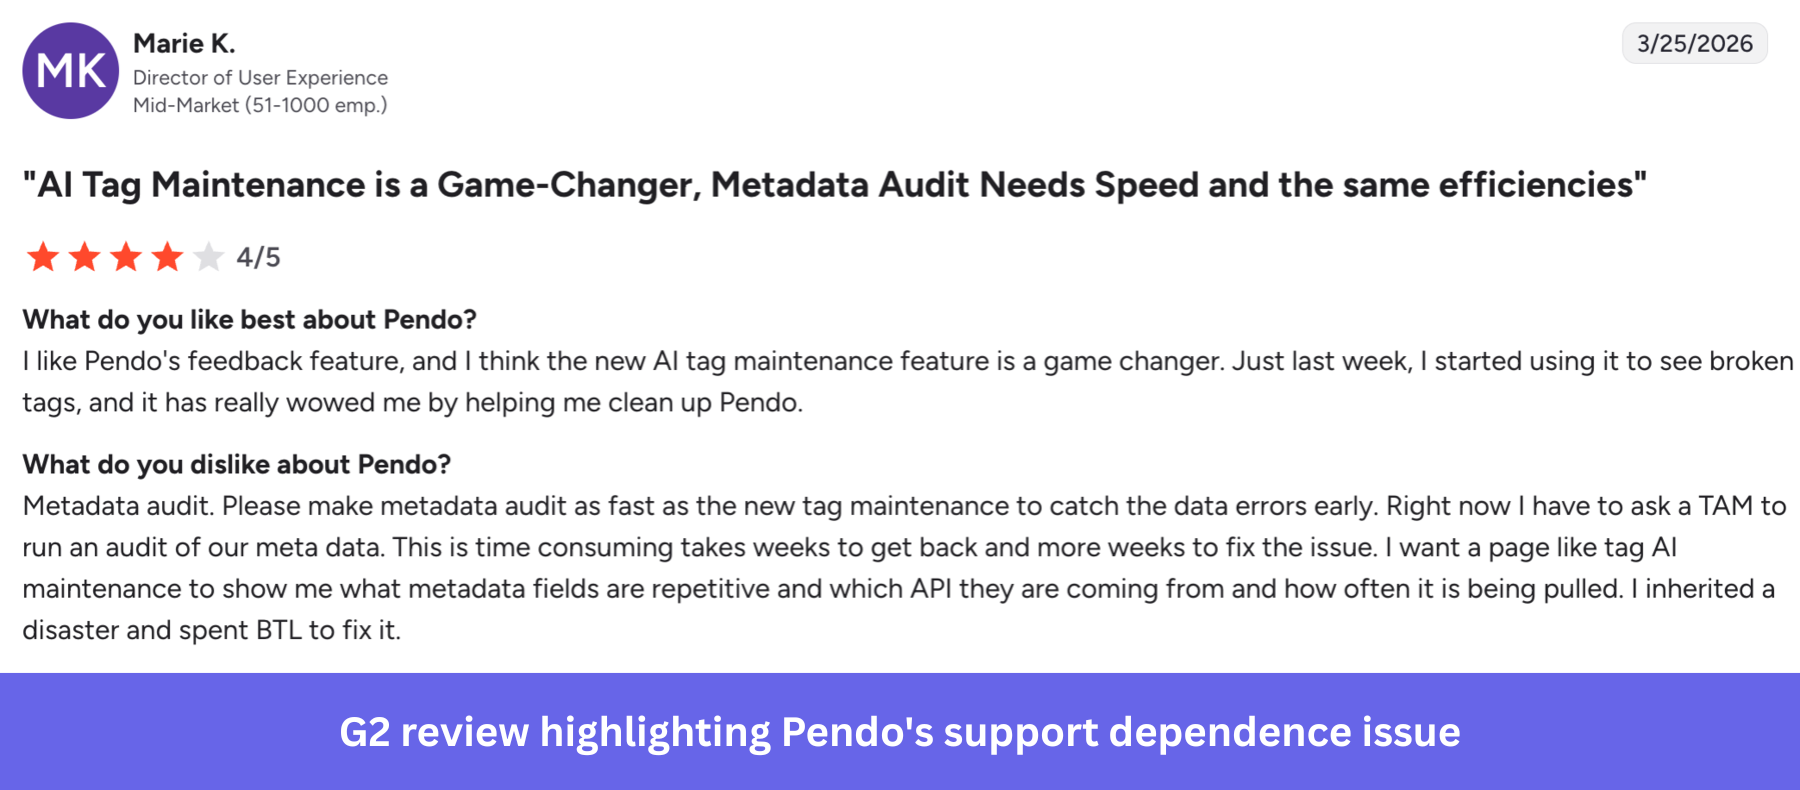
Standard online support is included, while premium support and customer success options add named technical resources, live chat, priority support, and stronger SLAs. This G2 reviewer described what that dependency looks like in practice:
“Right now I have to ask a TAM to run an audit of our metadata. This is time consuming, takes weeks to get back, and more weeks to fix the issue.”
Is Pendo pricing negotiable?
Yes, Pendo pricing is negotiable, but the strongest public benchmark is Vendr’s 12% average savings across 564 purchases. Anything beyond it depends on your MAU volume, feature bundle, contract length, renewal timing, and competitive alternatives.
When you engage Pendo’s sales team, multi-year terms, competing quotes, package scope, and renewal caps are the main levers to bring into the conversation. The goal is to reduce your year-one price and control what happens in year two: MAU growth, add-ons, support needs, and renewal increases can all change the real cost after the initial contract. Ask whether annual prepayment changes the quote, but don’t assume a discount unless it is written into the proposal.
Ask Pendo to clarify four things before signing:
- Are premium support or named technical resources included?
- What happens when you exceed your MAU band?
- Which features are paid add-ons?
- Are renewal increases capped?
If you are a startup or early-stage team, ask whether any startup packaging is available, but don’t assume public eligibility or pricing until Pendo confirms it.
Is Pendo really worth its expensive price tag?
Pendo enables teams to access product data history from the day Pendo is installed, so you can tag and analyze user behavior after the fact without pre-instrumentation.
That retroactive approach is one of Pendo’s clearest advantages for teams that want to track feature adoption and understand how users interact with their product without writing instrumentation code upfront. This can be useful if you work on complex web or mobile apps, especially when you don’t want to pre-instrument every event.
At the Ultimate tier, the scope is obvious for the organizations it was designed around. Multi-product enterprise teams get advanced analytics, in-app guidance, session replay, NPS, customer feedback collection, and journey orchestration on a single platform to support product growth initiatives. Leo, Pendo’s natural-language query assistant, is included on all plans and gives non-technical stakeholders a way to pull product insights without building reports from scratch.
The interface isn’t always intuitive across all modules, which is where day-to-day friction tends to surface. One r/UXResearch user described having to leave Replays to export data that should be accessible in the same view:
“I need to go to Paths or Visitors to export from there. I’m already on Replays. Why can’t I do it?”
Some users report data accuracy and reporting inconsistencies, particularly around visit numbers and difficulty pulling clean reports in a single view. If survey exports are part of your workflow, confirm which export options are available on your plan before signing. Every paid tier requires a sales conversation before you can compare options, with no self-serve checkout and no transparent pricing to model costs before committing to the sales cycle.
Get Userpilot for better value!
Pendo can absolutely make sense for large enterprises managing multiple products, employee-facing software, and complex customer journeys. But for many SaaS teams, it’s simply more platform than they need and more expensive than they’re willing to pay for.
That’s exactly why we’ve helped companies like Cuvama and Shelterluv make the switch to Userpilot.
For Cuvama, the biggest issue wasn’t functionality—it was paying for functionality they weren’t using. As Customer Experience Lead, Leyre Iniguez put it:
“High price was one of the decision criteria to move from Pendo because we were paying lots, and we were not using it.”
Shelterluv was looking for a platform that was easier to manage day to day. After switching, Senior Customer Solutions Manager Matthew Brown shared:
“In support and onboarding, Userpilot has been a time saver and has reduced the workload of a lot of the agents.”
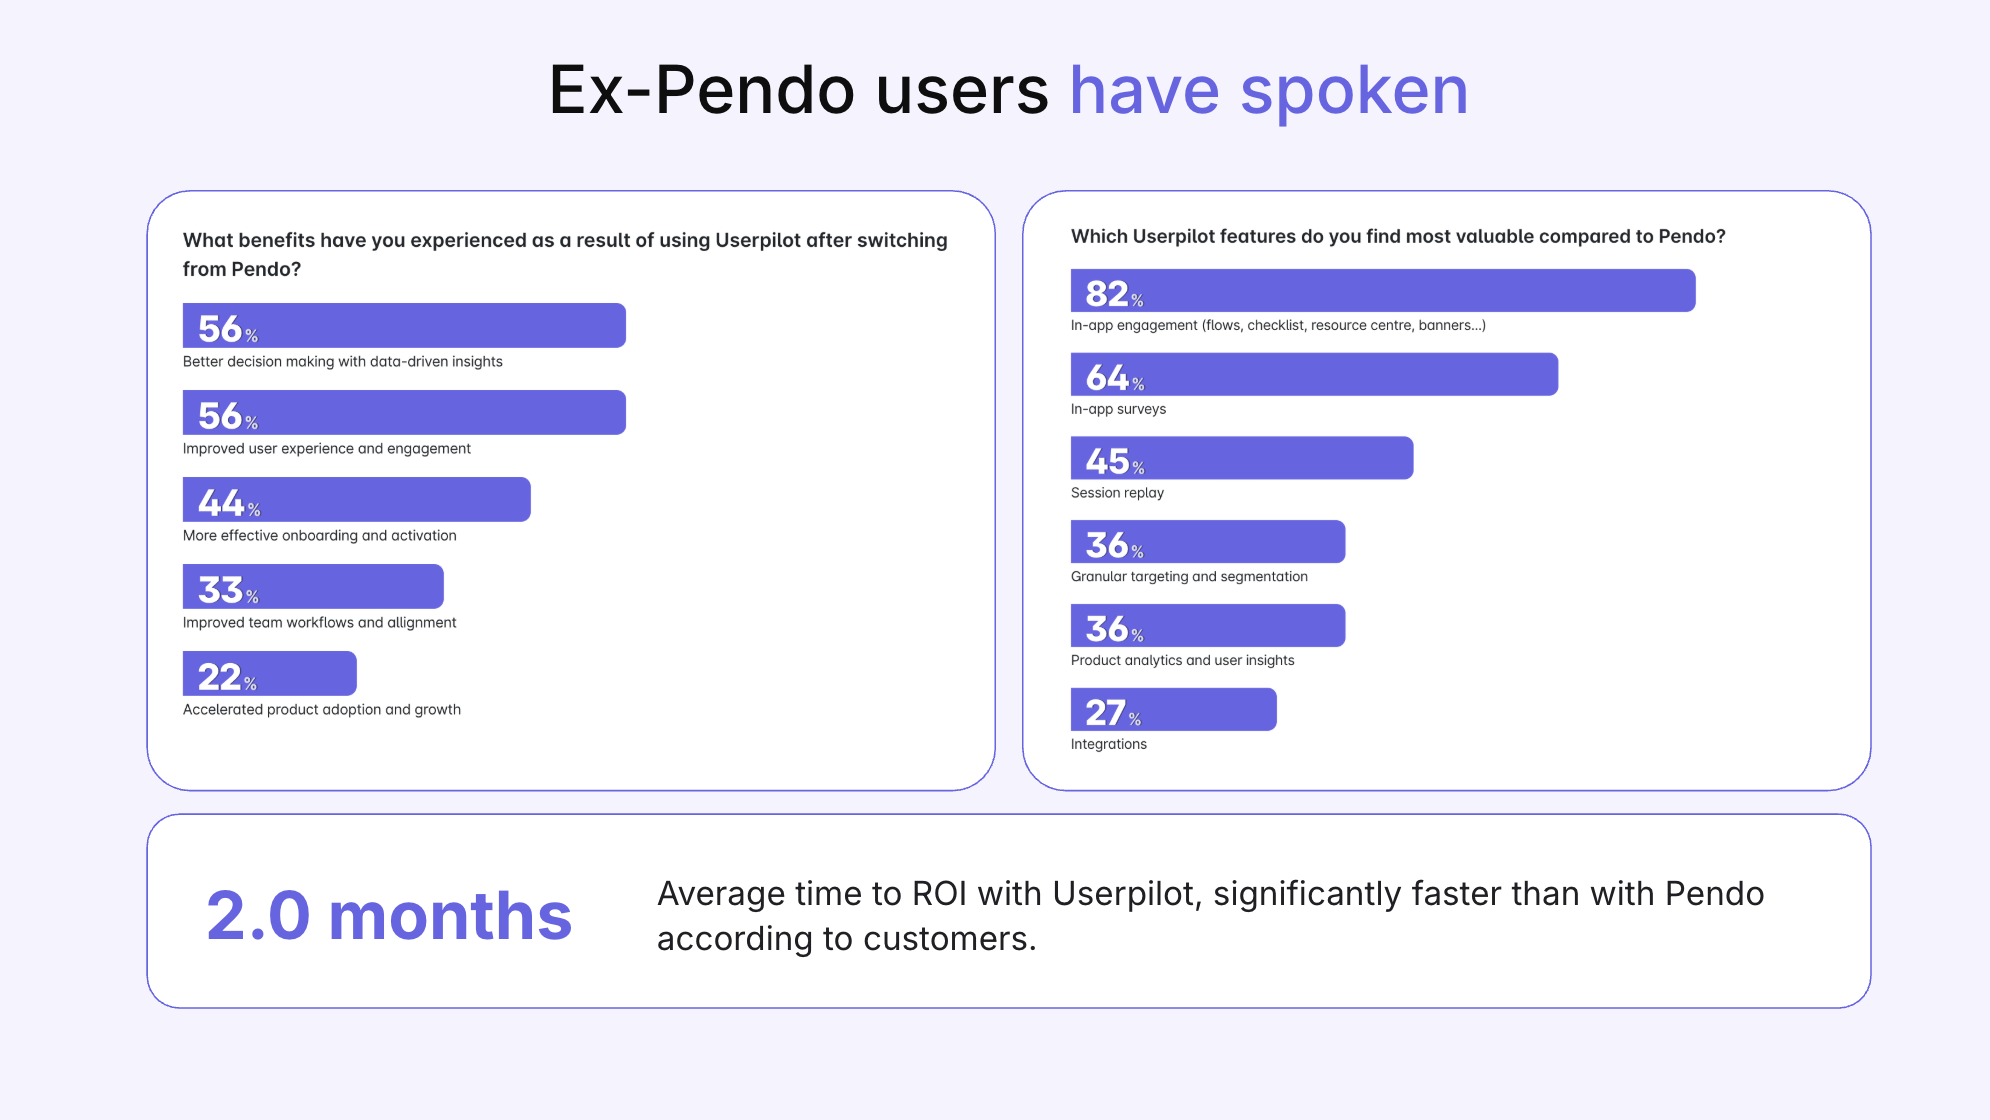
Those stories aren’t outliers. We recently surveyed customers who switched from Pendo, and the feedback was remarkably consistent. The most common reasons they preferred Userpilot were our easier in-app engagement builder (82%), built-in surveys (64%), session replay (45%), granular targeting (36%), and product analytics (36%).
More than half also reported better user engagement and data-driven decision-making after making the switch, and customers reached ROI in an average of just 2 months. (Just book a demo and you’ll see!)
We built Userpilot to give product teams everything they need in one platform without forcing them into expensive add-ons. Our Growth plan includes product analytics, in-app guidance, surveys, segmentation, and up to 100,000 emails per month out of the box.
We also include free migration support, transparent pricing starting at $299/month (billed annually for up to 2,000 MAUs), and an intuitive no-code builder that’s easy for product teams to own without relying on engineering.
If you’re already locked into a Pendo contract, we can also help make the transition easier through our contract buyout program.
Disclaimer: Userpilot strives to provide accurate information to help businesses determine the best solution for their particular needs. Due to the dynamic nature of the industry, the features offered by Userpilot and others often change over time. The statements made in this article are accurate to the best of Userpilot’s knowledge as of its publication/most recent update on June 29, 2026.
About the author