
Product usage data plays a critical role in your organization’s growth.
Understanding how customers are using your software is key to designing a better product that meets their needs.
Access to this type of data can help you to locate bugs and friction in your app, enhance user experience, and retain more customers.
In this article, we’ll cover the product usage metrics you need to track, ways to capture this data, and make use of it.
Try Userpilot Now
See Why 1,000+ Teams Choose Userpilot

What is product usage data?
Product usage data reflects how customers use your software over a given period of time.
It captures the following:
- Personal data: the basic demographic details of a user including their age, location, company, role, etc.
- Engagement data: this tracks how users engage with the product and service team in general.
- Behavioral data: this captures the user’s in-app behavior including their interaction with features at different stages of the customer journey.
Why is analyzing product usage important?
A major benefit of tracking product usage is that it eliminates guesswork and allows you to make better, data-informed decisions. Making data-driven product decisions can lead to:
Improve engagement and enhance customer experience
Analyzing product usage data helps organizations determine which aspects of a product are most engaging to different segments of their audience. Armed with this information, you can better understand how to personalize and enhance the user experience.
Perhaps your users interact with your product more during certain seasons or times of the day. Knowing this, you can refine your sales, marketing, and product strategies to
better engage your customers.
Drive more conversions
By analyzing how free users interact with your platform, understanding when they typically need more advanced features, and which paid features appeal most to them, you can leverage initiatives that increase conversions.
For example, once you identify which areas of your product deliver the most value to your paid users, you can give your free trial and freemium users access to those premium features for a limited time. When they experience the added value of paid features firsthand, they will be more convinced to upgrade.
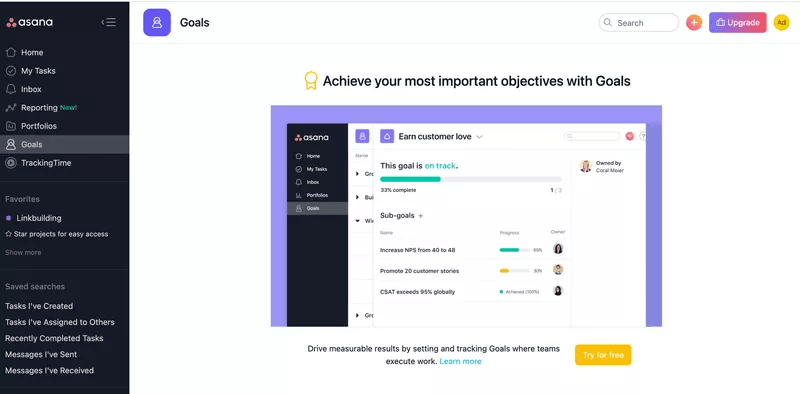
Exposing freemium users to premium features is called a reverse trial. This is a notorious method many product-led companies, including Asana use.
Prevent user churn
Product usage data can help you identify issues requiring immediate attention across all customer journey touchpoints. For example, low feature engagement rates can indicate bugs or usability issues that can cause churn if not resolved on time.
What are some important product usage metrics to track?
Chasing the wrong metrics is a common pitfall that can lead to flawed user behavior analysis. So let’s have a look at some product usage metrics that do matter.
Time-to-value
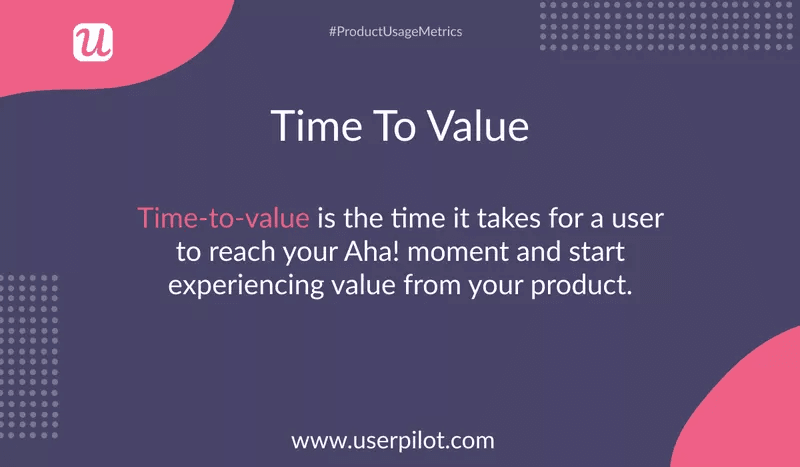
This is the amount of time it takes a user to realize the value of your product.
It’s like the eureka moment when the benefits of your products get unraveled, leaving your users inspired and willing to stay around to discover more.
Your goal should be to decrease time-to-value as much as you can, otherwise, you risk losing your users to churn.
Product activation rate
The product activation rate determines how many users that began a trial reached the activation milestone.
In other words, user activation measures the percentage of your users who performed a valuable action and experienced the perceived value of your product.
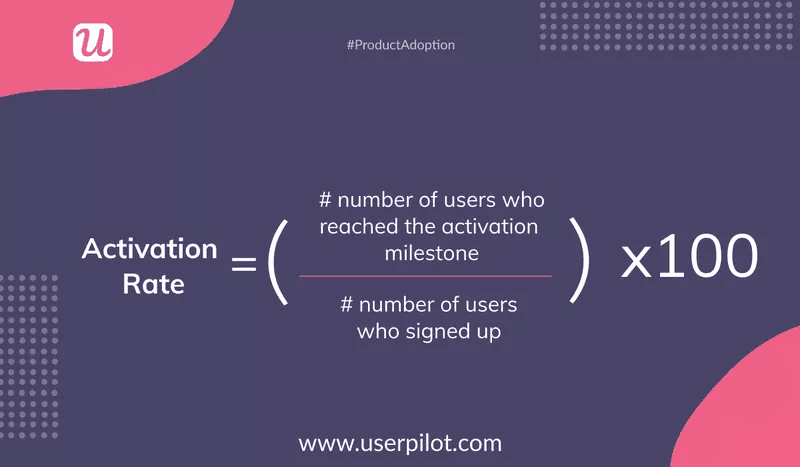
Calculating your activation rate is easy; first, you divide the number of users who hit the activation milestone by the total number of users who signed up to use your product.
Then, you multiply the figure by 100 to get the overall percentage.
Usage frequency
A product’s usage frequency indicates how often an individual uses it. A quick glance at this metric will allow you to determine whether users are using your product daily, weekly, monthly, or beyond the necessity.
To calculate usage frequency, simply set the desired time period and count the number of times a user engages with your app.
Feature usage rate
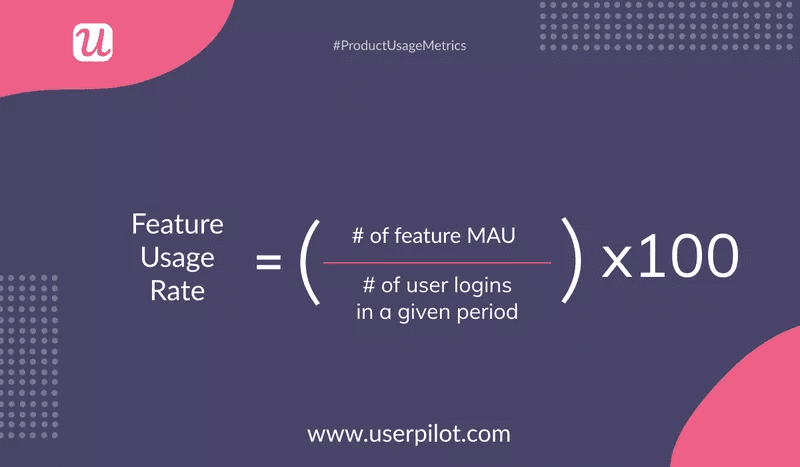
Besides user frequency, you can drill down into the interaction users have with a particular product feature. This is known as the “feature user rate“ and can give you an idea of the most popular or relevant feature you offer.
Here’s the formula for calculating it:
Time spent in-product
Another important user metric is time spent on the product. It means the duration of use of your product. While this bears many similarities to usage frequency, they’re quite different.
Where usage frequency tells you how often, the time spent on the product tells you how long.
Ideally, your users should spend significant time with your product.
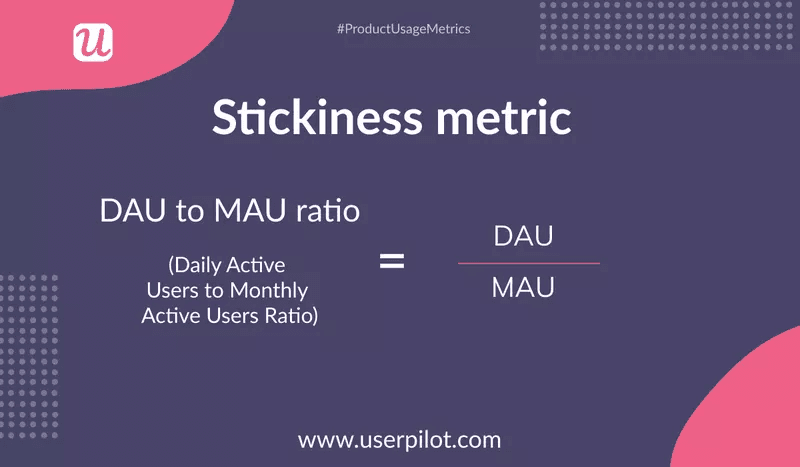
Product stickiness
Product stickiness measures the number of people that are highly engaged with a product.
A high stickiness rate shows that the product is adopted, and loved by its users.
It ensures that your product meets customer expectations, has become part of their daily lives, and somewhat guarantees that they will renew their subscriptions regularly.
How can you collect product usage data in SaaS?
Here are some of the tested methods of collecting product usage data in SaaS:
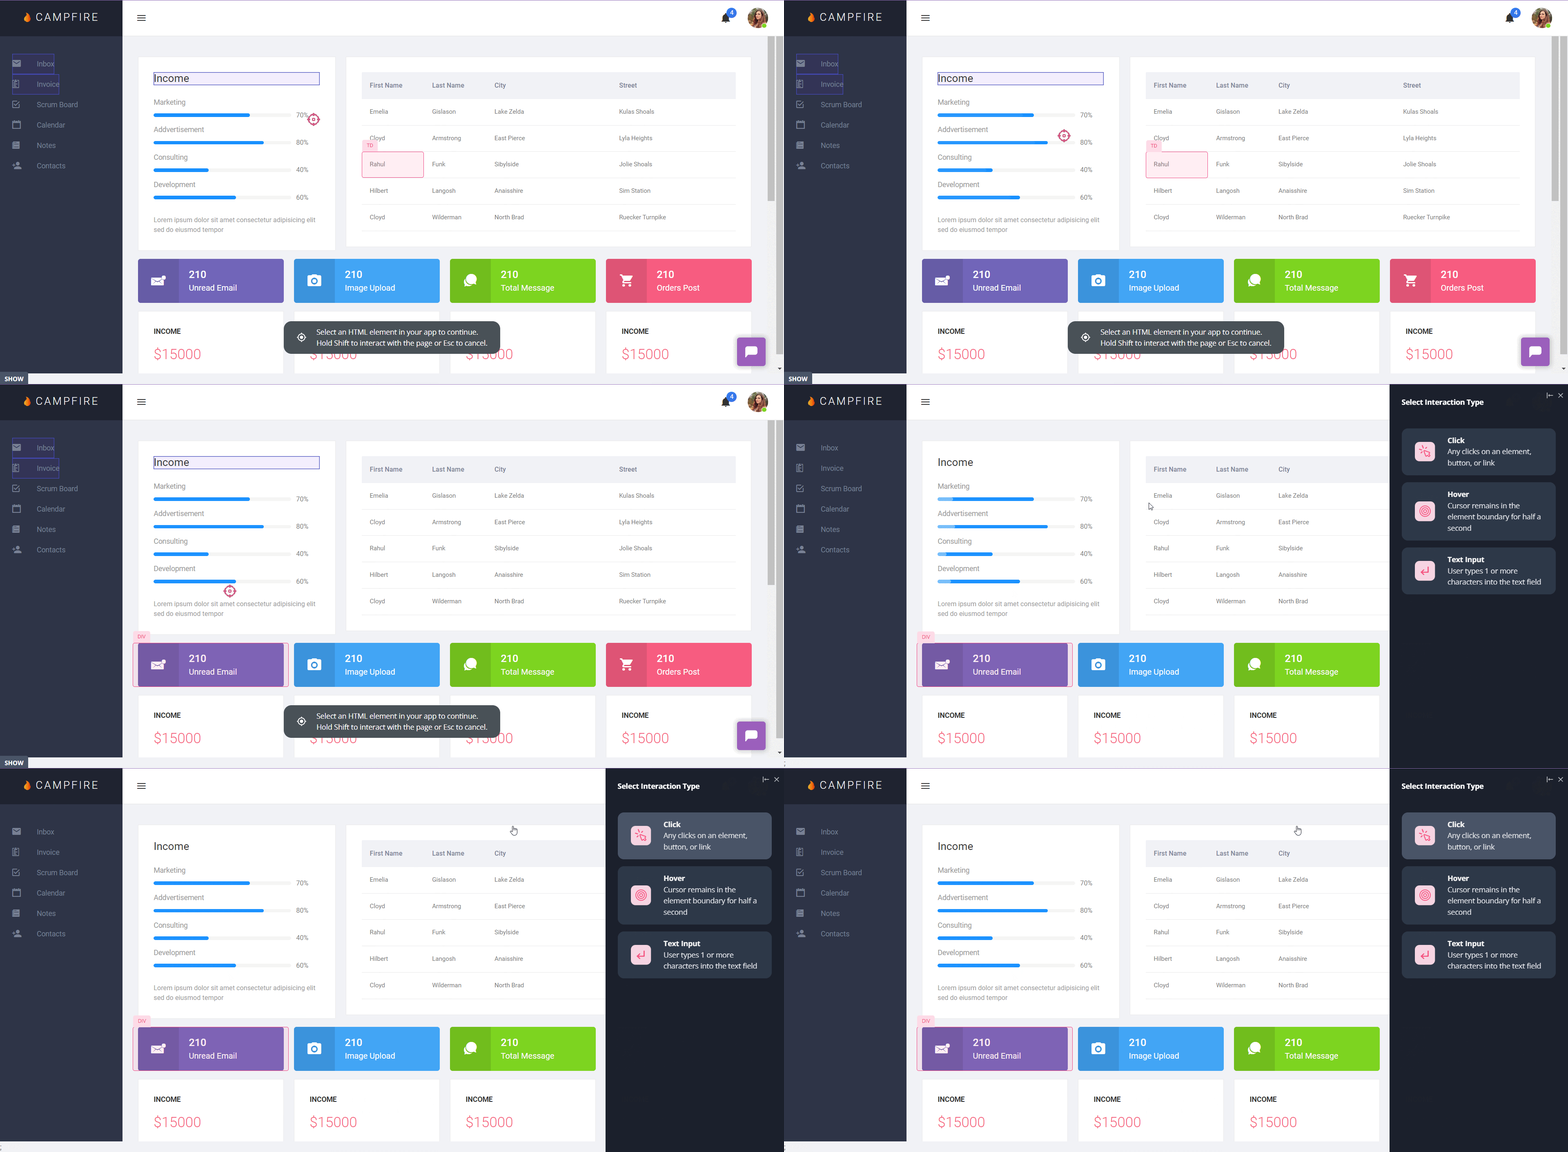
Capture feature usage data to understand engagement
You can tag any UI element to track feature usage among various customer segments across the user journey. Then you can measure some of the metrics discussed above like feature usage, adoption, usage frequency, etc.
Are there any features that are not being used to their full potential? Where are users getting stuck when using your product?
Once you have answers to these questions, you can conduct usability tests to identify the specific issues that prevent users from getting maximum value out of these parts of your product.
Gauging feature popularity also will allow your product managers to identify killer features of the product, aka the popular ones that make you stand out in the competition and win customers. Then, you direct your energy and resources to further improve them.
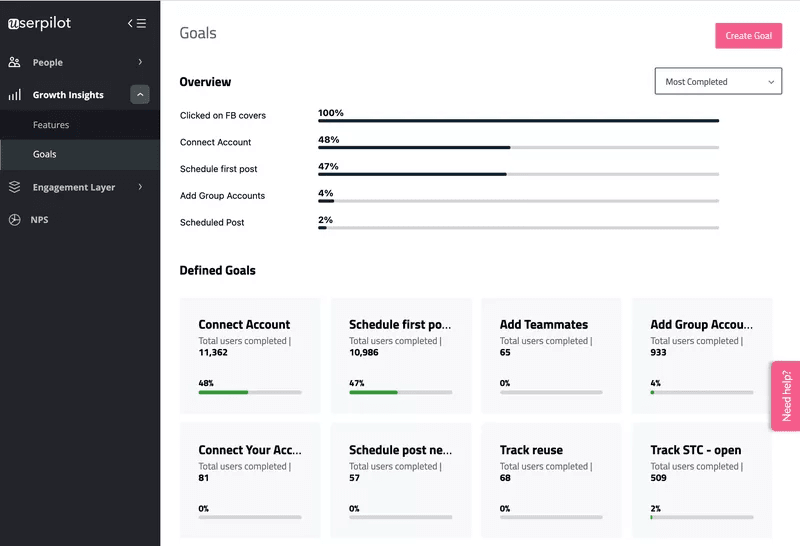
Set and track in-app goals throughout the customer journey
Set up milestones in the journey to see if users accomplished what they originally intended, or if they finish an action after they started it.
These goals could be simple such as a customer using a certain feature.
Tracking goal completion is very similar to funnel analysis. It lets you identify the drop-off points in the user journey and make improvements that increase the odds of them reaching the next stage.
How to use product usage data to drive retention and loyalty?
So how can you translate product usage data into actions that benefit your company? Here are some ideas:
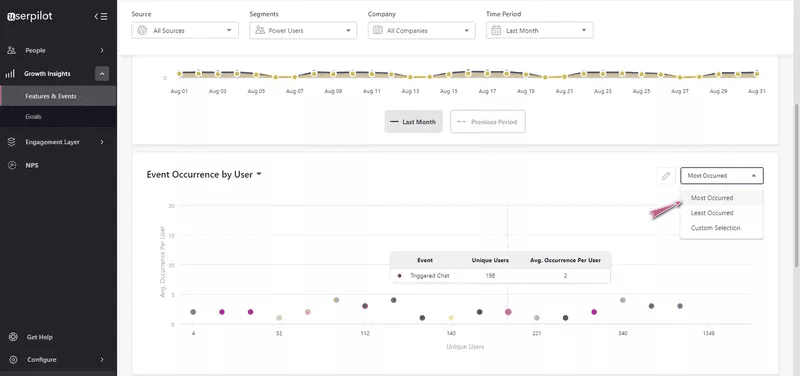
Study your power users and replicate their path to success
Dive deeper into your power users’ behavior and understand their experiences that led them to become loyal.
Maybe what turned them from regular users to loyal customers was a checklist that helped them to discover an advanced feature for their use case.
Armed with that knowledge, you can implement those strategies on the rest of your users who share similar characteristics and jobs to be done.
Remove friction from the user experience with in-app guidance
Product usage data highlights where users get stuck or drop off.
There are several reasons behind drop-offs. You may be attracting the wrong customers who aren’t a good fit for your product, there can be bugs that make it impossible for users to move forward, and so on.
But it’s often the lack of proper in-app guidance that causes friction.
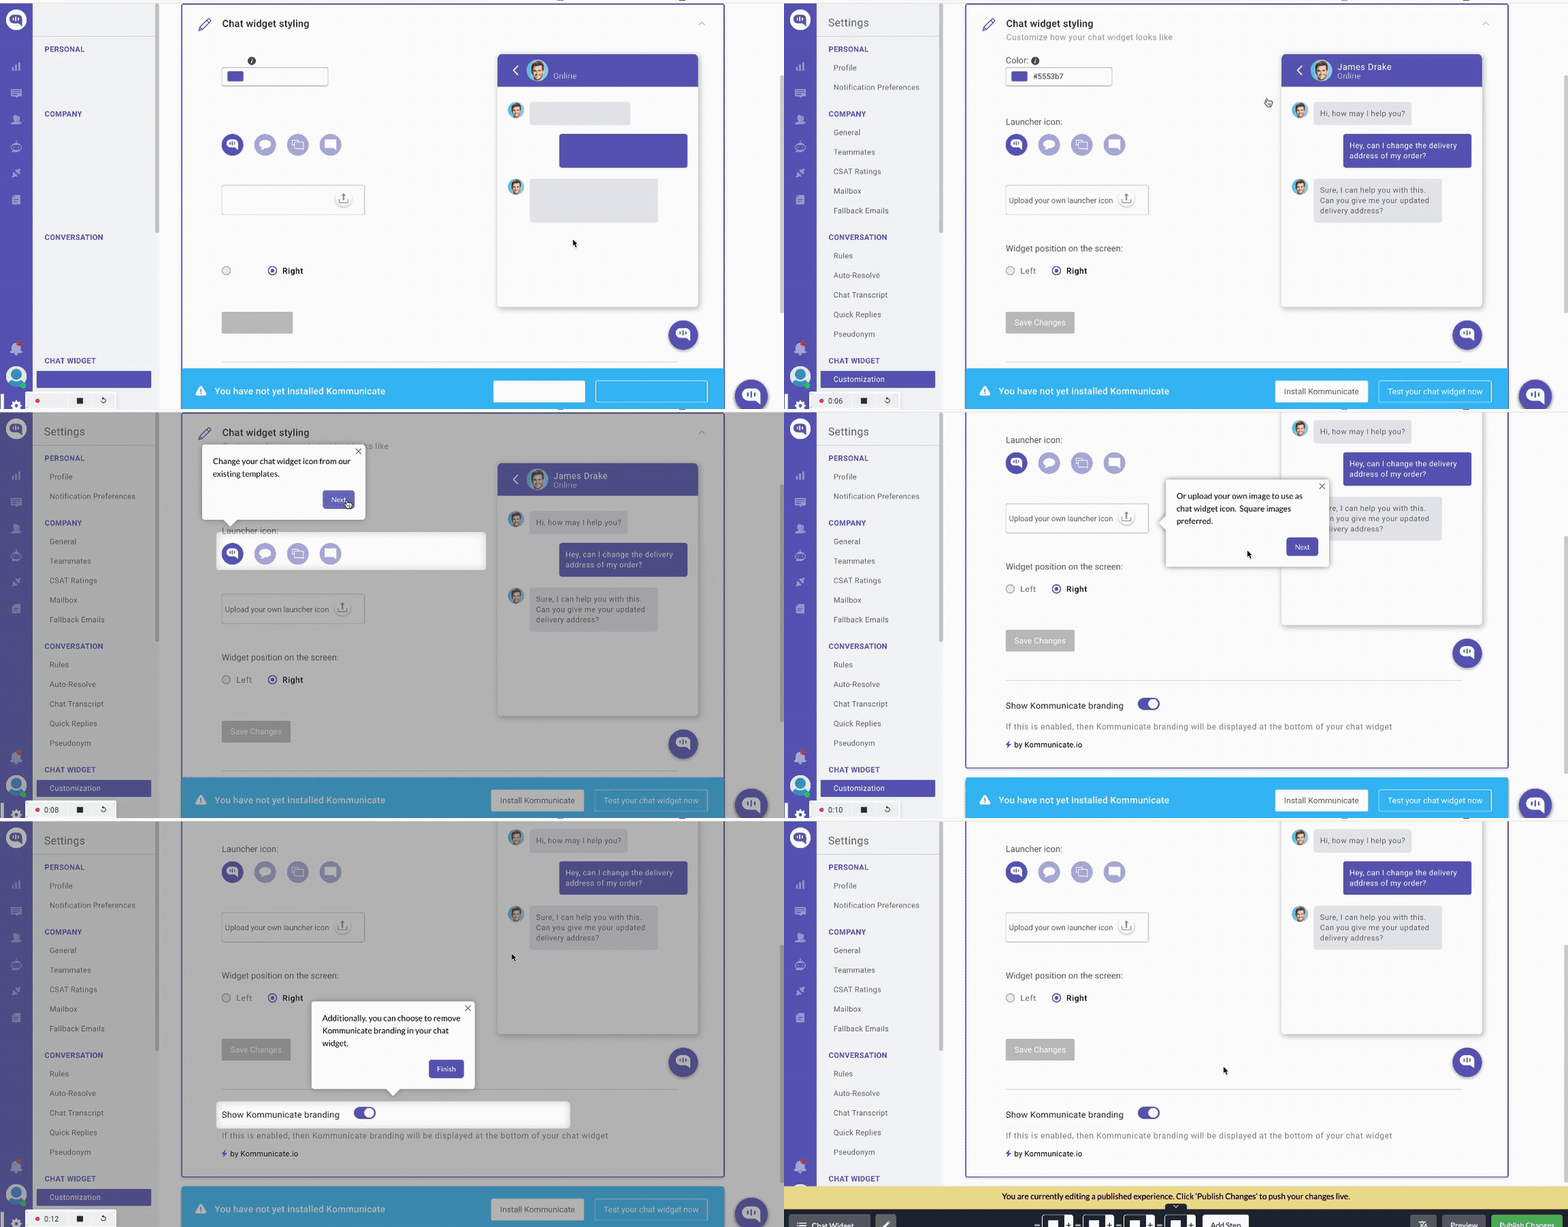
If that’s the case, you can build interactive guides that teach users step-by-step how to achieve their desired results.
Reengage inactive customers and retain them
With product data, you can identify customers with low engagement levels and take proactive actions to bring them back before they churn permanently.
First, you need to create a segment of disengaged customers.
Then, study the segment and understand if there is anything in particular that is holding them back.
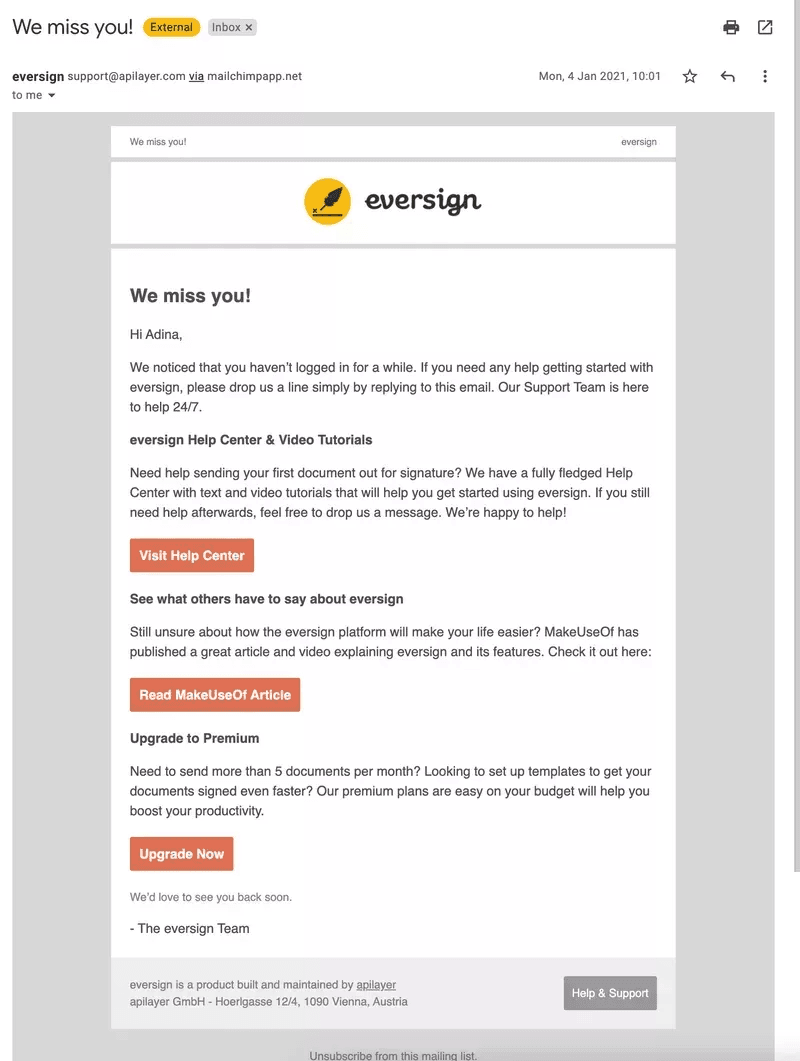
A simple personalized email that reminds customers of the product’s value, points to self-help resources and encourages them to contact customer success if additional help is needed, can go a long way in winning customers back.
Drive account expansion with contextual prompts
Use product usage analytics data to develop personalized in-app strategies to improve conversion.
For example, if a trial customer has clicked your purchase button but didn’t upgrade, you can prompt a modal to offer them discounts and limited deals. This will create a sense of urgency and convince them to take the deal.

Collect targeted feedback and build better products
Product usage data makes it easier for you to evaluate the customer relationships with your product and provides the opportunity to get targeted feedback from your most loyal users.
Loyal customers who know the ins and outs of your product really well are more likely to send highly-detailed and honest answers that can help you to improve your product.
Once you’ve segmented your loyal customers, trigger a modal to invite them to one-on-one interviews and surveys.
Just don’t take them for granted and make sure you offer them some incentive like a gift card or access to beta features.

Best tools on the market for tracking product usage data
Now that you’re familiar with the process for getting product usage data, and how to use this data, you’ll need specialized software to assist you.
Here are our recommended tools for tracking product usage data:
Userpilot
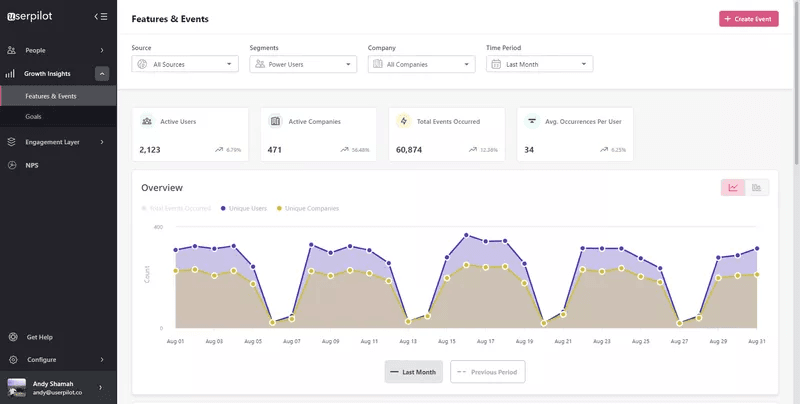
Userpilot is a product growth platform that enables you to track user behavior on a deep level and create different customer segments for product usage.
Here’s what you can do with Userpilot:
- Create advanced user segments based on product usage and in-app behavior
- Tag features and track the usage
- Set up in-app goals and track their completion
- Create personalized user experience flows with different UI patterns
- Onboard and engage mobile app users by creating personalized messaging, push notifications, and surveys
And the best part is, you can do all of this completely code-free and with minimal setup effort.
Pricing packages start at $299/mo (billed annually). It offers a 14-day free trial so you can actually test it before making a decision.
Hotjar
Hotjar is a behavioral analytics platform best known for its heat maps and session recordings.
Heatmaps analyze and record customers’ behavior on a selected URL—mouse movements, hovers, taps, scrolls, etc.
After that, Hotjar displays a snapshot of the URL in different colors. A page’s most-interacted areas are highlighted in red and orange. The blue color indicates areas with little user interaction.
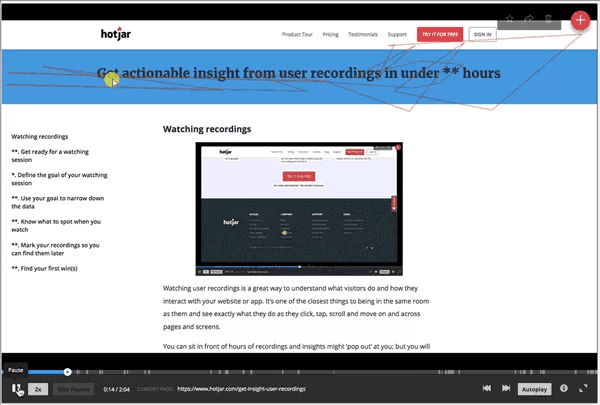
Session recordings enable you to spy on how your customers interact with the product in real-time. You can then replay sessions to examine customer behavior and locate friction points.
Conclusion
There’s a wealth of knowledge you can unlock for your business if you know how to make use of product usage data.
This data has relevance for several teams, including the marketing team, product development team, design team, data engineers, and dev team.
Sign up for a Userpilot demo to learn how best to track and utilize product usage data.


