If you want to understand whether your SaaS company will rise or die soon, you first need to conduct a customer retention analysis to look at important growth metrics.
This data will help you understand how and why users churn.
This article covers everything you need to know about getting started with retention analysis and how to use the insights to reduce churn.
Try Userpilot Now
See Why 1,000+ Teams Choose Userpilot

What is retention analysis?
Retention analysis allows you to understand customer behavior when it comes to using and abandoning your product so you can maintain healthy growth through constantly improving retention.
Tracking customer behavior will give you insights into :
- What’s the average customer lifecycle?
- What’s your customer retention rate?
- What customer segments churn within the first months?
- What makes customers stick around longer?
- How to improve users’ satisfaction and reduce customer churn.
What does a retention analyst do?
A retention analyst is responsible for sustainable business growth by retaining existing customers. Their goal is to figure out why users are leaving the product and how to prevent it.
Among their tasks are:
- Work with large data sets of customer behavior analytics to understand churned customer behavior.
- Measure user stickiness around the product (how many customers return to your product because it’s engaging and valuable to them).
- Design and implement customer retention strategies that increase the customer lifetime value.
How do you measure retention?
Every product faces churn. It’s inevitable. Sometimes users sign up just to hang around for five minutes or buy the cheapest plan to solve a one-time task, then never return.
Yet our goal is to increase the number of customers who continue to use your product month after month.
Before starting to measure customer retention, you first need to understand what customer success looks like for your users using your product.
Let’s learn how to prepare proper data sets for accurate retention analysis.
Define active vs. inactive users
The first step toward customer retention analysis is defining what inactive users are and excluding them.
This will help you focus your analysis on power users.
Just for recall:
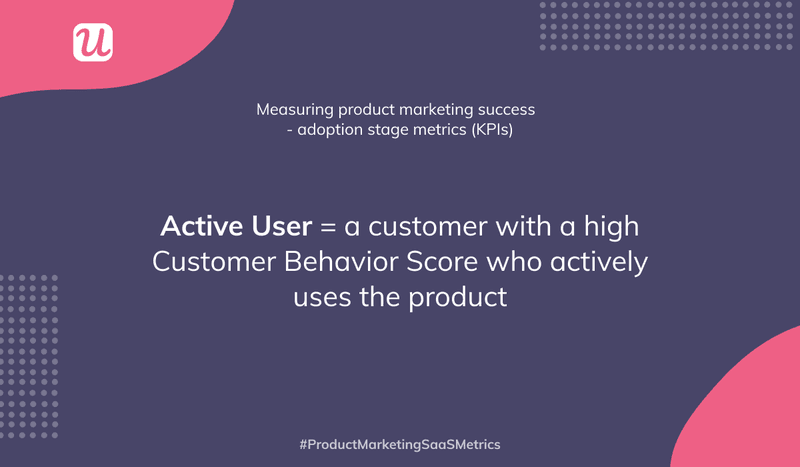
- Active users are those who constantly engage with your core product features and have a high customer engagement score.
- Inactive users remain are the ones who suddenly stop engaging with your product.
Defining what active means will be different depending on your product and how it was meant to be used.
For example, if you have an invoicing tool, you won’t countactive users based on the number of logins, as the user might only need to issue one invoice in a month.
Understand engagement
Active users also mean engaged users. But what are the features they are mostly engaging with?
Once you understand this, you pretty much understand what’s bringing value to them.
A user getting value from your product is going to return and continuously take the same actions that brought him value.
You’ll want to track how users are performing those actions in your retention analysis.
Calculate retention rate
Now that you understand entirely what active users stand for, you’re ready to calculate the retention rate. This will be your starting point for what you will be looking to improve.
First, you calculate the number of customers at the end of the period minus the number of new customers acquired during the period. Then, you divide this by the total number of customers at the start of the period and multiply by 100 to get your retention rate.
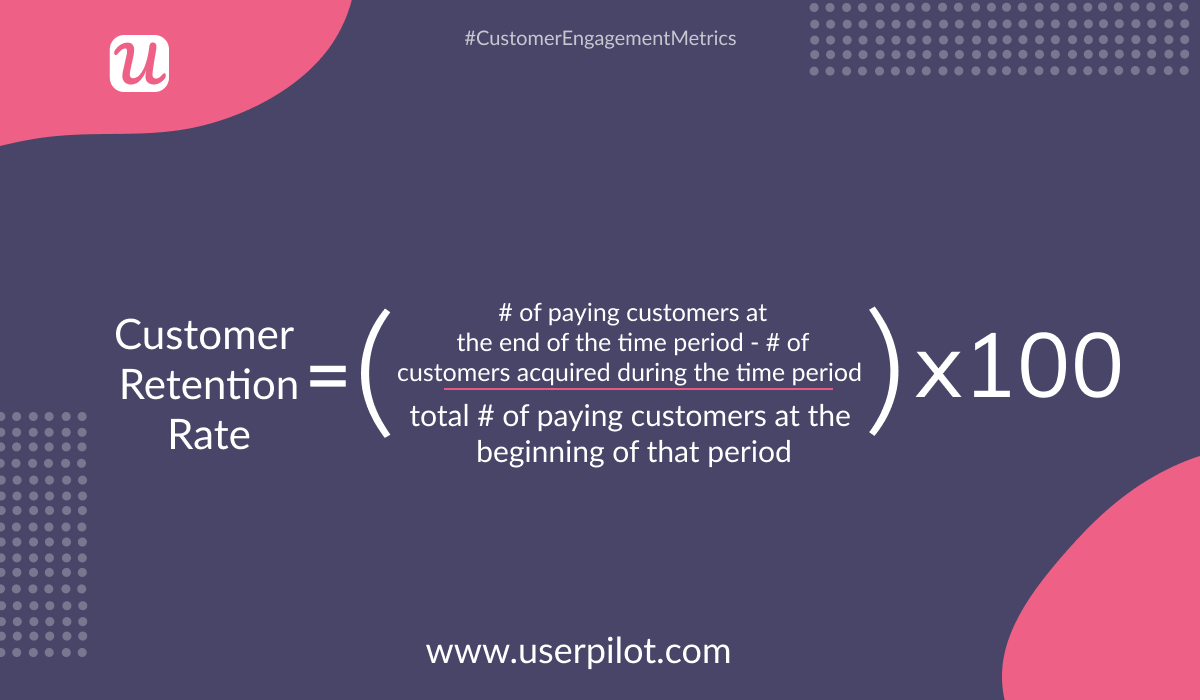
This is the simplest way to calculate the overall retention rate. Now you’re ready to create more structured and insightful reports to analyze customer retention.
What is the retention process?
The retention process involves multiple tracking and analysis reports. Each gives you different insights to act on to prevent churn when monitored continuously.
We’ll go through three important ones:
- Retention analysis using cohort analysis (retention cohort report)
- Retention analysis using funnel analysis to understand where users drop off
- Retention analysis using customer engagement score
Let’s start!
1. Retention analysis using cohort analysis (retention cohort report)?
Cohort retention analysis tracks customer lifecycle over a defined period (usually twelve months) to detect a “sensitive” month when most paying users stop using the product.
A cohort analysis report also helps you detect retention rate fluctuations:
- What month do adopted users drop off the most?
- How many new users leave after the first month of engaging with your product?
- What user cohort sticks or churns the most?
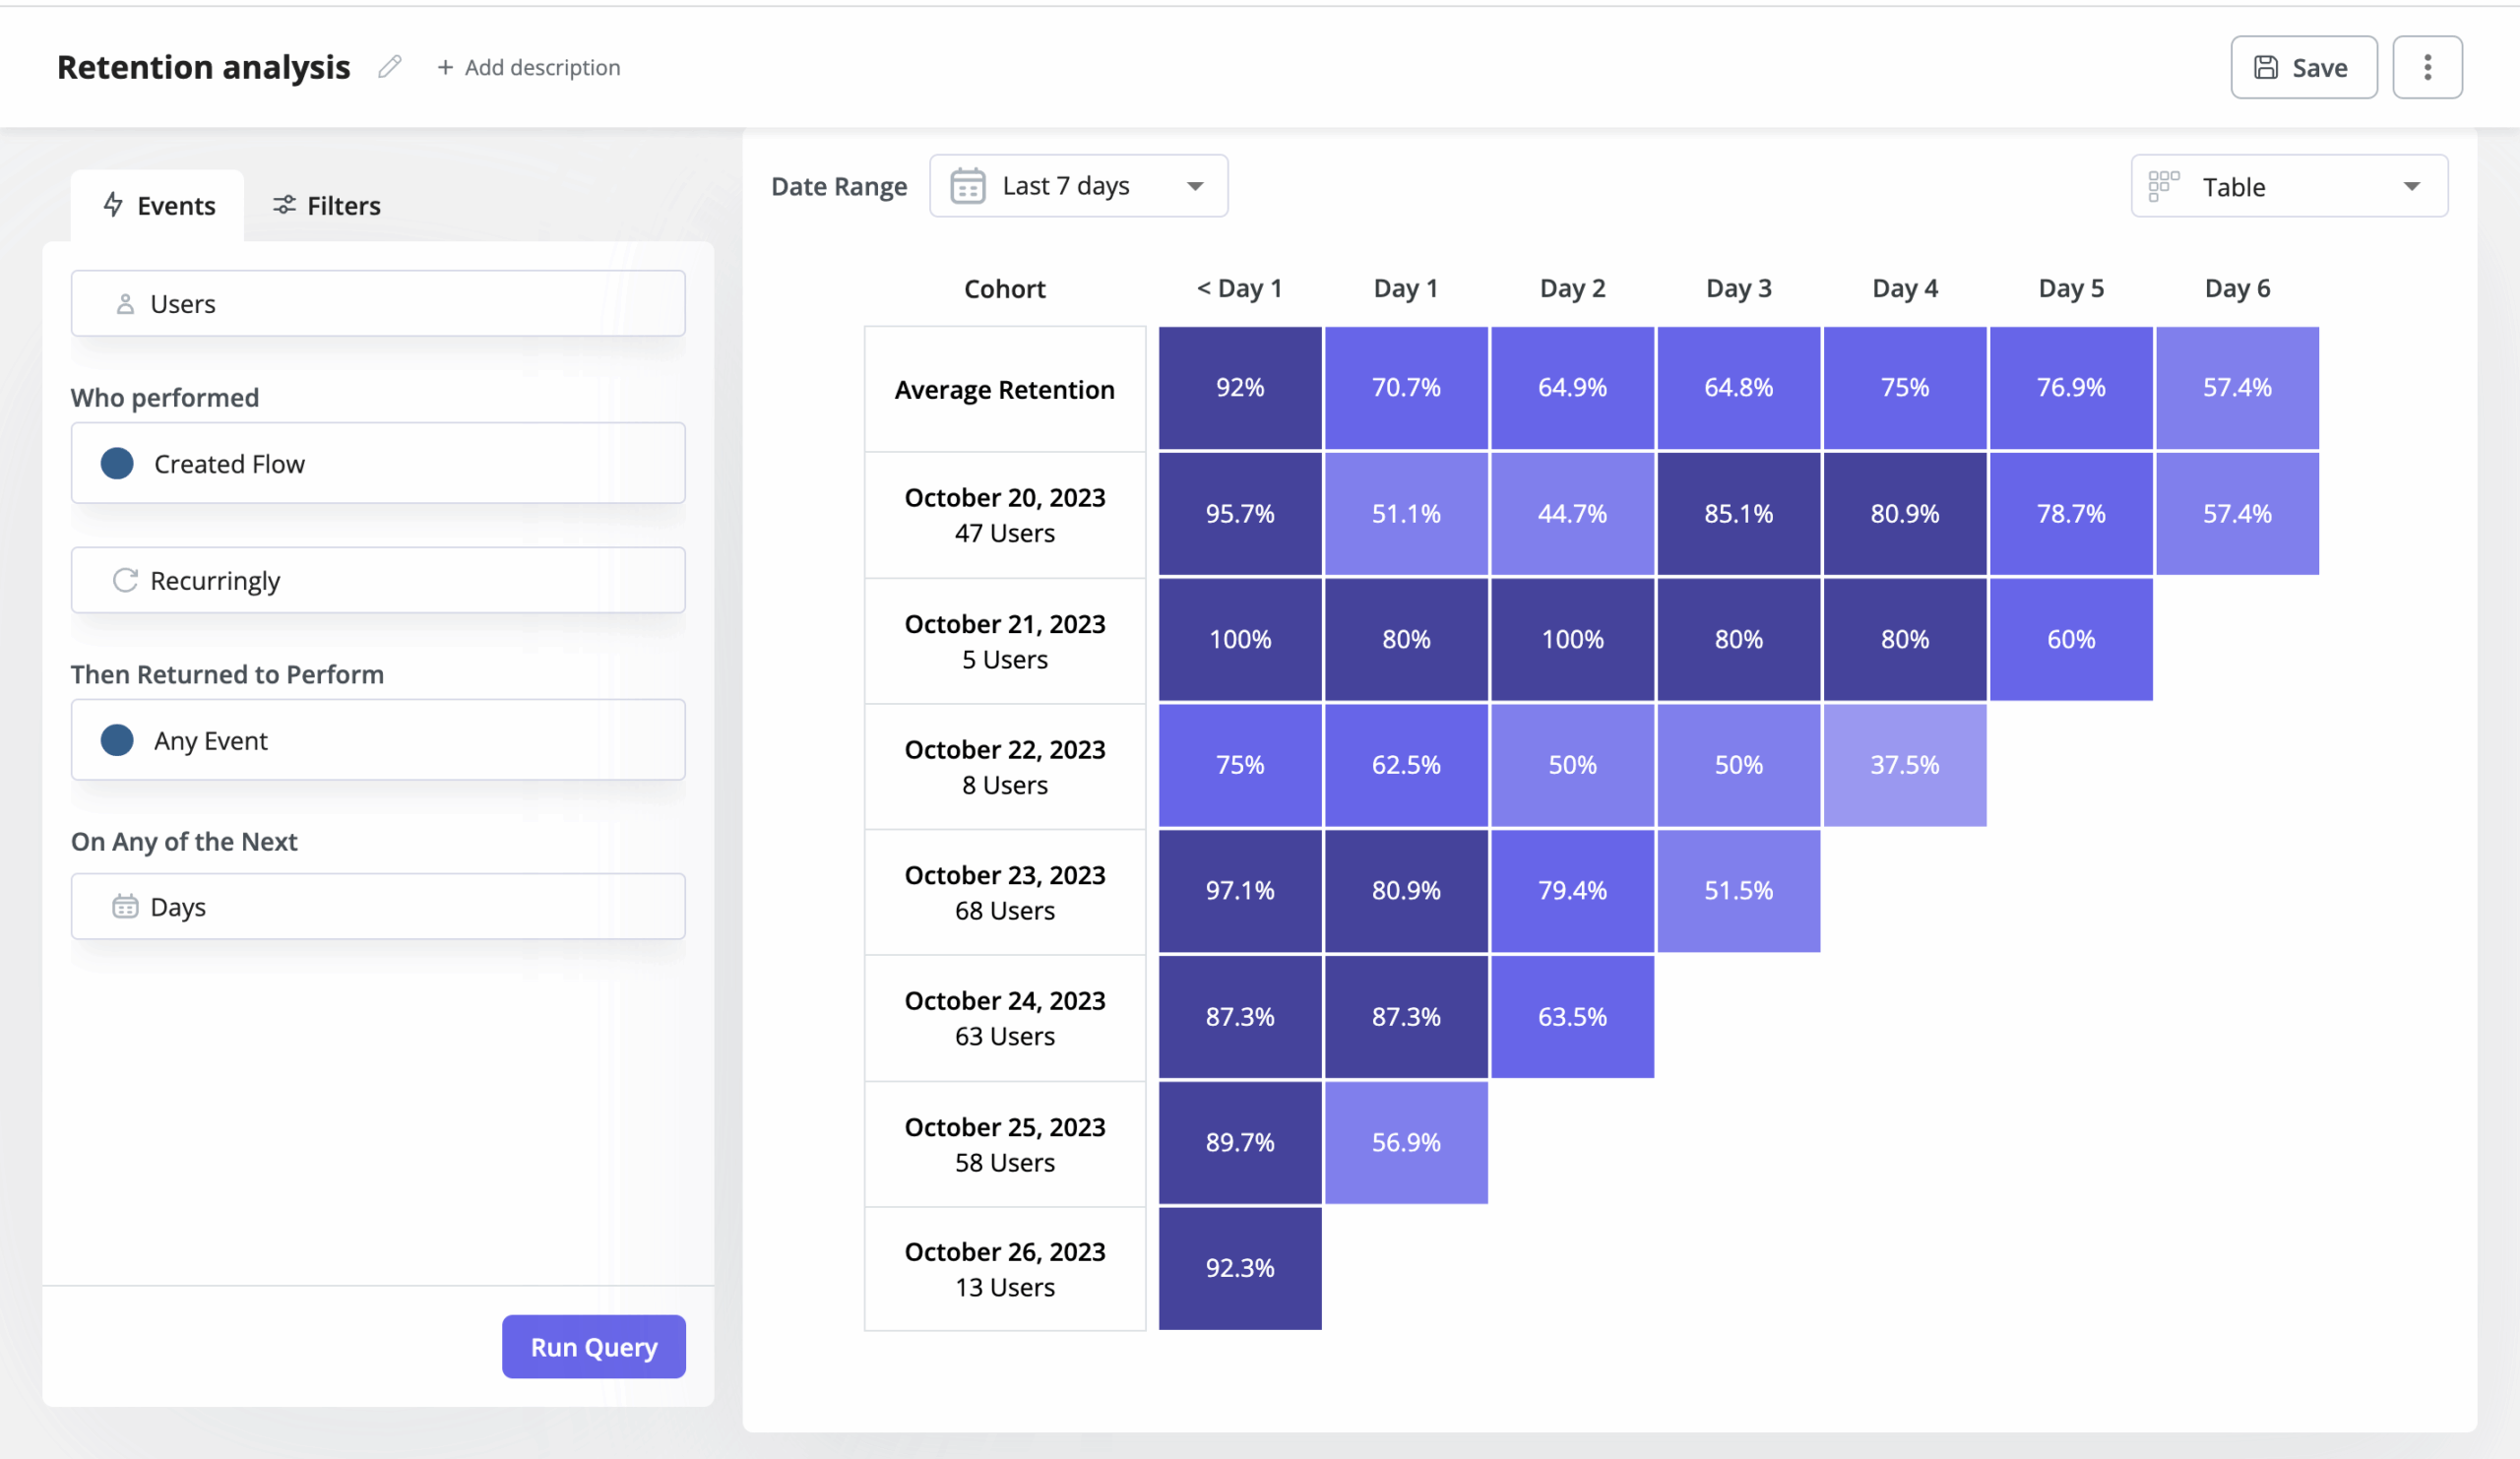
We’ve talked in more detail about performing a cohort analysis here, so here is a short recap of what insights you can get:
- Overall, what is the stickiness of your product? Is your current product version viable?
- How many new customers do you need to acquire every month to remain profitable?
- Do marketing campaigns attract qualified prospects?
- Look out if product updates you made (new feature releases, major bug fixes, etc.) lead to recurring revenue growth.
As for final words, I’ll highlight that conducting cohort analysis is of paramount importance for keeping your SaaS business alive and lucrative.
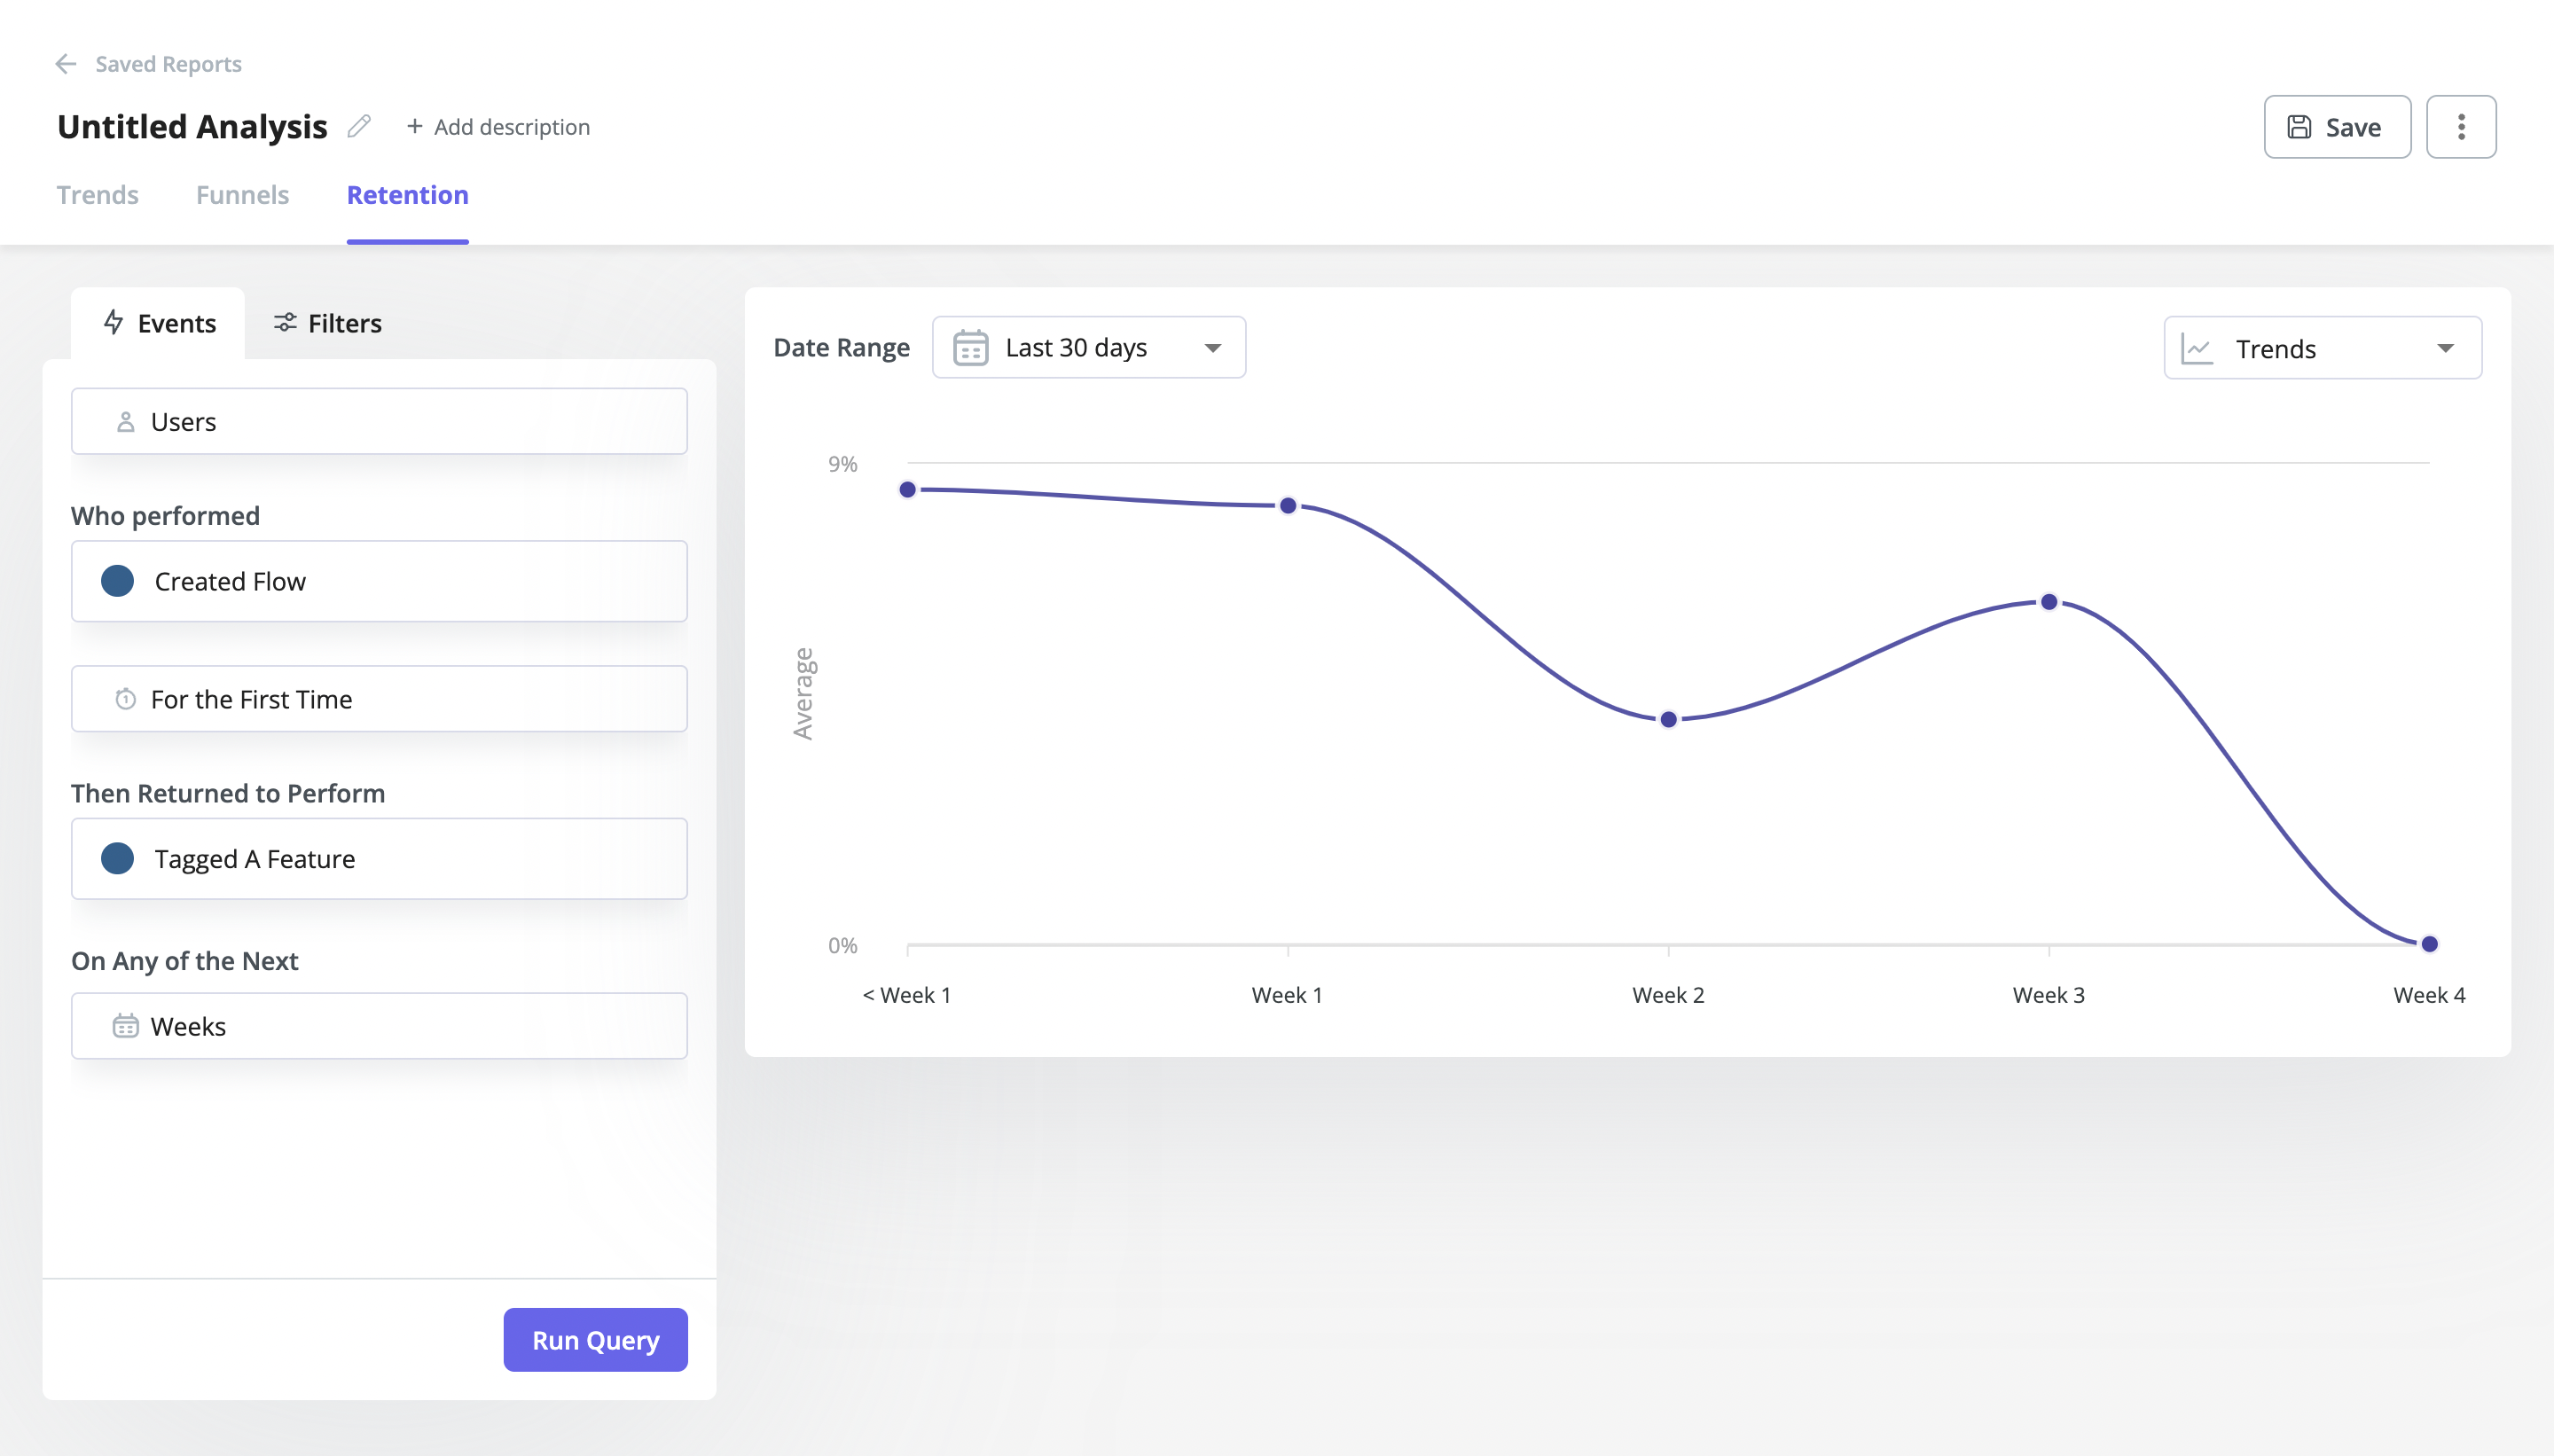
Creating cohort retention reports is easy with a no-code tool like Userpilot. All you need to do is select the right events and choose the time range for the report. Userpilot also shows the retention curve – this data visualization style helps to view retention at a quick glance.
2. Retention analysis using funnel analysis to understand where users drop off
The next crucial thing to analyze is how users progress through their journey. Thanks to different funnel analytics tools, you can detect what steps cause friction in the user flow.
For instance, Google Analytics shows how users navigate your website and map their behavior.
You can build the same funnel but for tracking in-app events by using an analytics tool like Userpilot.
When set up, the tools gather data on how customers evolve through their journey and how they reach specific milestones.
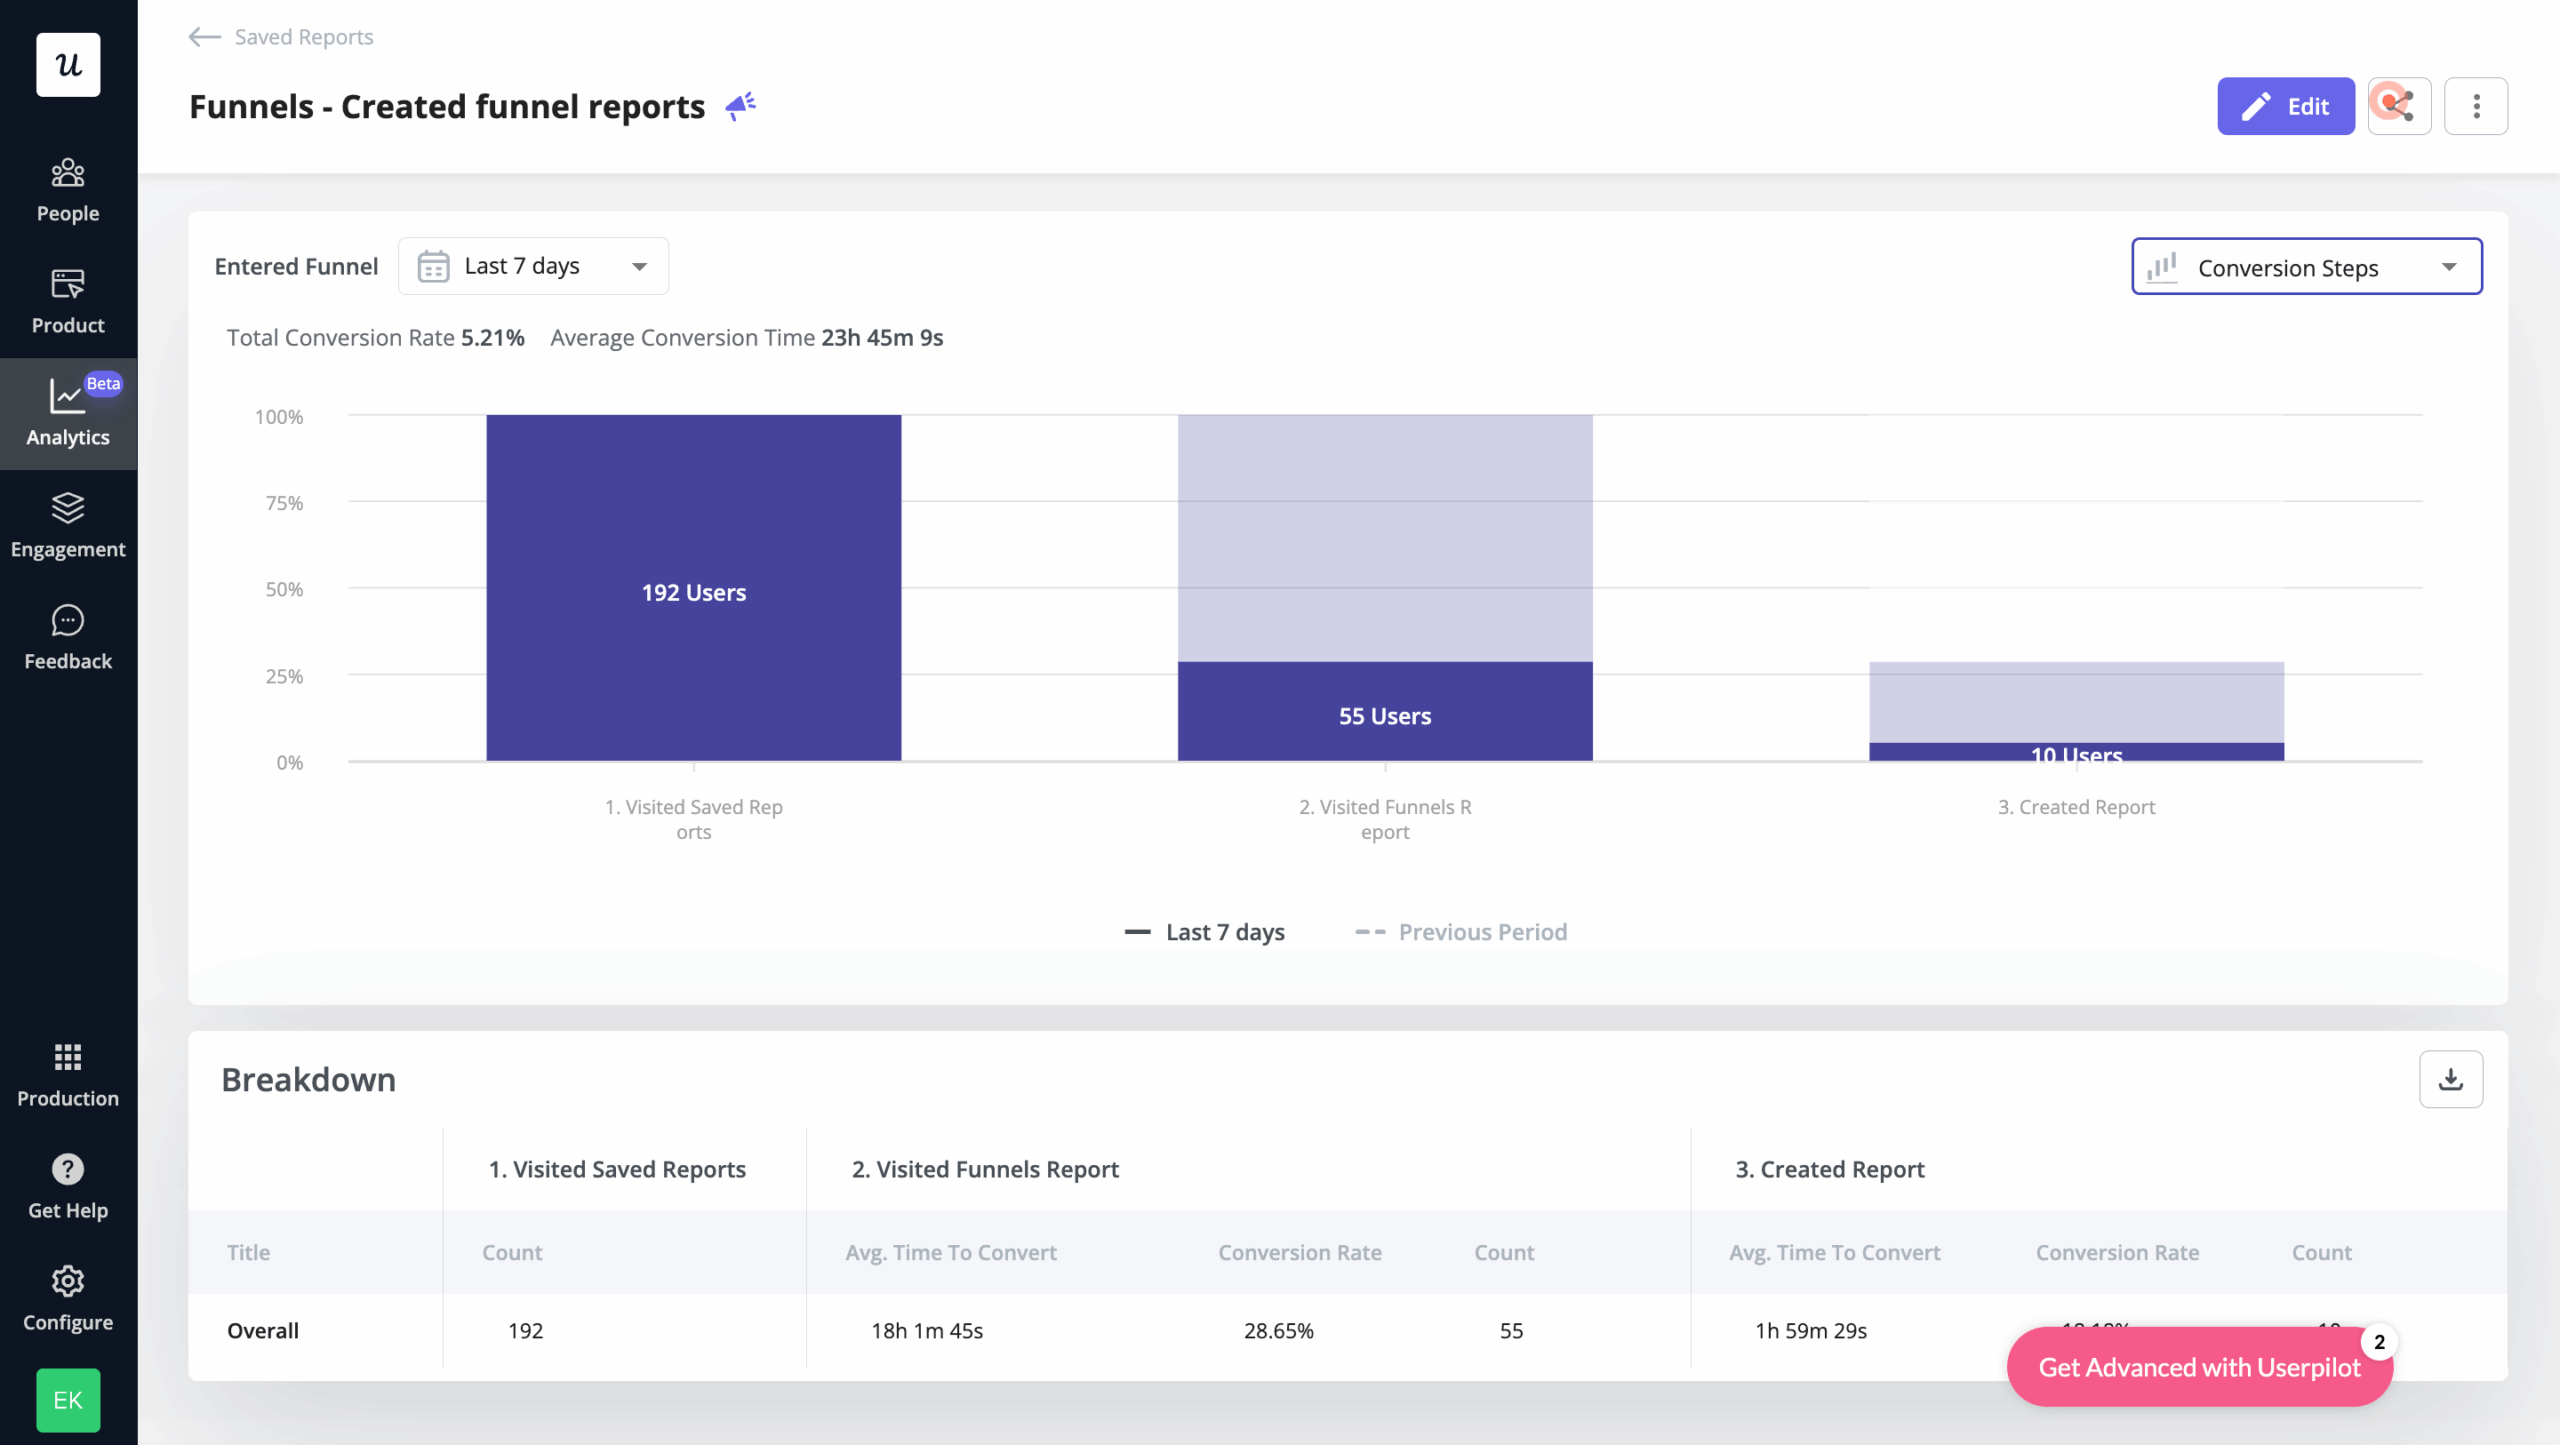
To illustrate, below is an example of a funnel analysis. As you probably noticed, many users drop off when moving to stage 3.
Armed with these insights you now know what needs to be improved in order to improve retention metrics.
3. Retention analysis using customer engagement score
A customer engagement score shows you how healthy your customers are. In other words, assigning a score to their engagement lets you understand the early signs of churn.
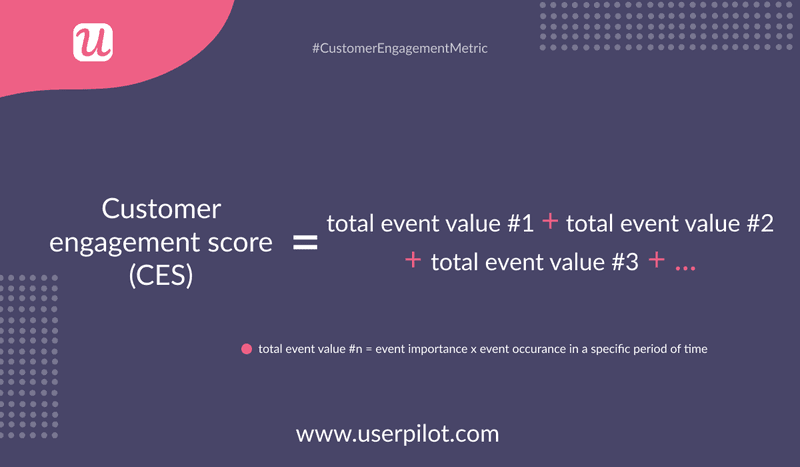
The engagement score takes into account users’ interactions with your product’s key features and calculates a score for each user.
To find out your customers’ engagement score, follow these steps:
- Identify key events and define what engagement means for your product
- Assign an engagement score to each completed event
- Calculate the event value for each event (multiply the event value by the number of times the user performs that action)
- Then sum up the totals for each user based on the actions they perform and how they engage with your product
We’ve covered the main ways to perform a retention analysis, now let’s look at some ways you can use those insights to reduce churn.
Customer retention strategies to streamline retention efforts
Here are four effective customer retention strategies you should try implementing in your SaaS to drive growth.
Identify potential churn and retention patterns to drive growth
NPS surveys will play a massive role in identifying detractors and patterns associated with churn.
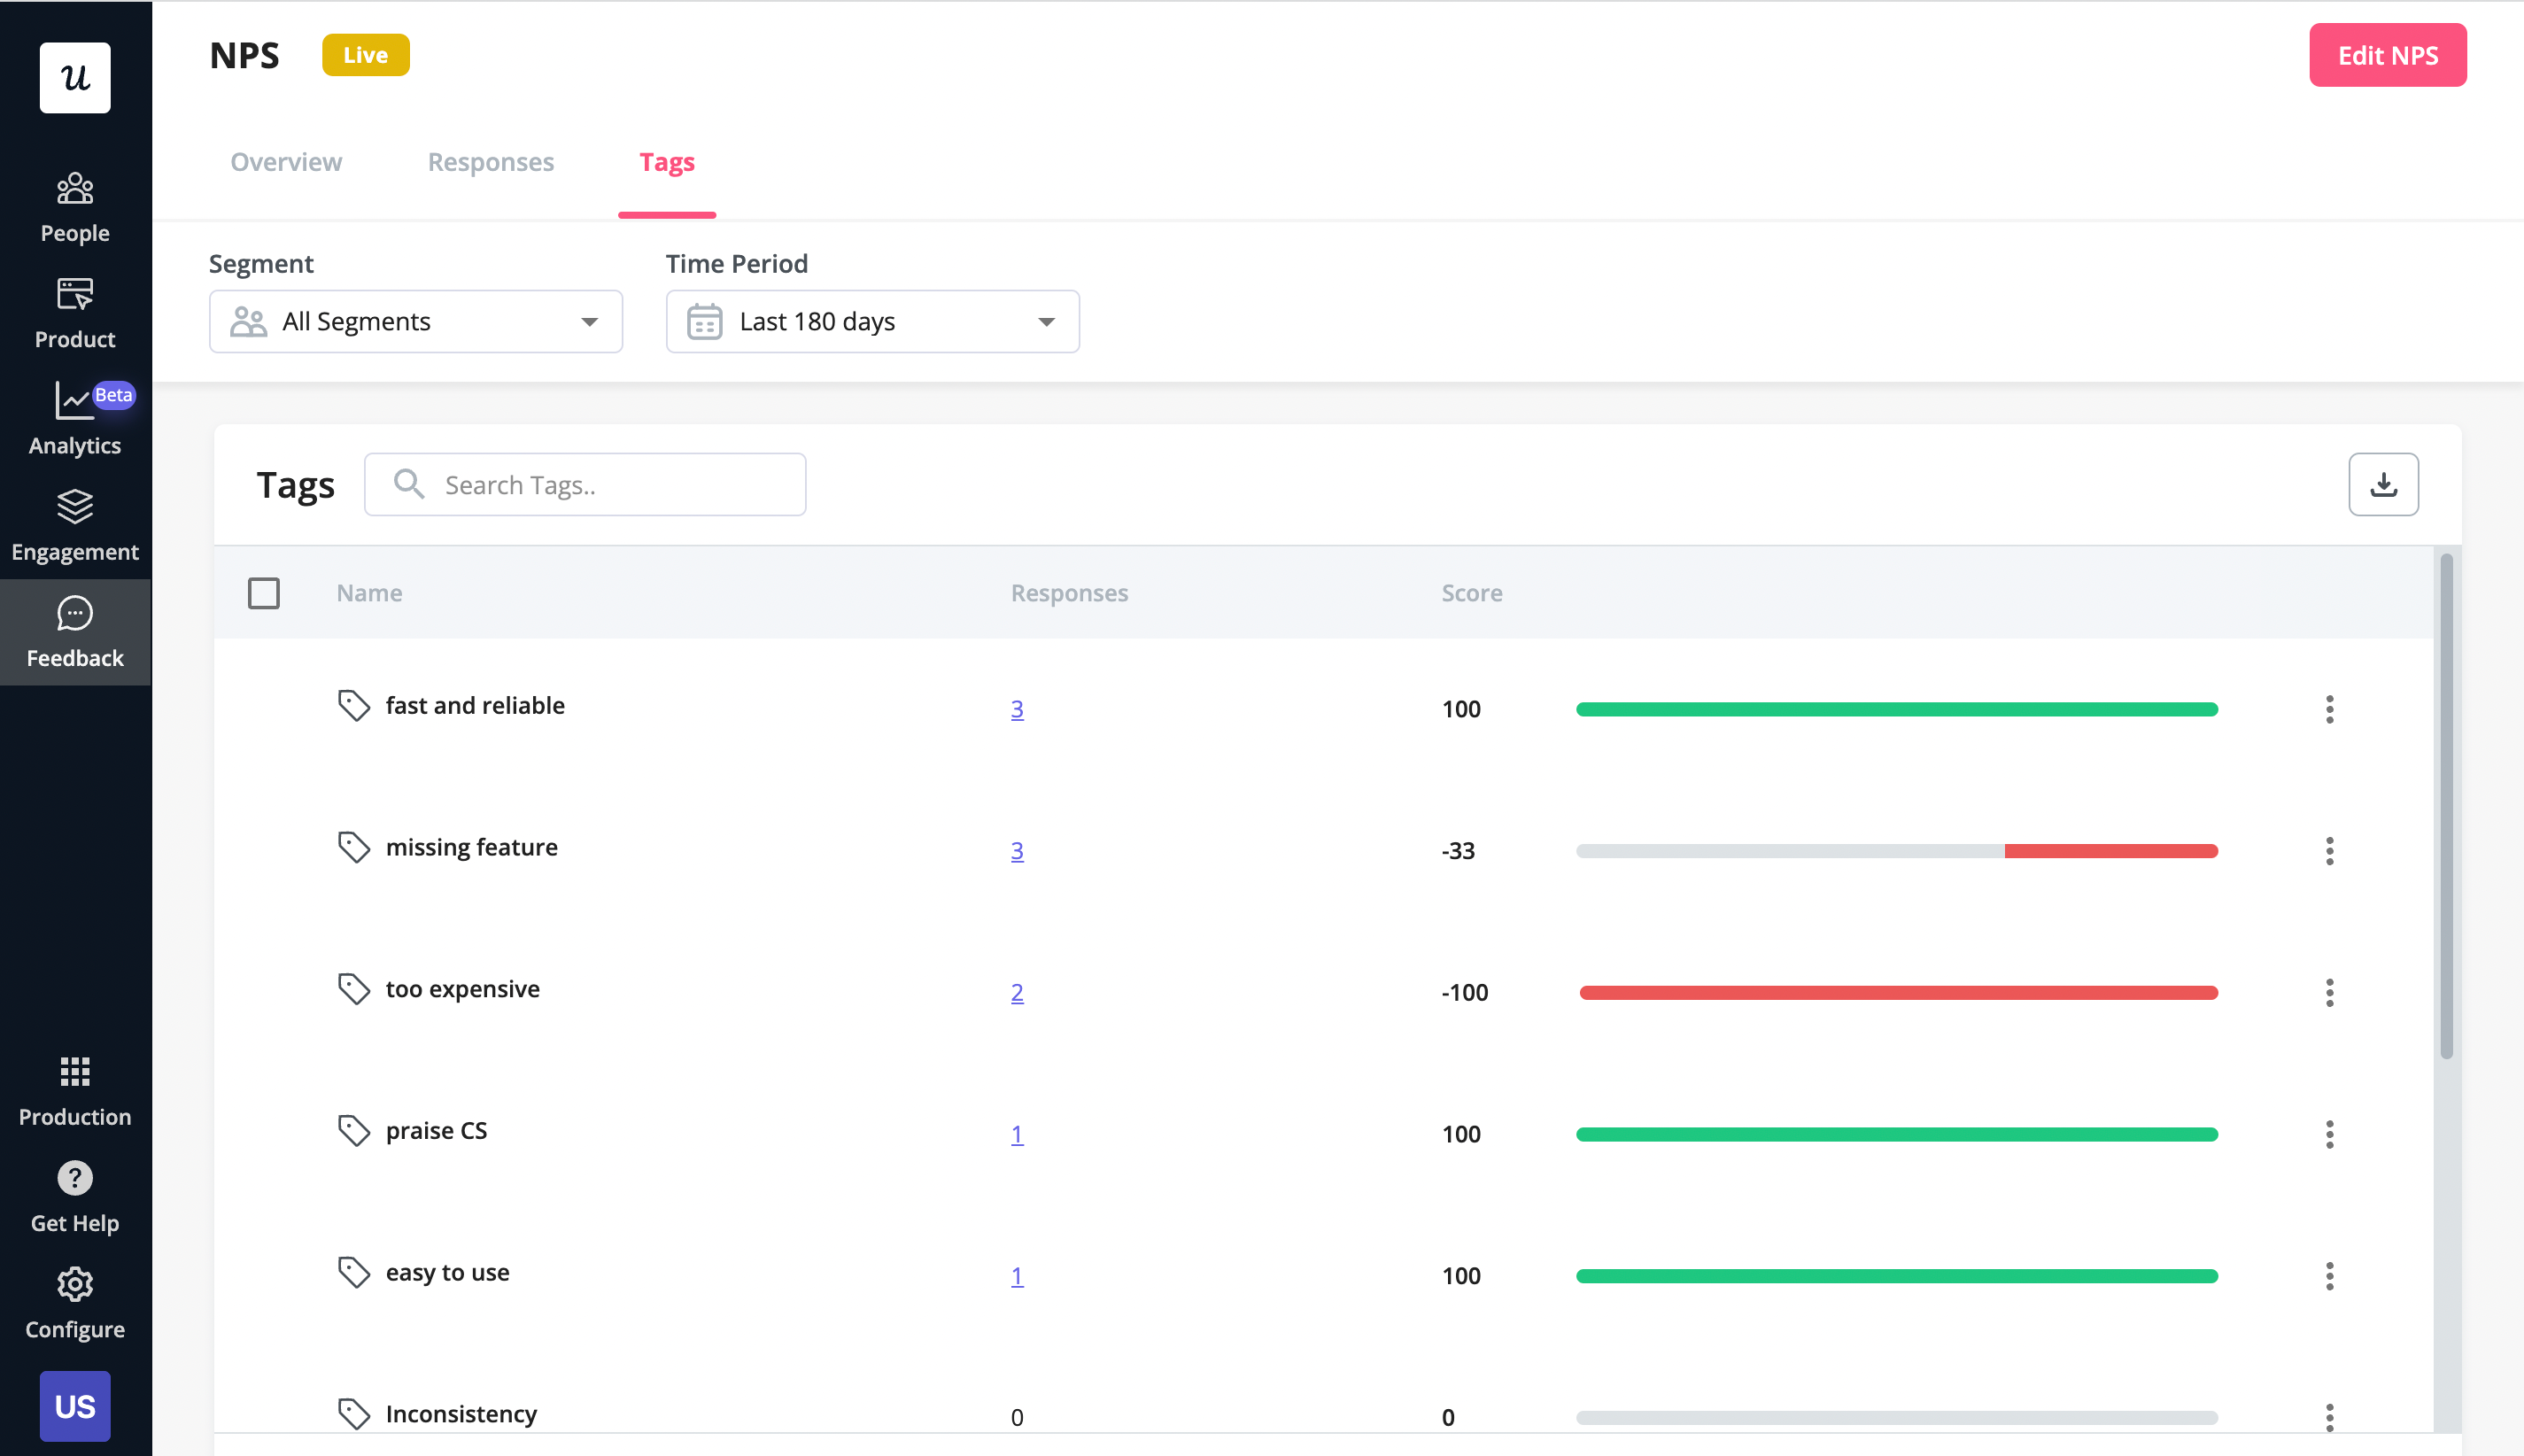
To do so, always ask a qualitative question to understand why users give you a certain score. Go through the answers and tag specific words they use.
You can do this using a product adoption tool like Userpilot.
Once you’ve applied tags, you can identify patterns associated with low NPS scores. For example, ”missing features” and ”too expensive” are two reasons for a low NPS and could also be the cause of churn.
Reach out to those users and offer help, maybe the features they are missing actually exist in your product or are on your roadmap.
Plus, pay attention to how promoters engage with your product. Which features do they use? What makes customers happy and drives stickiness?
Create in-app guidances to help others discover and engage with those features.
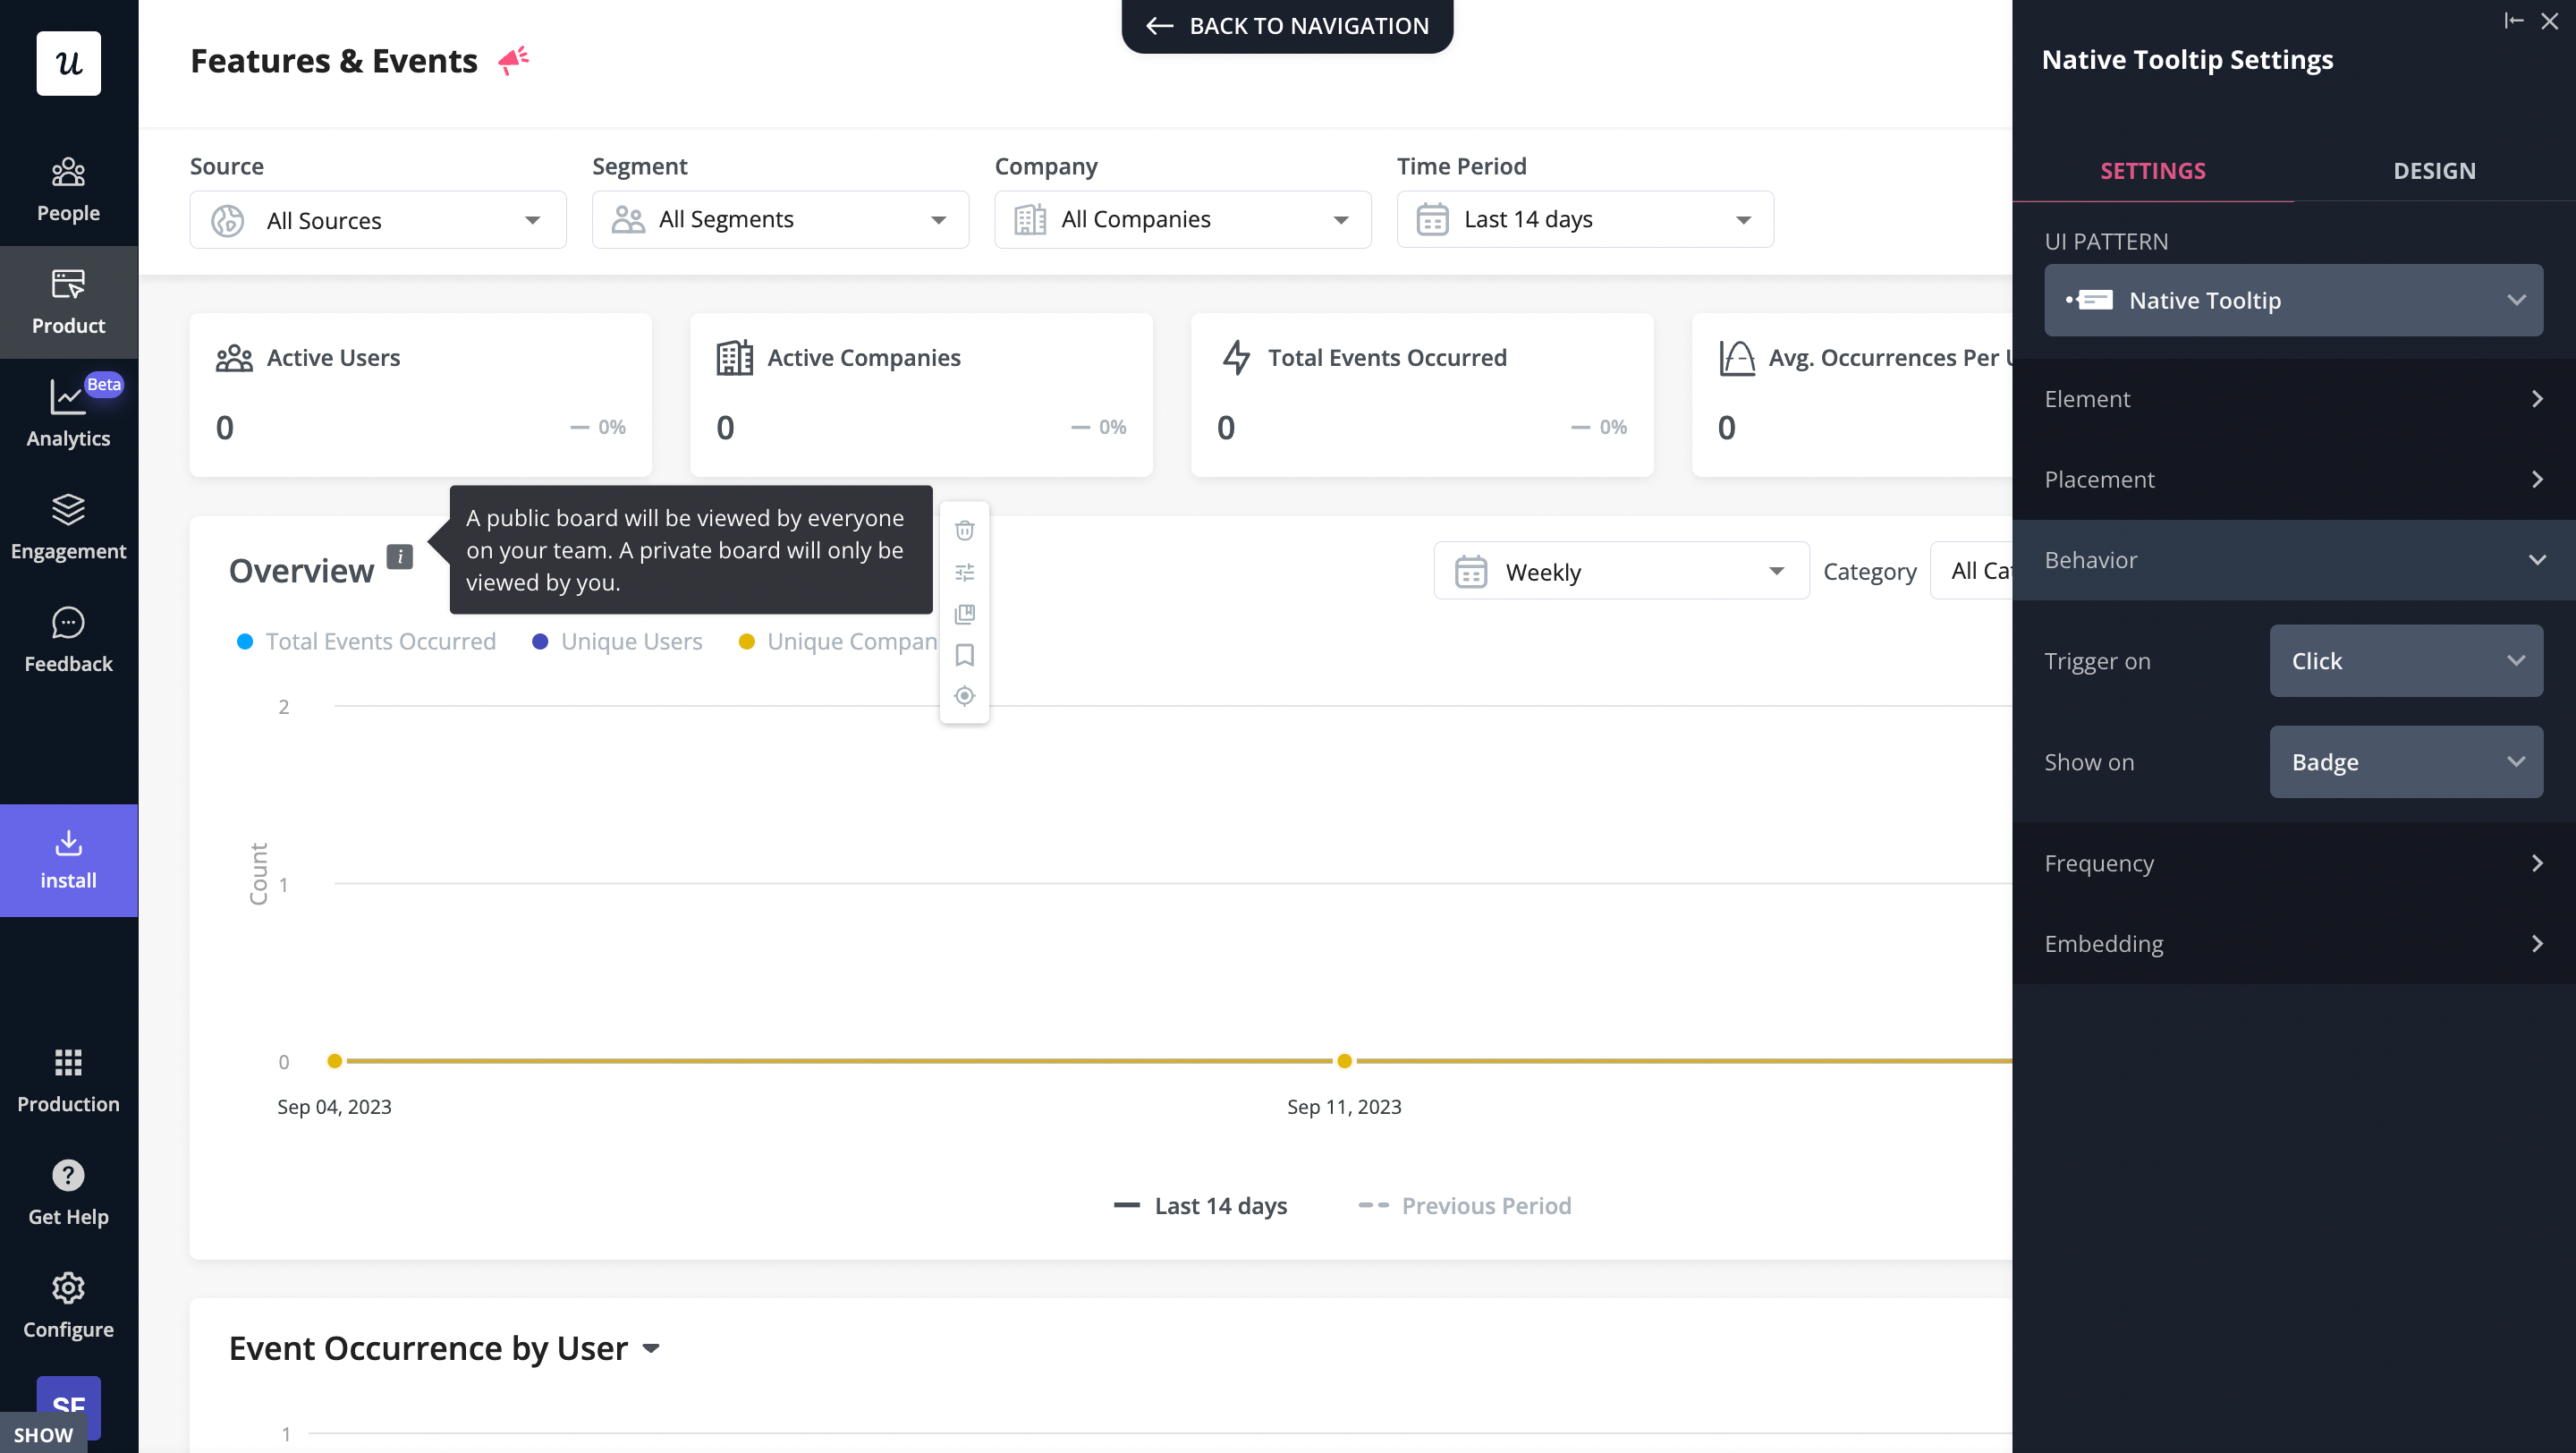
Increase customer satisfaction and drive retention with feedback surveys
Use in-app microsurveys to collect contextual customers’ opinions toward particular features.
For example, run feature feedback surveys with an open-ended question after a new feature release to see if users like it or not.
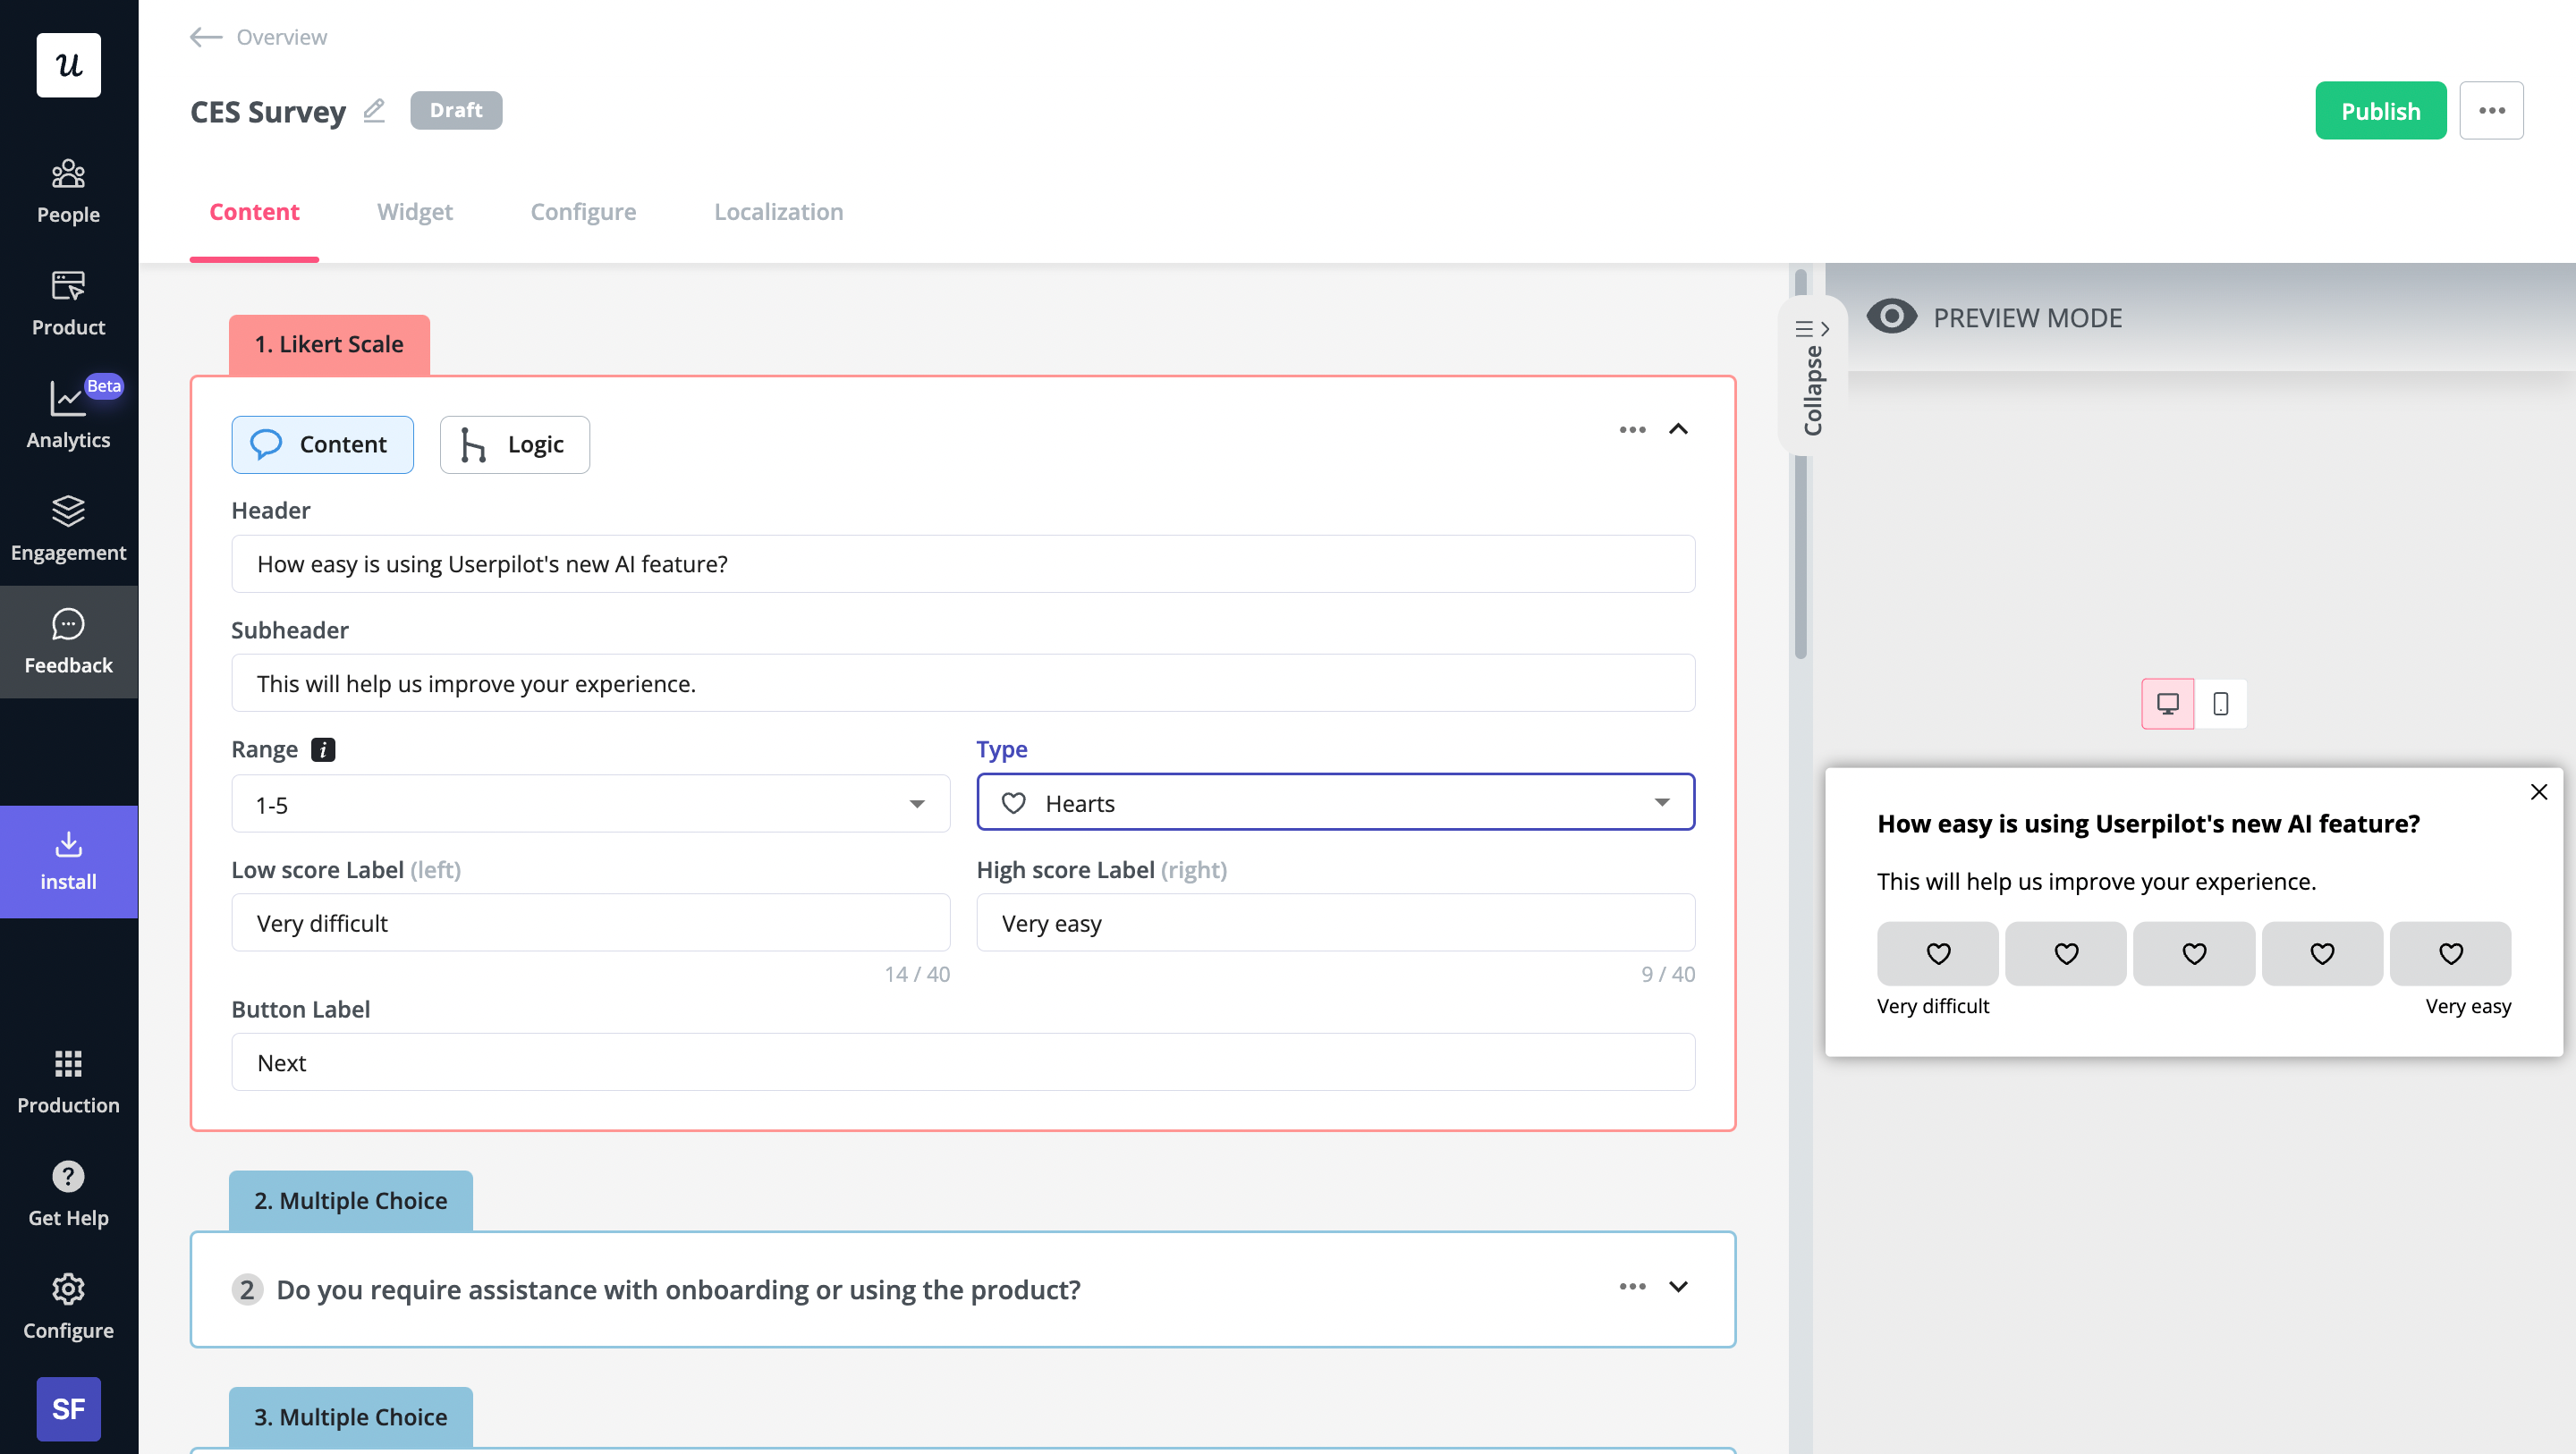
Use churn surveys to understand why users leave and improve
Implementing exit surveys will help you understand the main reason users churn.
This is called user offboarding. You not only understand why they leave, but you also get the chance to offer them an alternative to churning.
Here’s a great example of an exit survey sequence created in Userpilot.
First, frame the reason why a customer is about to leave.
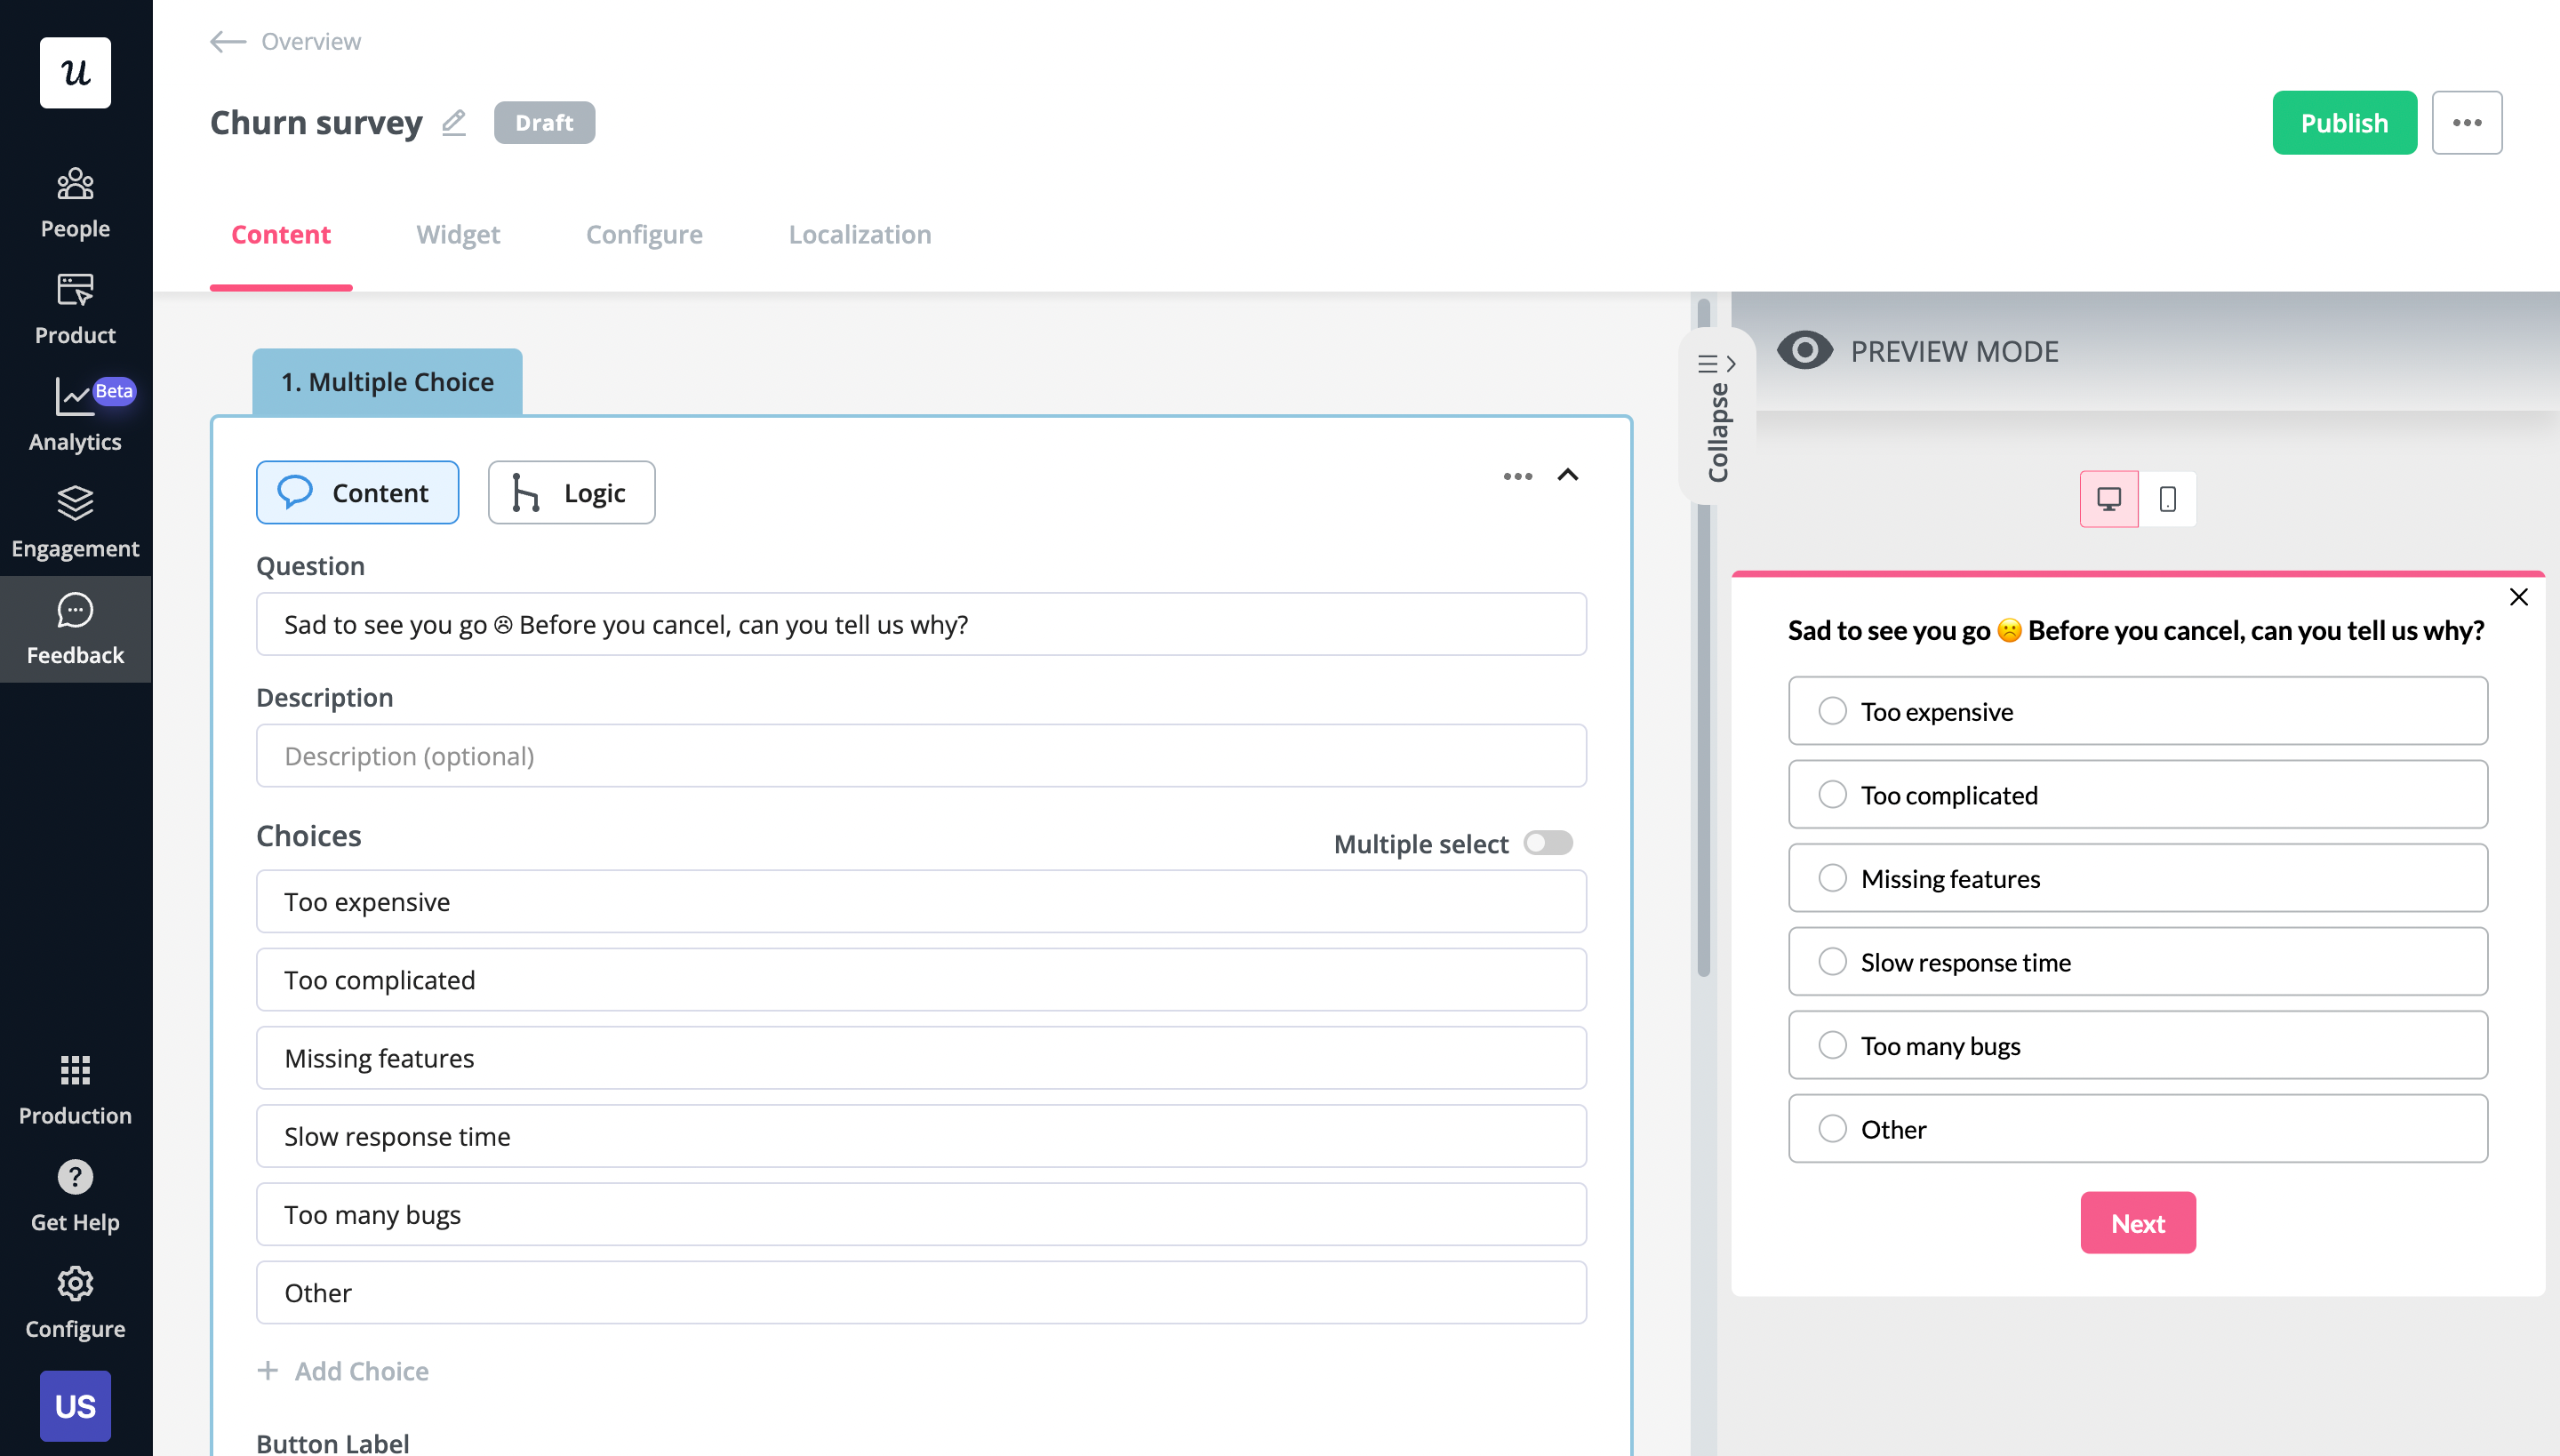
Next, show a personalized alternative based on the user’s answer to the first question to prevent churn.
Offer in-app self-service support to retain customers’
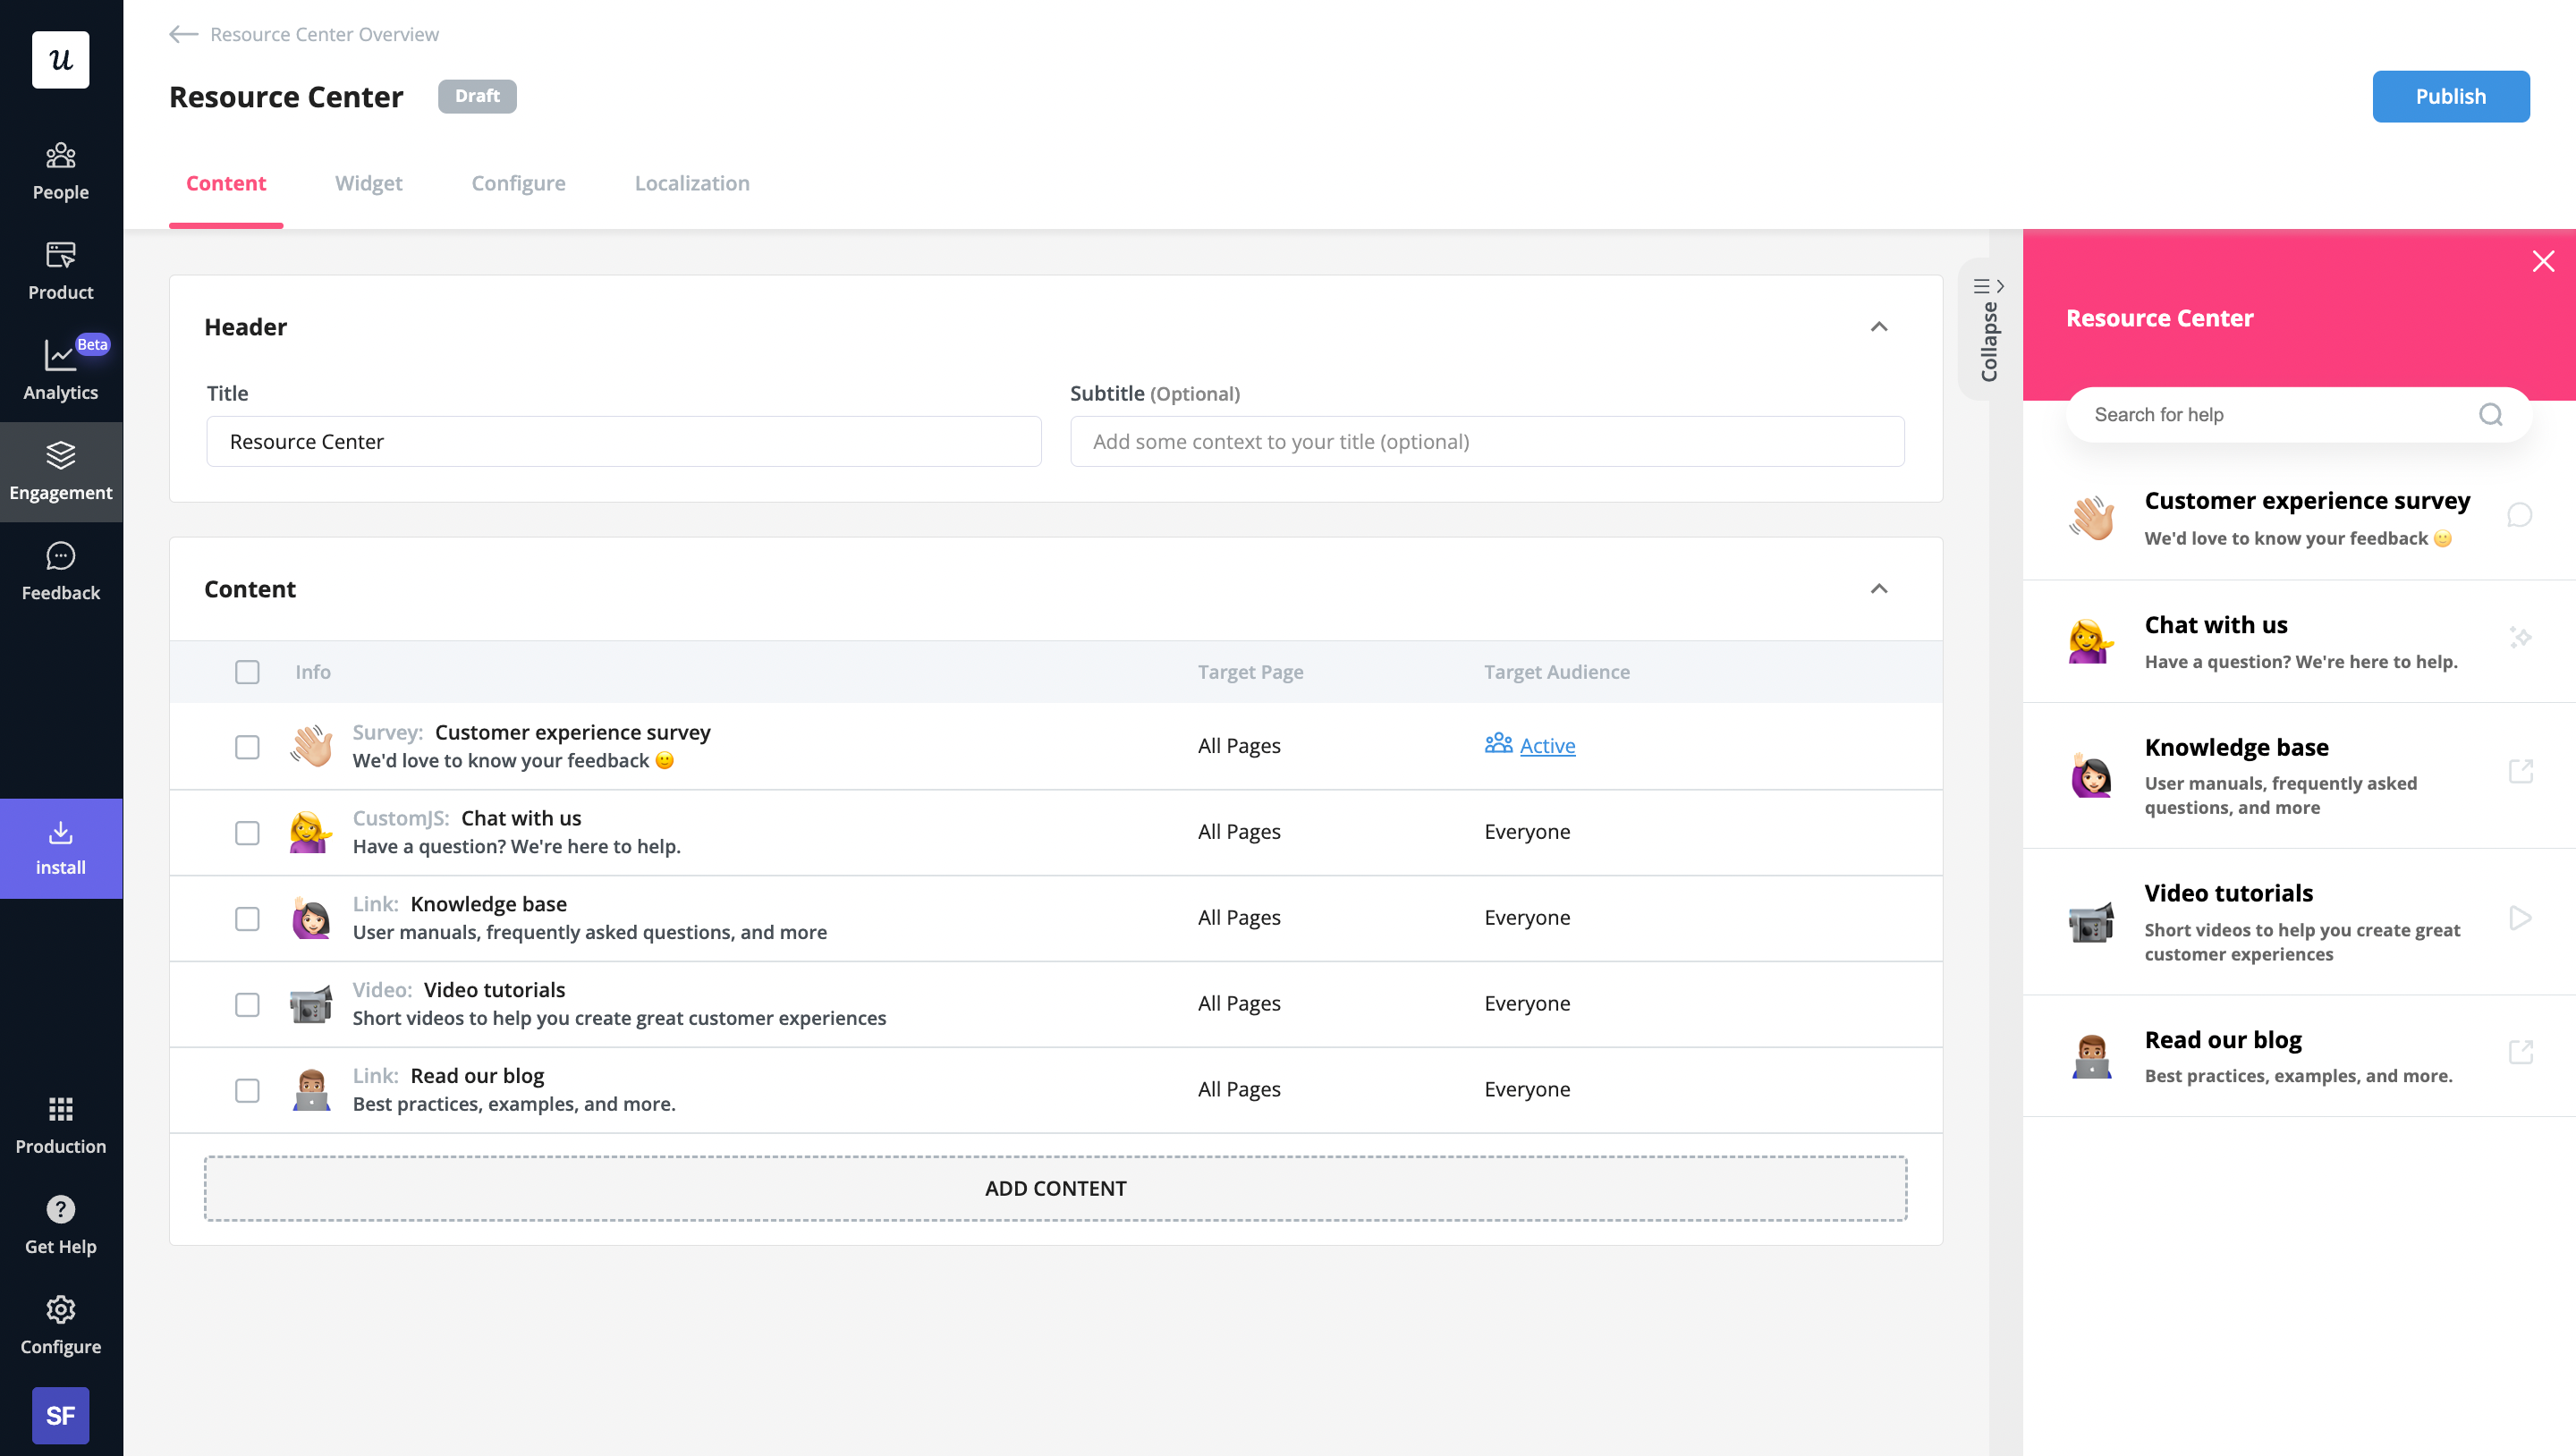
Adding a help widget can increase customer retention as users will have access to self-service support when they need it instead of waiting to get answers from your support team.
An in-app resource center can equip your users with multiple resources to facilitate problem-solving — documentation articles, guides, video tutorials, contact customer service rep if needed, etc.
You can easily build this inside your product and add resources relevant to your users, using Userpilot. Here’s how it might look.
Conclusion
Knowing your customer’s lifetime value or what user segment generates you big money is essential for your business to survive.
Conduct customer retention analysis and make your customers stick with you for good. For more resources, see our top 7 customer retention strategies post!
Ready to act on your retention analysis insights? Get a Userpilot Demo and get started.


