User Stickiness: What is It & How to Actually Improve User Engagement

In SaaS, stickiness meaning comes down to one idea, how often users come back because your product delivers ongoing value. A sticky product forms habits, boosts engagement, and reduces churn.
In this guide, we break down what stickiness means, how to measure it, and practical ways to increase it. Let’s dive right in
What is user stickiness?
User stickiness refers to how frequently a user engages with your product. Some teams also define customer stickiness as the number of repeat users who renew a subscription or make another purchase, reflecting how consistently customers return for value.
This meaning can vary by company or industry.
For example, a CRM might measure stickiness by comparing monthly active users (MAUs) to daily active users (DAUs). In contrast, a hardware store might rely on different engagement metrics, since daily visits are less common.
What’s your biggest challenge with user stickiness right now?
How are you currently trying to improve new user activation?
How do you analyze user behavior to improve stickiness?
Ready to see how you can fix your user stickiness issues?
Based on your answers, a personalized approach to in-app guidance and user analytics could dramatically improve your user stickiness. See how Userpilot can help you increase activation, improve feature adoption, and gain actionable insights.
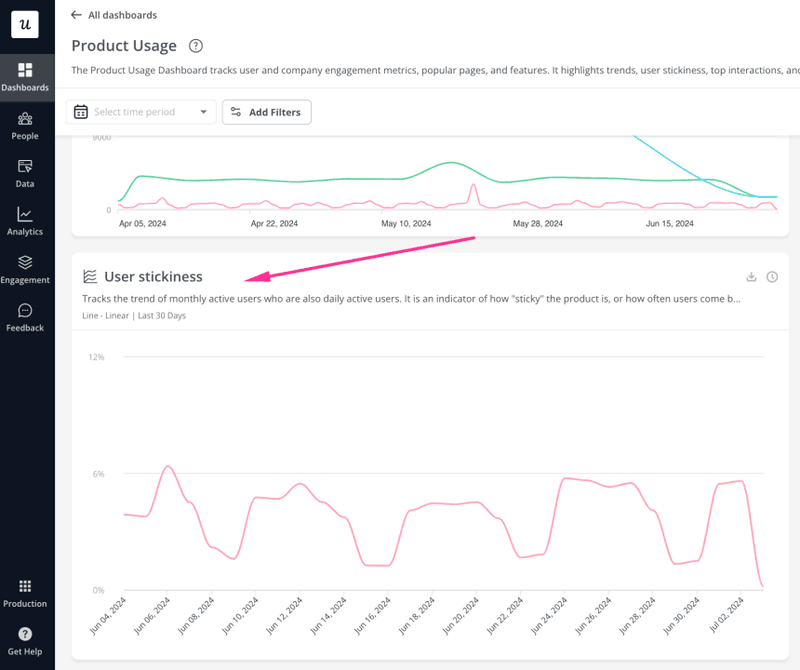
How to measure app stickiness
To measure a SaaS platform’s stickiness, divide the DAUs by MAUs. The closer the DAU/MAU ratio to one, the better the app’s stickiness.
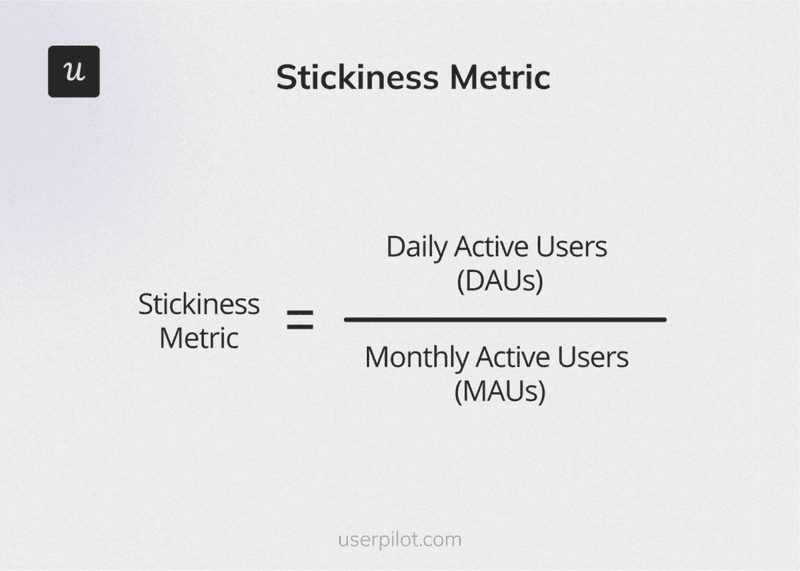
For example, with 12,000 MAUs and 6,000 DAUs, the customer stickiness is 0.5.
💡 A best practice would be to use a tool that tracks user stickiness for different segments and displays this data on an analytical dashboard.
Here are key concepts to keep in mind when calculating app stickiness:
Daily active users (DAU)
DAU refers to the total number of individual active users who use your platform and perform any action within a 24-hour period. Track this for applications that can be used daily, such as Asana or Slack.
Monthly active users (MAU)
MAUs are the number of unique users who perform specific actions on your platform within a 30-day period. If the number is lower than expected, consider strategies to increase monthly active users by enhancing your app’s value, like adding new features.
Customer lifetime value (CLV)
CLV refers to the value a customer brings to your business throughout their relationship with you.
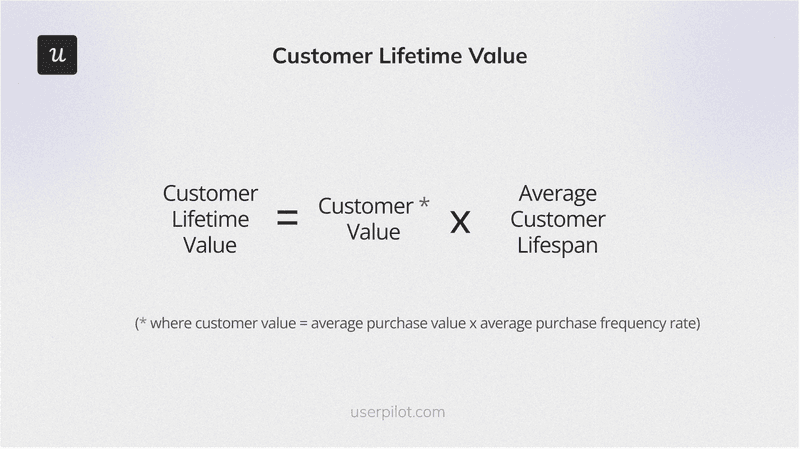
You should aim to increase CLV, as a higher CLV typically indicates lower customer acquisition costs (CAC).
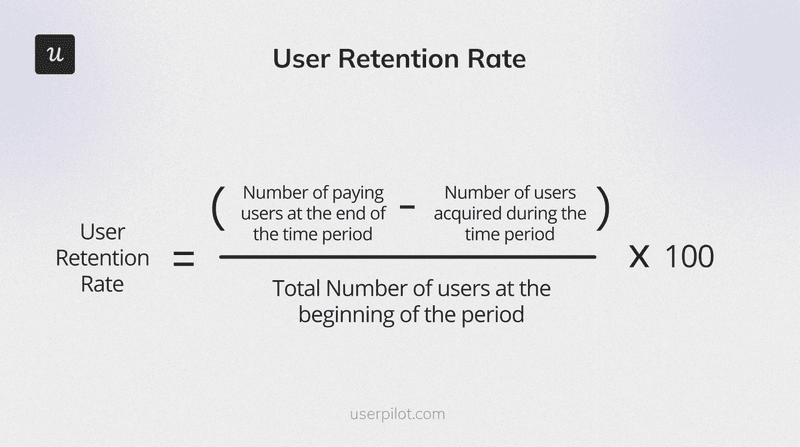
Customer retention rate
Retention rate refers to the percentage of monthly users you successfully retain after acquisition.
You can calculate your retention rate using this formula:
User stickiness vs user retention
The distinction lies in both the timeline and the behavior. Think of user stickiness as a measure of daily habit formation—focusing on the depth and frequency of engagement within a short window. In contrast, user retention acts as the long-term proof of that value, tracking the longevity of the customer relationship over time.
While they measure different outcomes, they are deeply connected. To ensure long-term loyalty, you first need strategies to increase product stickiness, as frequent engagement is the engine that drives sustainable retention.
How to enhance user stickiness
You can improve product stickiness by identifying your product’s value and tweaking your solution to provide more of it. Here are the steps to follow:
Step 1: Define your user personas
The first step to increasing product stickiness is understanding your users in-depth. Conduct market research to define your user personas, including details such as:
- Who they are — their demographics and professional background.
- Where they work — their industry, company size, and role.
- Pain points — the challenges they face in their daily work.
- Goals — what they aim to achieve and how your product can help.
- Collaboration style — how they work with others.
- Jobs-to-be-done (JTBD) — the tasks they need to complete and the problems they need to solve.
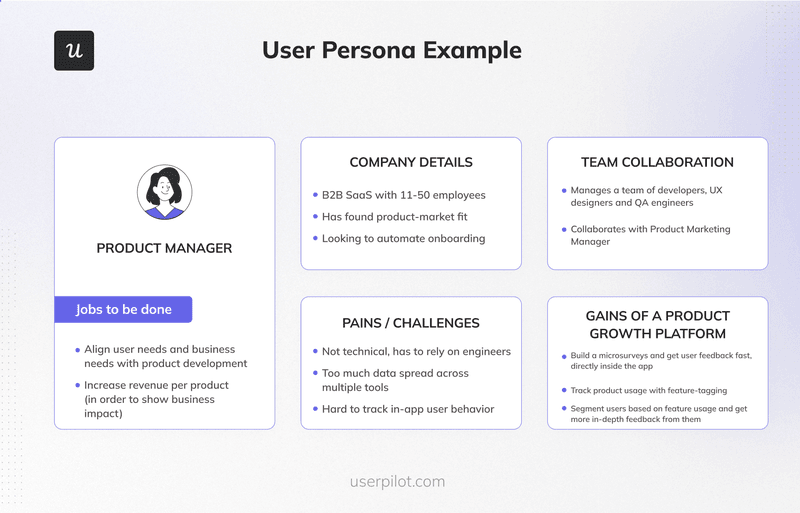
By understanding your users’ pain points and goals, you can create tailored solutions that effectively address their specific needs and challenges.
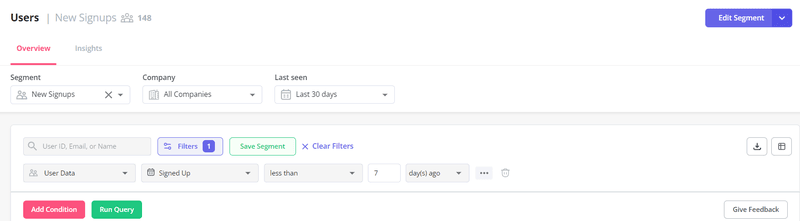
Step 2: Segment new users into those personas
Once you’ve identified what’s valuable to each persona, the next step is to segment new customers into these personas.
This can be achieved by creating welcome surveys with questions about the user’s needs, preferences, and roles.
Then, automatically assign each new customer to a specific persona based on their survey responses. This allows you to personalize the onboarding experience for each user segment.
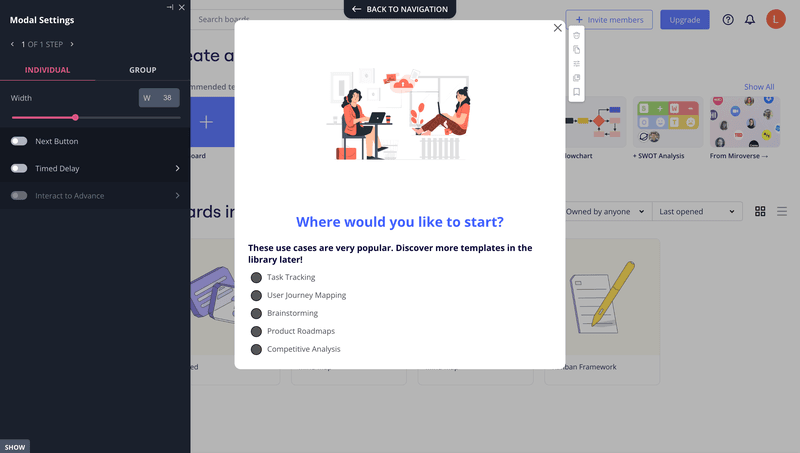
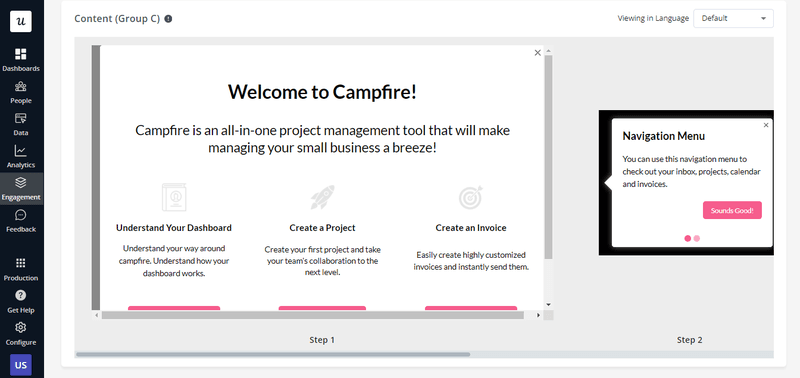
Step 3: Create personalized onboarding flows for each segment
Use each segment to craft personalized onboarding flows based on their specific needs.
Trigger customized onboarding checklists and in-app help such as interactive walkthroughs based on the survey responses collected in the previous step. Encourage self-service support and add links to your resource center.
Your goal should be to deliver personalized experiences right from the start. By doing so, you engage users effectively from their first interaction with your app, which increases the chances of them becoming sticky users.
Step 4: Implement best practices
You may need to evaluate your UI/UX and make changes to adopt best practices and improve user stickiness. You can try these strategies:
- Simplifying the UI: A cluttered or counterintuitive interface can cause users to drop off. Design your UI to be clean and intuitive, following user experience interaction guidelines. Explore UI examples of well-designed and user-friendly applications for inspiration.
- Offering timely and relevant in-app messages: If users need to decode the platform every time they open it, they will likely log out and drop off. Guide your users with timely in-app tutorials, tooltips, or walkthroughs to help them understand your product better.
- Encouraging engagement through gamification: Add gamification techniques to make your app more engaging. Consider adding features like an onboarding checklist with completion scores, badges, prizes for completing tasks, or collaborative streaks. These ideas can make your application more enjoyable, causing your users to use it more frequently.
- Providing seamless integration with other tools: Build integrations with the apps your users commonly use. This allows users to perform multiple tasks within a single platform without needing to switch between tools.
- Offering incentives for milestones achieved: Reward active users with incentives such as discounts after reaching certain thresholds or temporary access to premium features. This can keep users engaged and motivated to explore your platform.
Step 5: Track how users behave
You should track how different segments behave within your app to identify any trends or friction points. This information allows you to address these challenges and offer a better experience.
With Userpilot, you can build different reports to analyze customer behavior at different stages of the journey, including:
- Trends reports: Analyze how your users perform specific events. This report helps you identify behavioral patterns and spot friction points. By collecting this data, you can improve engagement or fix problems that cause users to drop off, thereby increasing stickiness.

- Path analyses: Understand how each segment navigates your product by reviewing actions before or after an event. This analysis helps identify behavioral patterns, understand how users interact with the UI, and spot where they drop off. With this data, you can build a more intuitive user experience, increasing the chances of users sticking to your product.

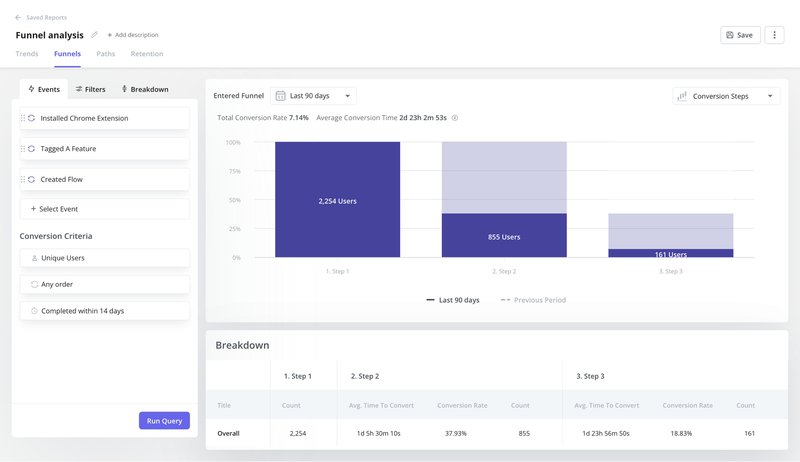
- Funnel reports: Analyze how your customers act and move through the funnel, and see how many do it as you intended. This report provides a clear view of the user’s journey, highlights bottlenecks and friction points, and shows which stages impact conversions the most. A smooth conversion process can increase user satisfaction and the likelihood of repeated use.
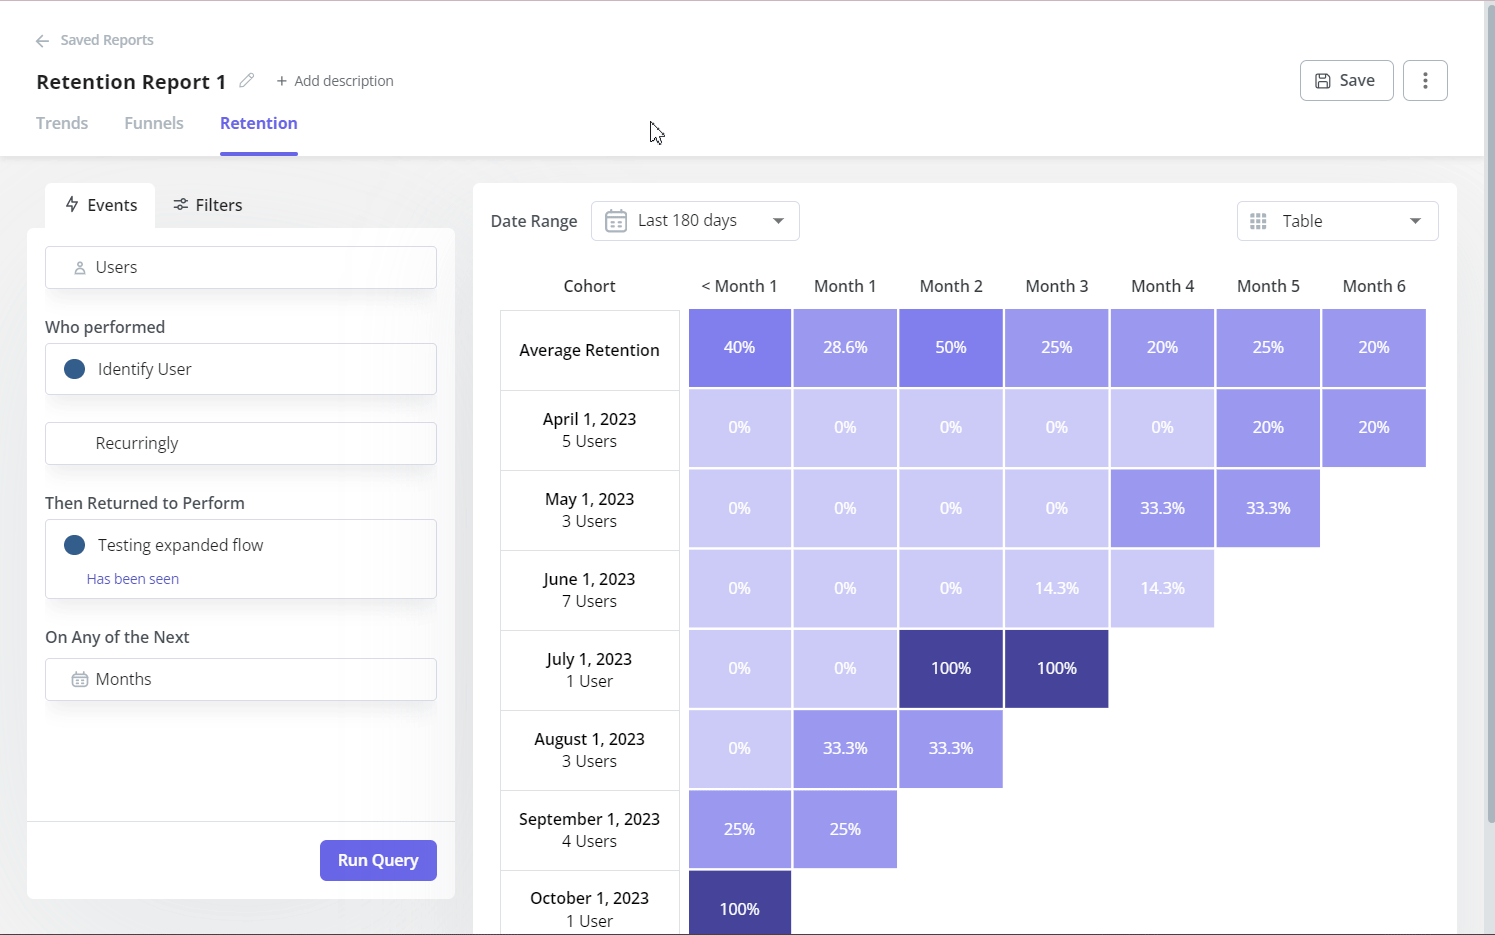
- Retention analyses: Track your product’s retention rates across a specific time frame. This report helps you identify user engagement patterns, spot your most loyal users, and measure user satisfaction. By identifying and engaging your most loyal customers and addressing the needs of those who may be disengaged, you can boost stickiness.
Step 6: Collect user feedback for more qualitative data
Hard metrics alone don’t always provide a complete picture of your users. To gain a better understanding, you need to gather qualitative feedback about your product.
You can do this by adding in-app surveys with open-ended questions or conducting interviews. However, interviewing customers is time-consuming and expensive.
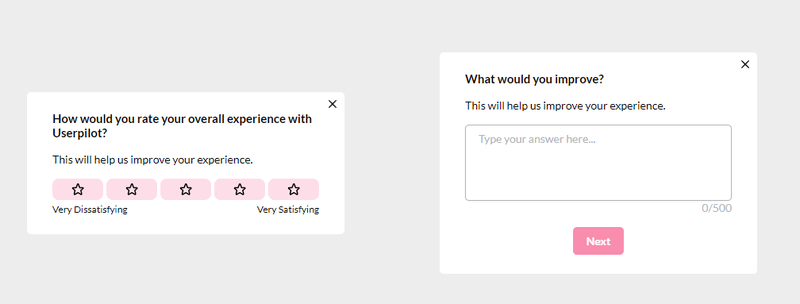
Build in-app surveys for different segments by designing the survey’s flow, implementing your branding, adding questions, choosing how to trigger the survey, and selecting your target audience.
Here are some examples of user feedback surveys you can create:
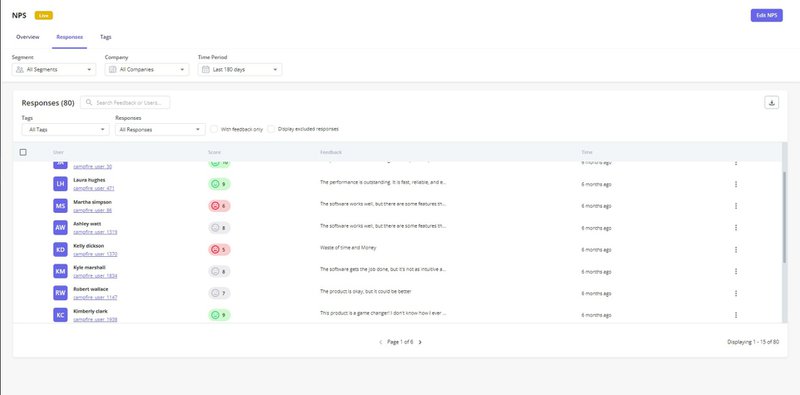
- Net Promoter Score (NPS) to measure how likely users are to promote your product.
- Onboarding surveys to identify any friction points or areas of improvement in your onboarding process.
- Open feedback forms where users can share what they would like to see in the app or make feature requests.
- General satisfaction forms to collect user feedback on the overall experience of your product.
- Customer effort scores (CES) to see how easy it is for users to navigate your platform.
Collecting and analyzing qualitative feedback can help you identify “why” users behave the way they do or generate ideas for improving your product’s experience.
Step 7: Increase the value of your product based on the insights from the analysis
Finally, analyze all collected data to gain insights into your product’s value. During this step, pay close attention to friction points, underused features, and customer support. Analyze exactly what makes your app difficult for customers, what things they could be doing but aren’t, and how easy it is for them to get the answer they need.
Often, products don’t lack value. Instead, it’s simply a matter of poor communication. So, analyze your data and come up with an action plan to better explain what users can do with your product.
For example, you can add in-app messages to promote an unused feature or a direct link to your resource center.
How Userpilot helped these companies increase user stickiness
We empower businesses to increase customer satisfaction by adding in-app experiences.
Here are three examples of how we helped companies increase app stickiness and activation:
The Room increased new user activation by 75%
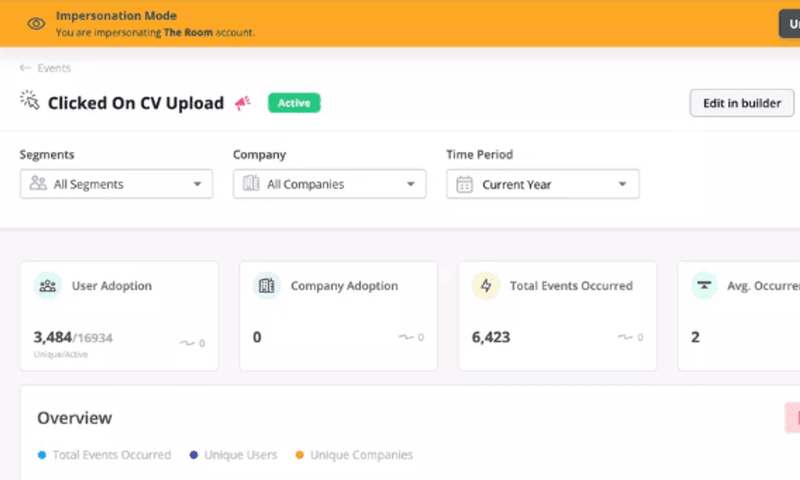
The Room is a digital platform that aims to connect young African tech workers with job openings by offering “talent as a service”.
While this company had a great mission, new members were not uploading their CVs, which made it difficult for The Room to connect talent with employers.
The company started using Userpilot to build an in-app onboarding flow that encouraged users to upload their CVs by triggering an interactive walkthrough. This intervention led to a:
- 75% increase in new user activation with CV uploads within 10 days.
- Increase from 200-210 to 300-350 new activated users per week.
- 88% engagement rate.
Read The Room’s case study.
Attention Insight improved user activation by 47%
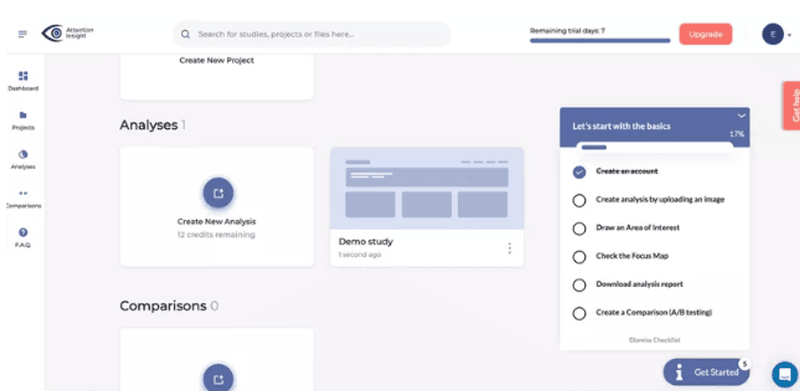
This is an AI-powered tool that conducts heatmap analysis for websites, ads, and designs. The company struggled with low user activation rates during free trials, with only 47% creating a heatmap analysis and 12% using the “Areas of Interest” feature.
It started using Userpilot for interactive walkthroughs, onboarding checklists, and contextual education to guide users through key actions and enhance feature engagement. This led to:
- User activation rates for heatmap creation increased from 47% to 69%
- Engagement with the “Areas of Interest” feature rose from 12% to 23%.
- Higher trial-to-paid conversion rates and potential revenue growth.
Read Attention Insight’s case study.
Sked Social tripled conversions
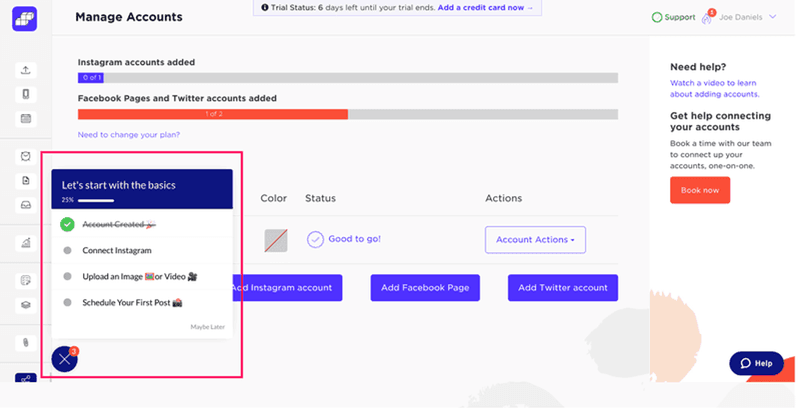
Sked Social, a social media management platform, had low user conversion rates from free trials to paying customers.
It joined Userpilot and implemented a strategic onboarding checklist, incorporating psychological techniques like progress bars and “endowed progress.”
This led to a significantly higher conversion rate as users completing the checklist were three times more likely to become paying customers.
Read Sked Social’s case study.
Conclusion
Since you can’t fake user stickiness, you need a holistic approach to improve this number. This means analyzing your hard and soft user behavioral data and identifying friction points or unused features. Then, come up with a plan to either improve or better communicate your product’s value.
As you’ve seen in the case of The Room, sometimes users just need a little guidance to perform actions and stick to your product. You can add those in-app interventions seamlessly and without writing any code with Userpilot. Get a demo today!
About the author