Transform Data Into Growth with the
Most Actionable Product Analytics Platform

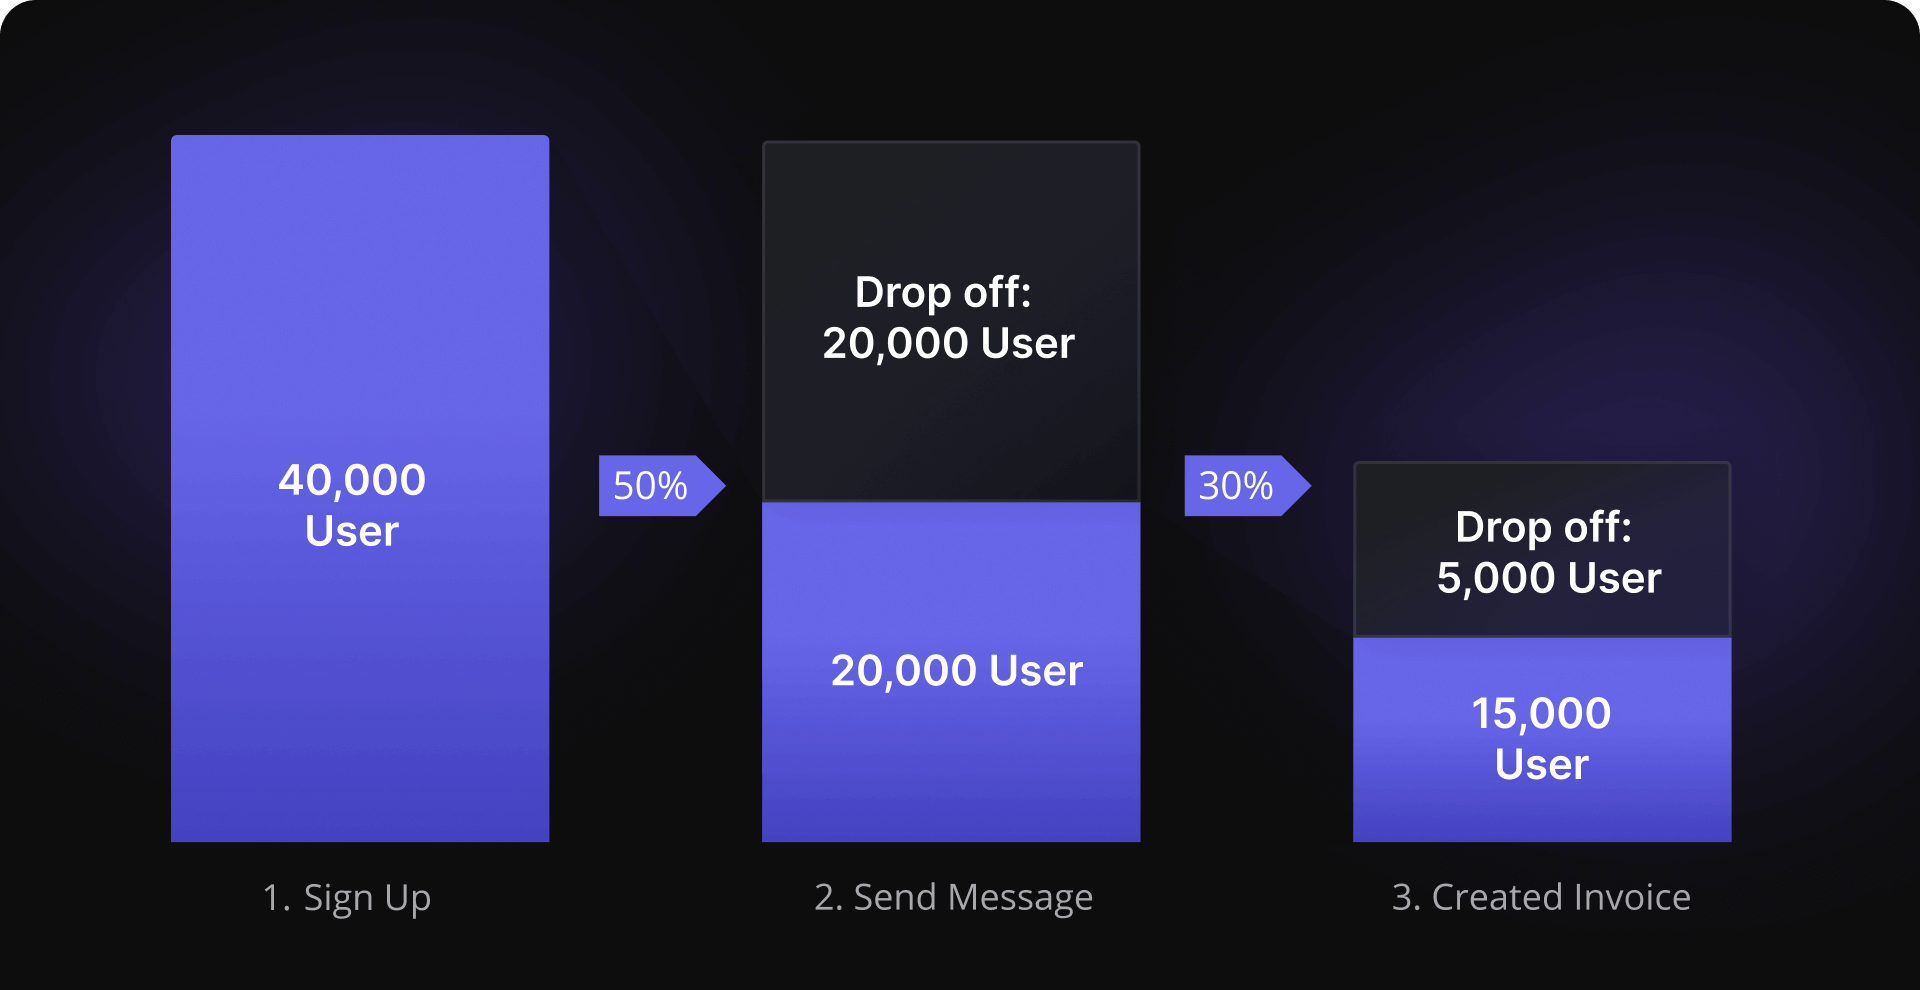
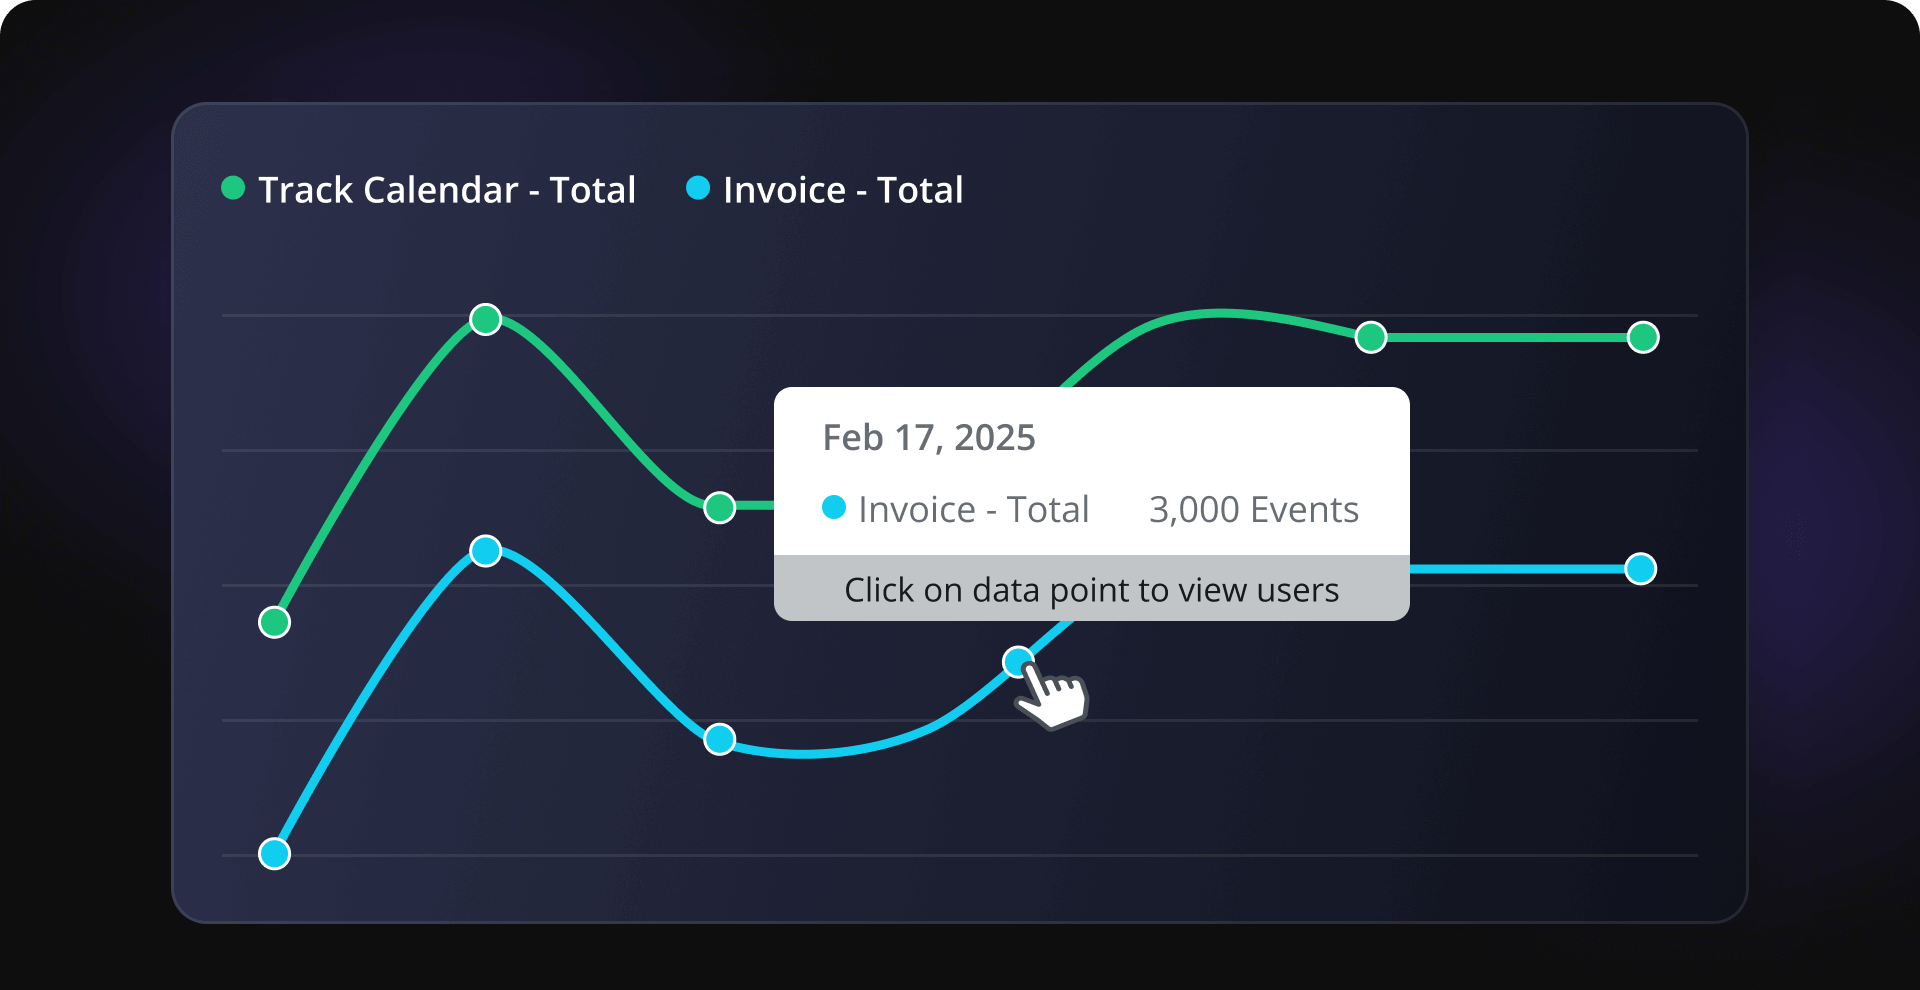
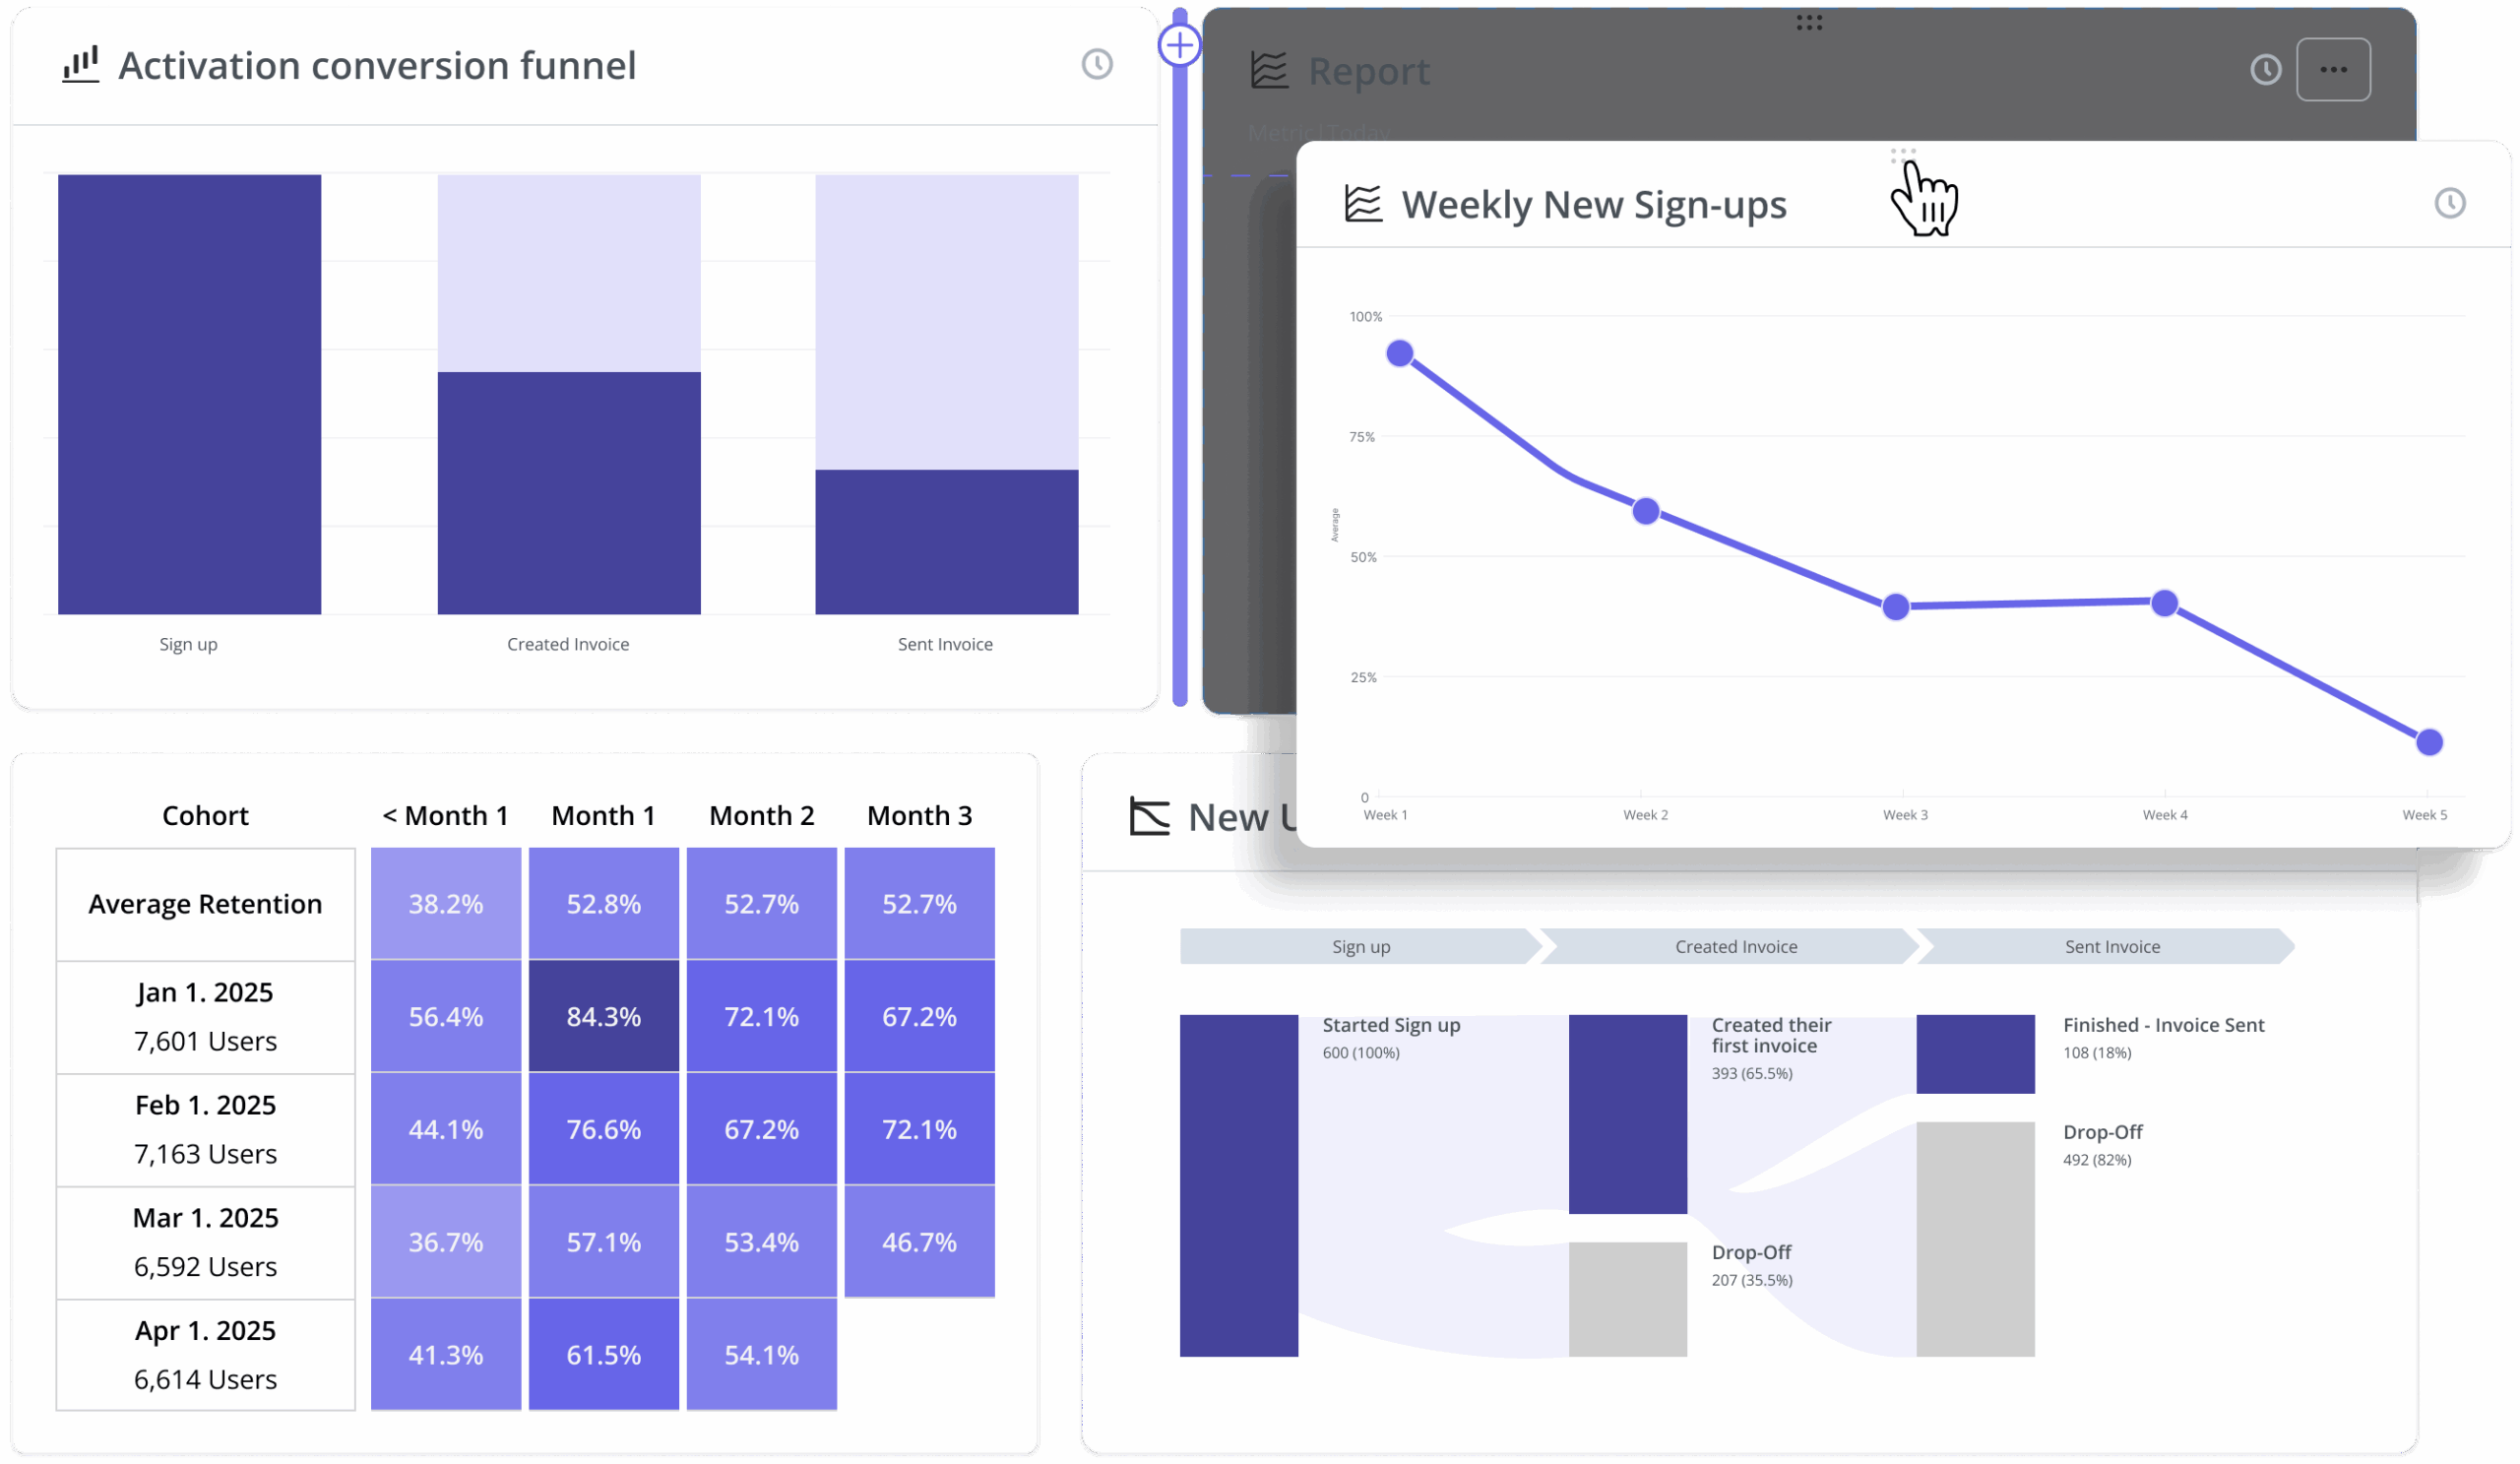
Stop guessing what drives growth
Find the friction, then remove it
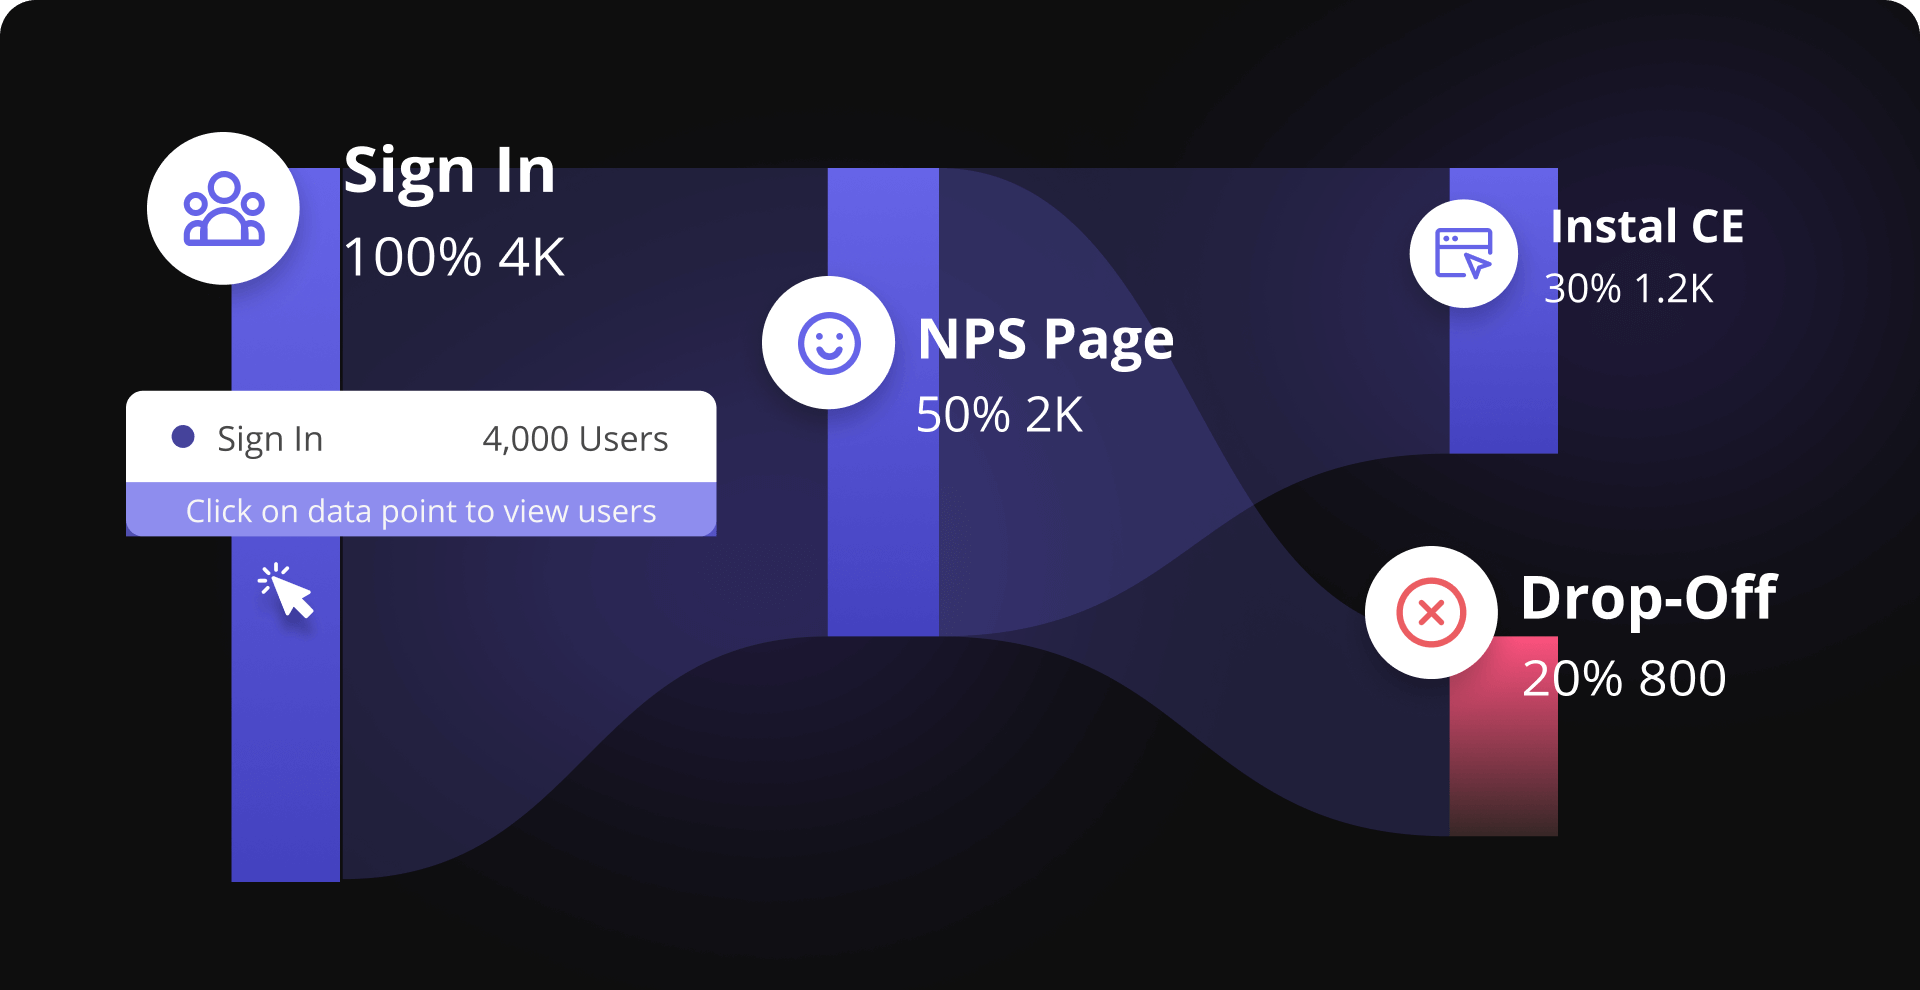
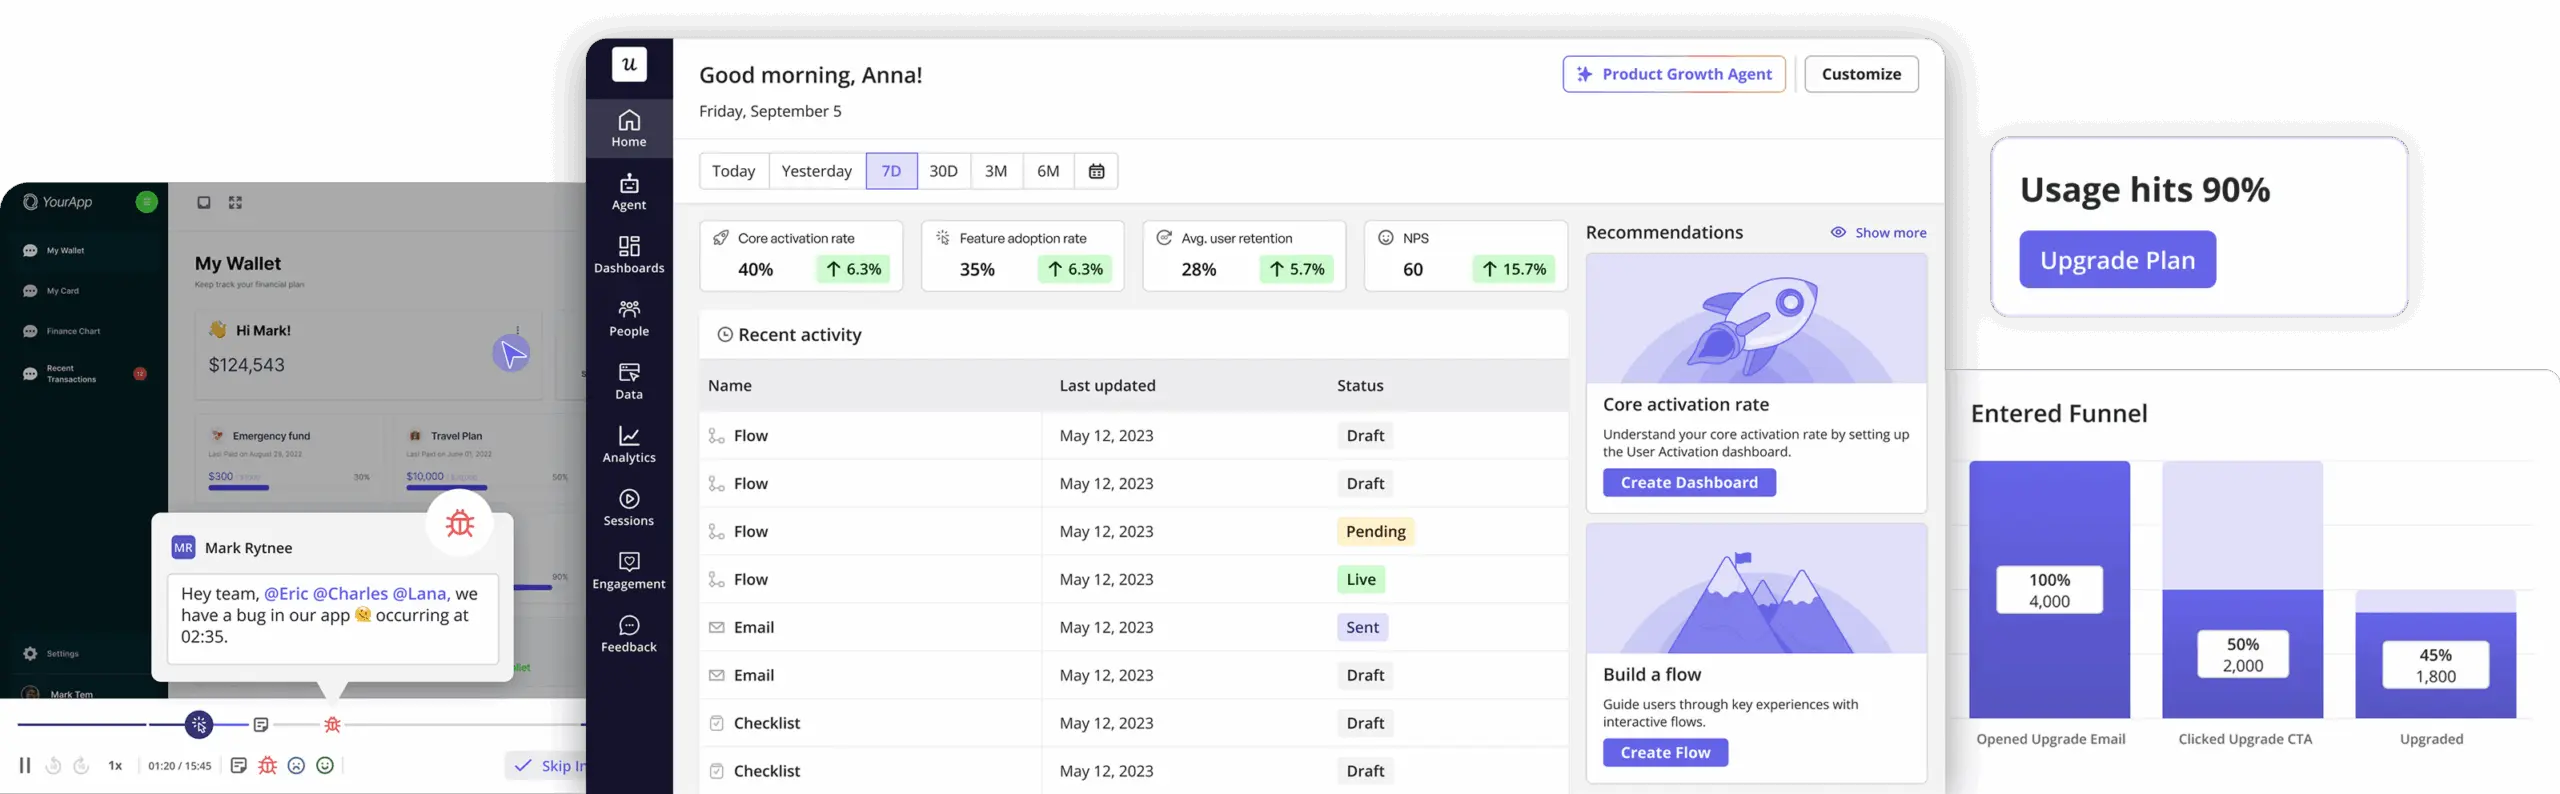
See the product through your users' eyes
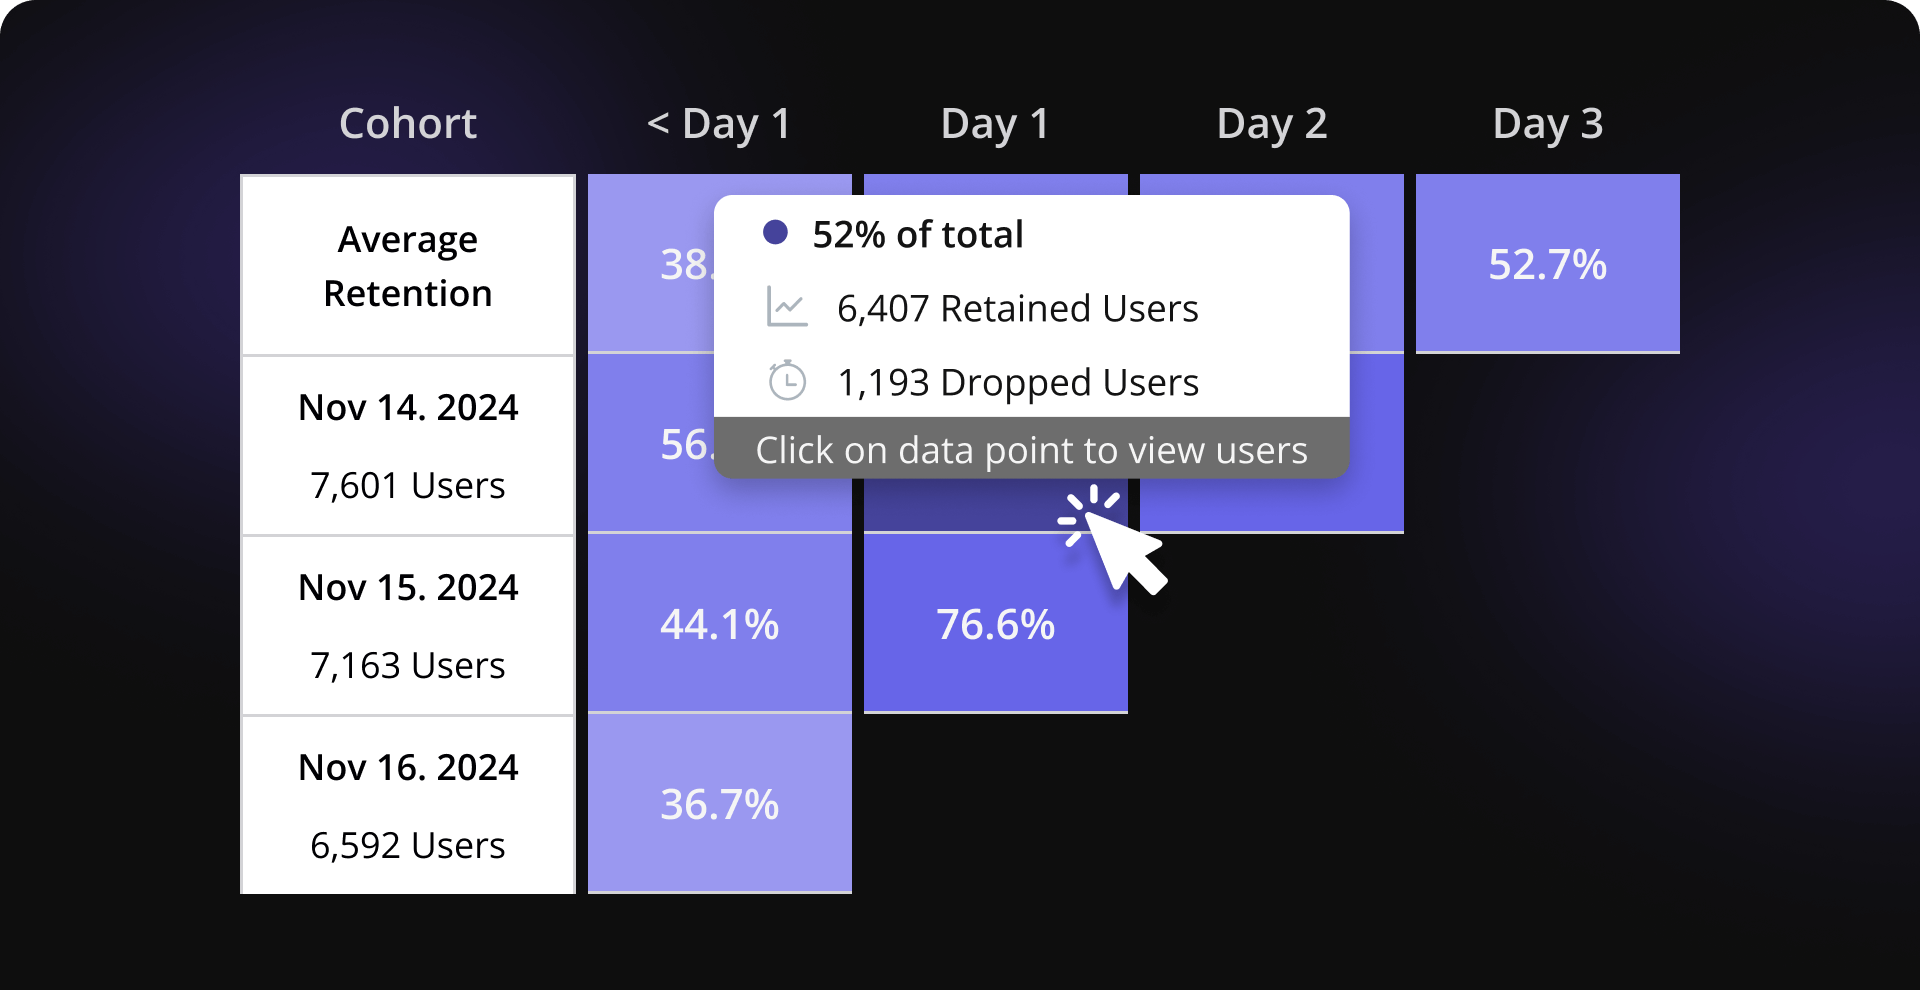
Turn passive insights into active retention

Join 1,000+ companies that are Accelerating Product Growth with Userpilot

Go From "Insight Discovered" To "Problem Solved" In Minutes

Userpilot integrates advanced analytics with a powerful engagement layer. Spot a drop-off in your funnel, watch the session replay to confirm the issue, and launch an in-app fix to resolve it, all in the same session.

Funnel analysis

Don’t just watch conversion rates flatline

Use granular funnel reports to pinpoint the exact step where users abandon their journey. Once you identify the bottleneck, launch targeted tooltips or checklists to guide users past the hurdle without writing a single line of code.

Trend analysis

Move beyond vanity metrics

Visualize adoption trends over time to separate the features that drive upgrades from the ones gathering dust. Instantly isolate the specific behaviors that correlate with your highest-value customers so you can double down on what works.

Path analysis

Trace the real routes users take

Forget the “happy path.” Visualize the messy, non-linear journeys your users actually follow. Uncover hidden shortcuts, circular loops, and unexpected drop-offs, then redesign your navigation to guide every user onto the most efficient path to value.

Retention (cohort) analysis

Data is useless if it doesn’t save customers.

Segment users based on their activity levels and automatically trigger re-engagement flows the moment a user shows signs of slipping away. Proactively boost retention by solving user problems before they result in churn.

Why top SaaS leaders choose Userpilot analytics?​

Answer questions you haven’t even asked yet

Get retroactive answers without the engineering debt

Traditional analytics require you to predict what to track before you launch. Userpilot flips the script by indexing every interaction retroactively. When a new hypothesis strikes next month, you don’t need to wait for new data—the historical evidence is already there. developer bottleneck.

Build a command center for your specific goals

Filter out the noise to focus on North Star metrics

Generic “out-of-the-box” reports often hide the signal in the noise. Construct bespoke dashboards that filter out vanity metrics and zoom in on the specific health indicators that matter to your current OKRs—whether that’s activation velocity or expansion revenue.

Best analytics tool I have ever worked with

It is the most useful analytics tool I have ever seen in software industry. It has many good features like survey forms, onboarding tools, funnels, integrations etc. and also it is very easy to use as it is beginner friendly.

Anandkumar P.

Information Technology and Services Company

Userpilot helps us uncover growth patterns

Userpilot helps us learn where to focus and understand what our users are doing. The most important thing is to track user behavior as they interact with our product, and link that back to upgrading from free to paid, and to retention, so that we can identify the patterns exhibited by our most valuable customers v. our least.

Sue M.

FeedXL Horse Nutrition Calculator

Watch the reality behind the retention charts

Layer qualitative evidence over quantitative data

A drop-off rate is just a number; a frustrated user is a story. Layer video evidence over your quantitative funnels to see exactly how UI confusion manifests in real-time. Spot the hesitation, the rage clicks, and the errors that spreadsheets simply cannot show you.

Resolve user identity across every touchpoint

Create unified profiles for a fragmented user journey

Your users don’t think in “sessions” or “devices.” They just want to get the job done. We unify disparate data streams into coherent, single-user profiles

Consolidate your data across platforms and tools

Get a holistic view of user behavior across platforms

Userpilot unifies mobile and desktop data, giving you a complete view of user behavior across platforms to make smarter, data-driven decisions.

Security standards at Userpilot

As a vendor that processes millions of data points on a daily basis, we take our customers and their users’ data very seriously.

Our data is fully encrypted, managed, and stored by SOC-compliant vendors such as Amazon AWS and Google Cloud.

FAQ

3 major ways:

  1. All-in-one platform: Unlike other Product Analytics platforms, Userpilot is an all-in-one platform that combines product analytics with user onboarding and in-app surveys. This helps you reduce your tech stack, maintenance headaches, and costs. 
  2. Event auto-capture: Your events are captured automatically, without any coding. You don’t need to chase your developers to track events!
  3. Priced by MAUs, not events: Your invoices are predictable and consistent as it’s easier to predict the number of Monthly Active Users (MAUs) than events. Not just that, our pricing is more affordable than most Product Analytics, especially when you consider the cost of purchasing onboarding and survey tools.

Because it’s far easier to predict the number of monthly active users (MAUs) than events per month. Your invoices remain fairly consistent and you pay less than other tools that charge by events.

Userpilot combines 3 tools: Product Analytics, User Onboarding, and In-app Surveys.
This means you not only track product analytics but also take action with that data, such as by running a survey for dropped-off users in the funnel or creating a better onboarding experience to improve retention.

Trends: Visualize the usage of your features over time 

Funnels: Identify and reduce drop-offs within your product 

Paths: Track user routes before or after any event 

Retention: Track and improve the stickiness of your product

Dashboards: Create dashboards to keep track of key metrics at a glance 

Session Replay: Replay a user’s journey within your app

Besides these reports, you also get auto-capture events, which lets you track your events without any code.

All 3 modules are inter-connected:

For example, you can track data with Product Analytics, and then create a survey or in-app experience to improve the metrics.  

Or the other way: Create a survey or in-app experience and track its performance with Product Analytics.

Some of the KPIs you can improve are: 

  • New user Activation 
  • Feature Adoption 
  • Retention
  • Customer lifetime value 
  • Trial-to-paid conversion rate 
  • Net Promoter Score (NPS)

Turn Passive Data Into Immediate Product Action

Get a Demo No credit card required