A User Behavioral Analysis Guide for LLM-Led Product Teams


Behavioral analysis is one of the most powerful tools a product team has. It’s also one of the most time-intensive: pulling reports, configuring segments, watching session replays, and trying to isolate the behavioral pattern that explains why users drop off or fail to reach activation.
AI is changing how much of that work you have to do manually. That’s what this guide is about.
I wrote it to cover three things:
- How AI is changing the behavioral analytics workflow.
- The behavioral analysis methods that still matter most.
- A 5-step process for running behavioral analysis with AI assistance.

What behavioral analysis involves (and where AI is helping)
User behavior analytics (UBA) is a research practice that involves collecting, organizing, visualizing, and interpreting data about how users interact with your product at different stages of their journey. The goal is to find the behavioral patterns that explain outcomes: why some users activate and others don’t, why a feature sees strong adoption in one segment and weak adoption in another, why a cohort that looked healthy in month one churns in month three.
The challenge is scale. Analytics platform Conviva found that 67% of consumers follow non-linear paths to purchase, so finding the signals that matter (e.g., the drop-off point that correlates with churn, the activation action that predicts 90-day retention, the friction moment costing you conversions) requires someone who knows where to look and has the time to look there.
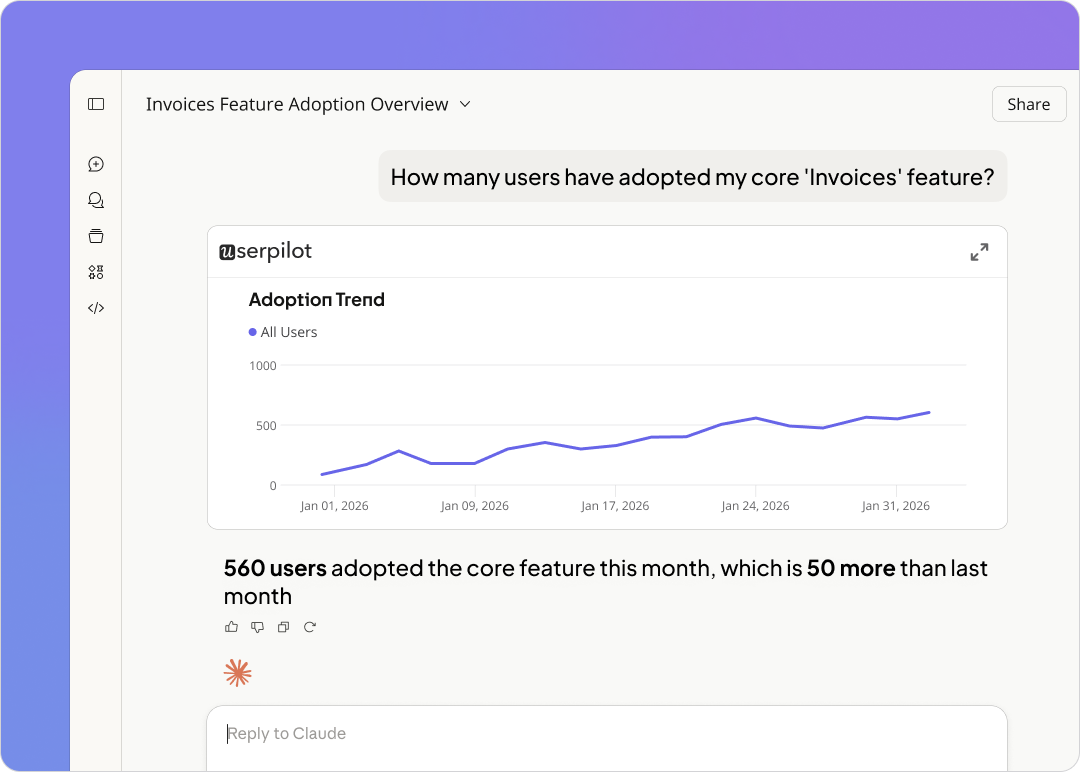
AI is changing this by operating at a layer that humans can’t: continuous monitoring across every metric, every segment, every account, simultaneously. Tools like Userpilot’s Lia can monitor product health in real time, surface behavioral anomalies as they appear, analyze survey feedback at scale, and flag customer churn signals before they show up on a churn list.
How AI is supporting the behavioral analytics workflow
AI is taking over the part of behavioral analysis that was always the most labor-intensive and least strategic: finding signals.
Here are the specific ways AI is changing the analytics workflow now:
- Natural language querying of behavioral data: Instead of configuring a custom segment in your analytics tool or learning SQL, you ask in plain language: “Show me accounts where feature usage dropped more than 30% in the last two weeks.”
- Autonomous anomaly detection: AI agents monitor your behavioral dashboards continuously, so when a metric moves outside its baseline range, an alert surfaces immediately.
- Pattern detection across thousands of sessions: AI can now identify common paths, unexpected sequences, and behavioral clusters across thousands of sessions without a human reviewing each one.
- Hypothesis generation from data artifacts: You can now ask AI to generate plausible explanations for what the data shows. I often use AI this way: I take a screenshot of the report and share it with AI, so we can find out how to solve the problem and brainstorm ideas together on how to find a solution.
- Autonomous analysis pipelines: Platforms like Matillion are building AI agents that can execute the full data analysis lifecycle without explicit instruction: connecting to a data source, identifying patterns, generating a report, and surfacing the key finding.
- Agentic workflows: AI agents connected to your analytics platform via MCP can now act based on data. When a user’s behavioral pattern shows friction, an agent can trigger an in-app intervention directly: a checklist, a contextual tooltip, a proactive outreach flow.
That said, AI still lacks product context. Userpilot’s AI agent Lia can monitor product health continuously, surface behavioral anomalies, analyze survey feedback, and flag churn signals. But she does not decide what to act on.
Kevin O’Sullivan (our Senior Product Designer) put it directly: “The decision-making is still going to be human.” An AI agent can tell you that a feature’s drop-off rate increased 18% last week, flag the accounts affected, and surface the behavioral patterns that preceded it. It cannot tell you whether that matters for the roadmap decision at hand, whether the right fix is a UX change or an in-app message, or whether the drop-off reflects a known configuration change that doesn’t need intervention. Those calls require someone who knows the product, the customers, and the business.
The behavioral analysis methods that are still relevant
With AI handling the signal-detection layer, you’re left with the core question of behavioral analysis: what are your human users actually doing? Here are the six methods we use most at Userpilot, with specific examples of what they’ve revealed.
Feature usage dashboards
Feature usage dashboards track adoption, frequency of use, time-on-feature, and engagement by segment. They’re the first thing to check after a release, and they’re also where the most common misreading in behavioral analysis happens.
Here’s a clear example from my own work. When Userpilot launched mobile support, initial adoption looked low. The data showed that only 10% of all our customers were using the mobile feature. But then I asked one question in a survey, “Does your company support a mobile application?,” The answer changed the frame entirely. Instead of saying only 10% of all customers were using mobile, I could say that 25% of customers who had a mobile application were using the feature. It’s much more helpful to analyze relevant groups of users.
This is where behavioral segmentation (i.e., grouping users based on shared actions or characteristics) makes usage data actionable. The segment I created (customers who have a mobile application) is a behavioral group. Without it, the numbers are averages that flatten meaningful differences in user engagement across your customer base.
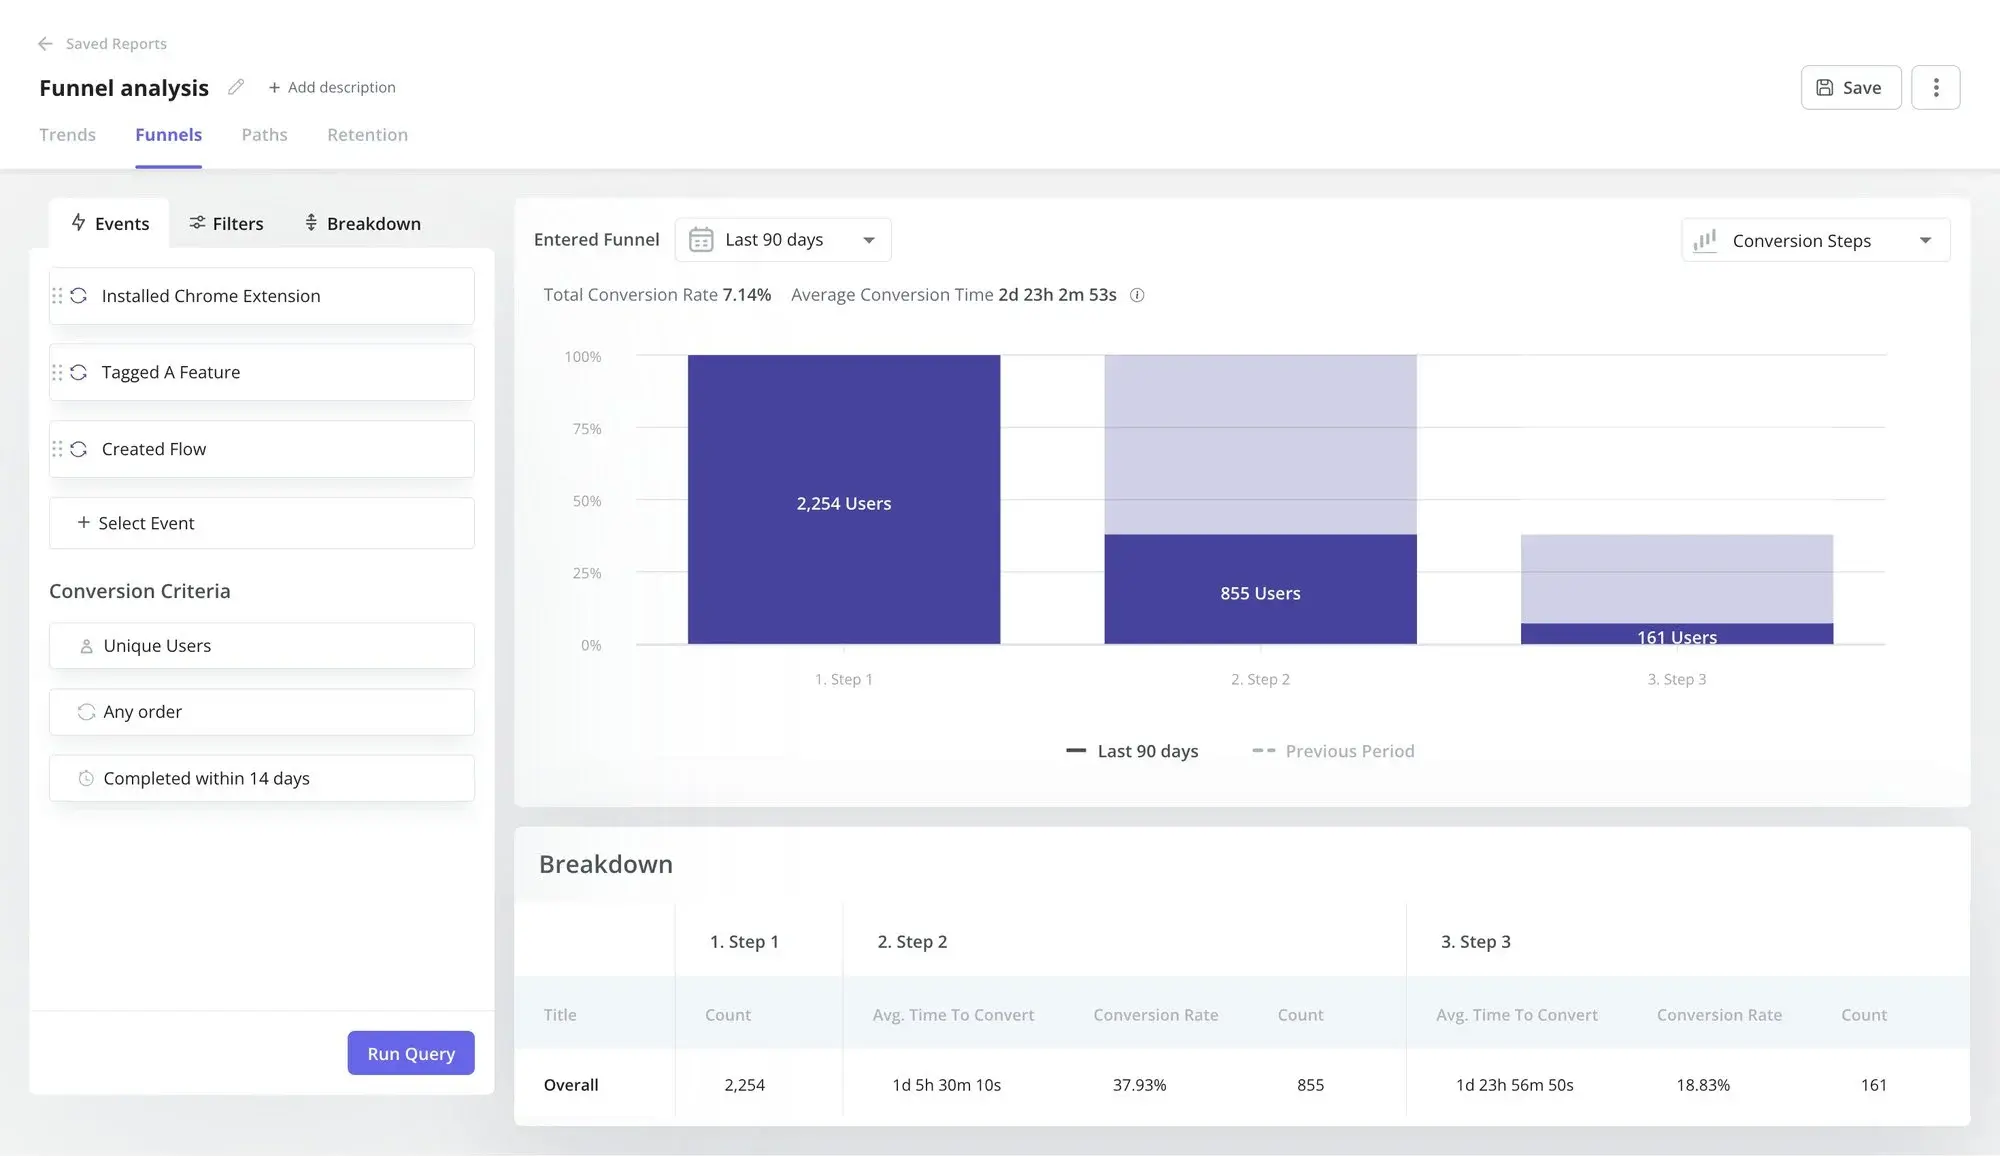
Funnel analysis
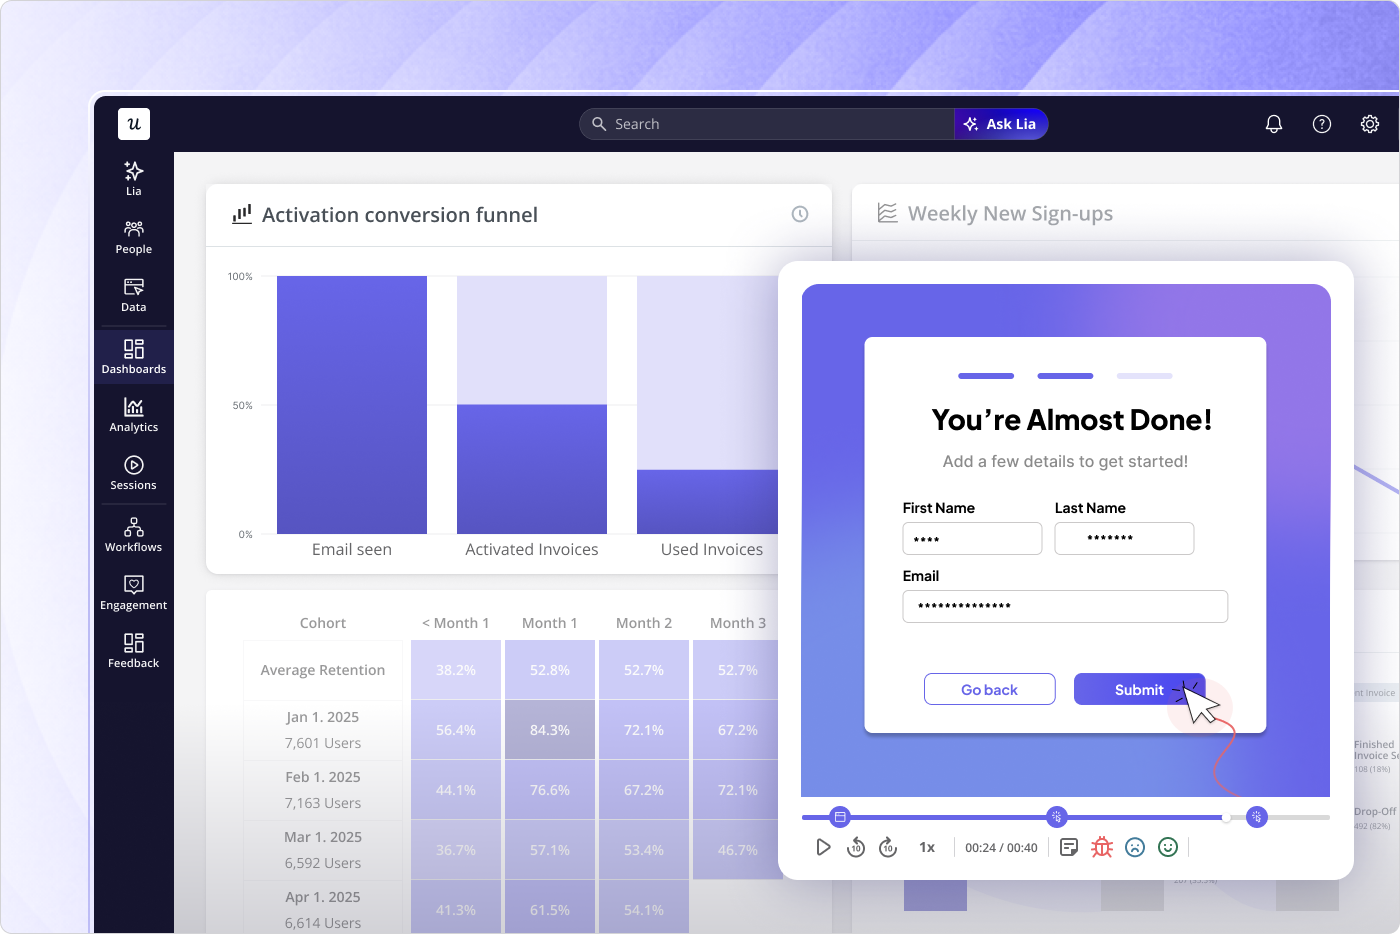
Funnel analysis tracks conversion rates at each stage of a workflow and identifies where users drop off. It’s the starting point for any activation or onboarding investigation because it answers the first question fast: where is the friction?
For example, Kevin O’Sullivan described how Userpilot’s email feature funnel shaped the team’s approach. “We saw a huge drop-off at domain verification. Users had access to the feature, but they weren’t activating their domain, and that step is crucial to unlock email. And the time lag between domain verification and adding an email address was 60 days.”
As the PM, my response was to build an in-app checklist that walked users through domain verification step by step, with contextual nudges at each point where users were getting stuck. I shipped it within hours of confirming the problem, which solved the problem immediately.
Path analysis
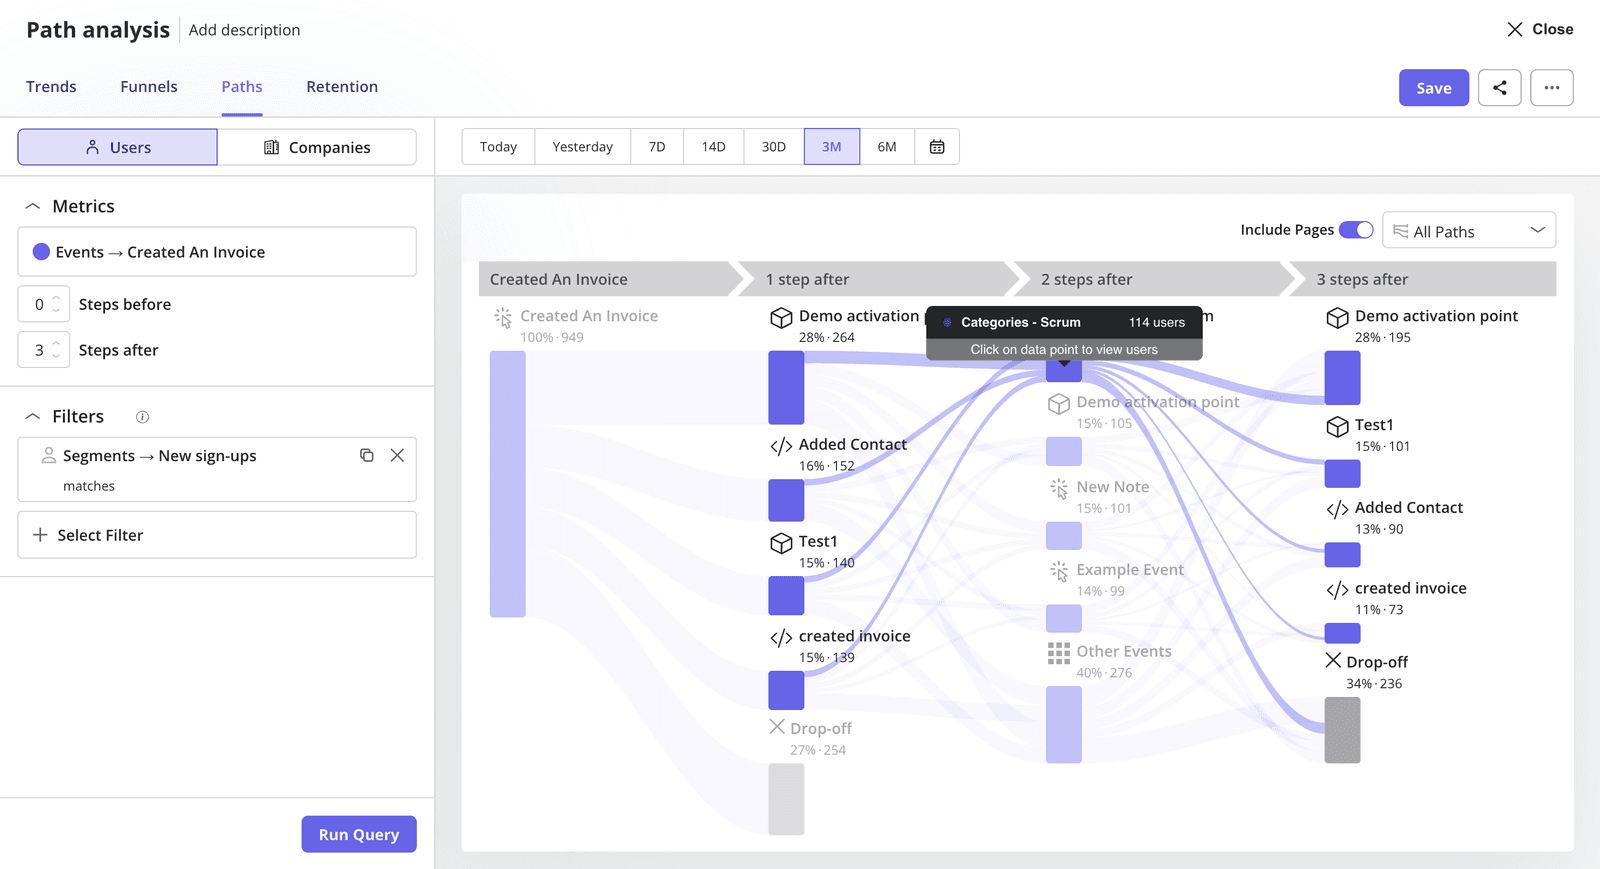
Path analysis is more granular than funnel analysis. It shows you all the actions users take leading up to or following a specific event. It answers the question the funnel can’t: what are users actually doing between these steps?
Path analysis is most valuable for two specific purposes:
- Identifying friction points the funnel doesn’t show you (e.g., a user who completes every funnel stage but takes seven unexpected detours).
- Determining the “happy path” by studying your most successful users. If power users consistently take a specific sequence of actions before reaching activation, you can design your onboarding to replicate that sequence for everyone.
Also, path analysis on feature usage often reveals actions that correlate with long-term user retention. A user who explores the reporting section within the first session, for instance, might adopt it fully at 90 days, faster than a user who doesn’t.
Trend analysis
Trend analysis tracks how a metric changes over time. It’s the primary tool for measuring whether an intervention worked and for catching problems before they happen.
Two uses matter most in practice:
- Measuring the impact of a specific change.
- Spotting correlation patterns that generate hypotheses. A drop in feature usage that overlaps with a drop in overall engagement may indicate the two are linked.
After shipping the email domain checklist, for instance, trend analysis on domain verification completion rates showed me whether the intervention moved the metric or not.
Retention cohorts
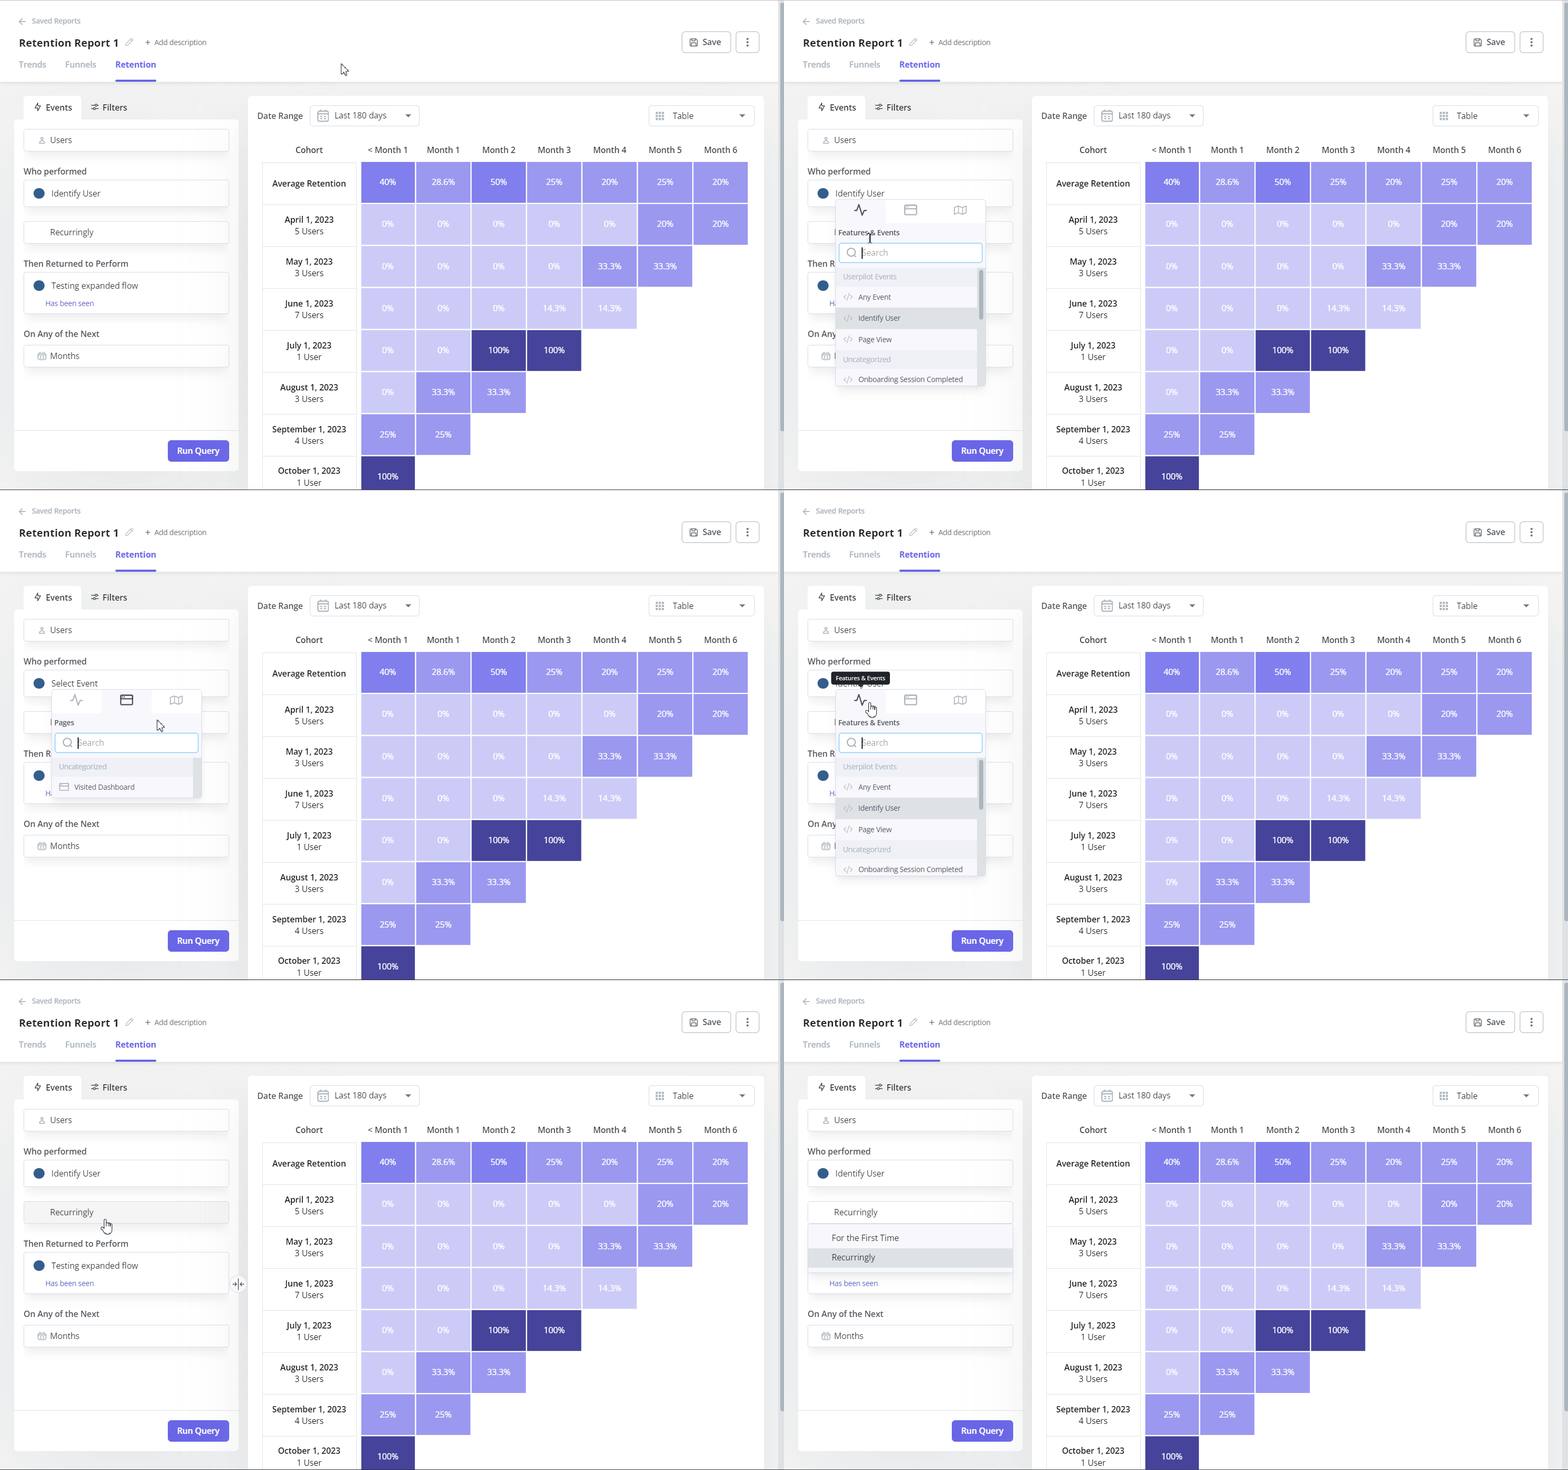
Retention cohort analysis groups users by their signup date or first activated feature, then tracks their behavior over time. It’s the method that answers whether the users who convert are actually sticking around.
Now, defining retention for a complex product can be challenging, or as James Mitchinson (our Customer Success Manager) describes our example: “For Userpilot, what does ‘activated’ or ‘adopted’ actually look like? Is it that they published a flow, or set up a dashboard, or launched the resource center, or watched a session replay?”
For this, retention cohort analysis helps resolve the ambiguity. It can test users who completed action X in week one and see if they retain better at 30, 60, and 90 days than users who didn’t. If one activation action consistently predicts retention, it belongs in your onboarding checklist. If it doesn’t, it’s a distraction.
Session replay
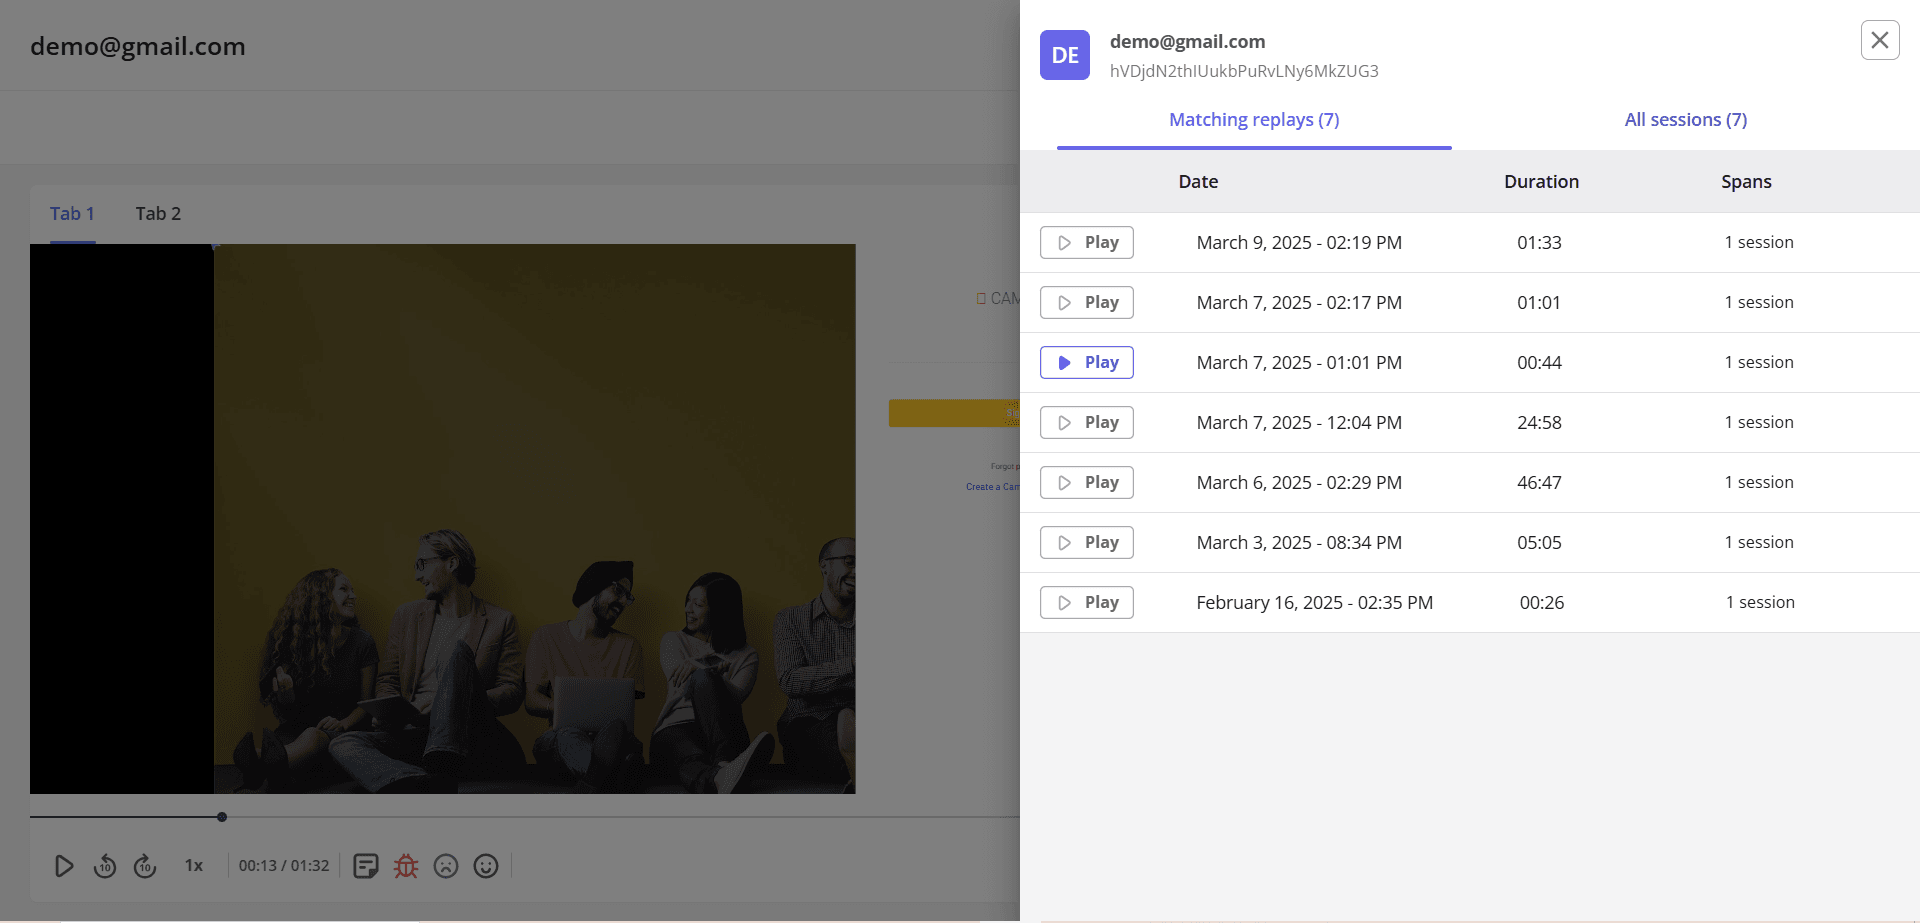
Session replay is where behavioral analysis shifts from quantitative to qualitative. It records every click, scroll, hesitation, and back-navigation so you can watch what happened instead of inferring it from event data.
For example, Kevin O’Sullivan described how session replay changed a specific design decision. Userpilot’s product team was looking at an event distribution chart that most users seemed to scroll past. The internal assumption was that the chart wasn’t providing value. “We went to session replay to validate that, or kind of explore if that was true or not,” Kevin said. “Around 10% were hovering on the distribution chart. If we scale that up, 10% is actually quite a lot. We were nearly going to remove it, then we pulled back.”
The team’s response wasn’t to remove the chart or leave it untouched. They made it collapsible: users who didn’t find it useful could skip past it, users who did could engage with it. “Session replay kept us from making a drastic decision,” Kevin said. The quantitative data had suggested the chart was useless. The qualitative data said it was useful to a meaningful portion of the user base.
Session replay is also the bridge between other types of analysis. Funnels tell you where the drop-off is happening, session replay shows you how users are getting stuck at that specific point, and surveys close the loop by telling you how users feel during that step. Each method answers a different question, but together they give you a complete picture.
How to perform user behavioral analysis: A 5-step process
Behavioral analysis is only as useful as the context you’re using it for. Running a funnel analysis without a clear goal attached to a business objective is how you end up with interesting data and no idea what to do with it. Here’s the process we use at Userpilot, with AI assistance built into each step.
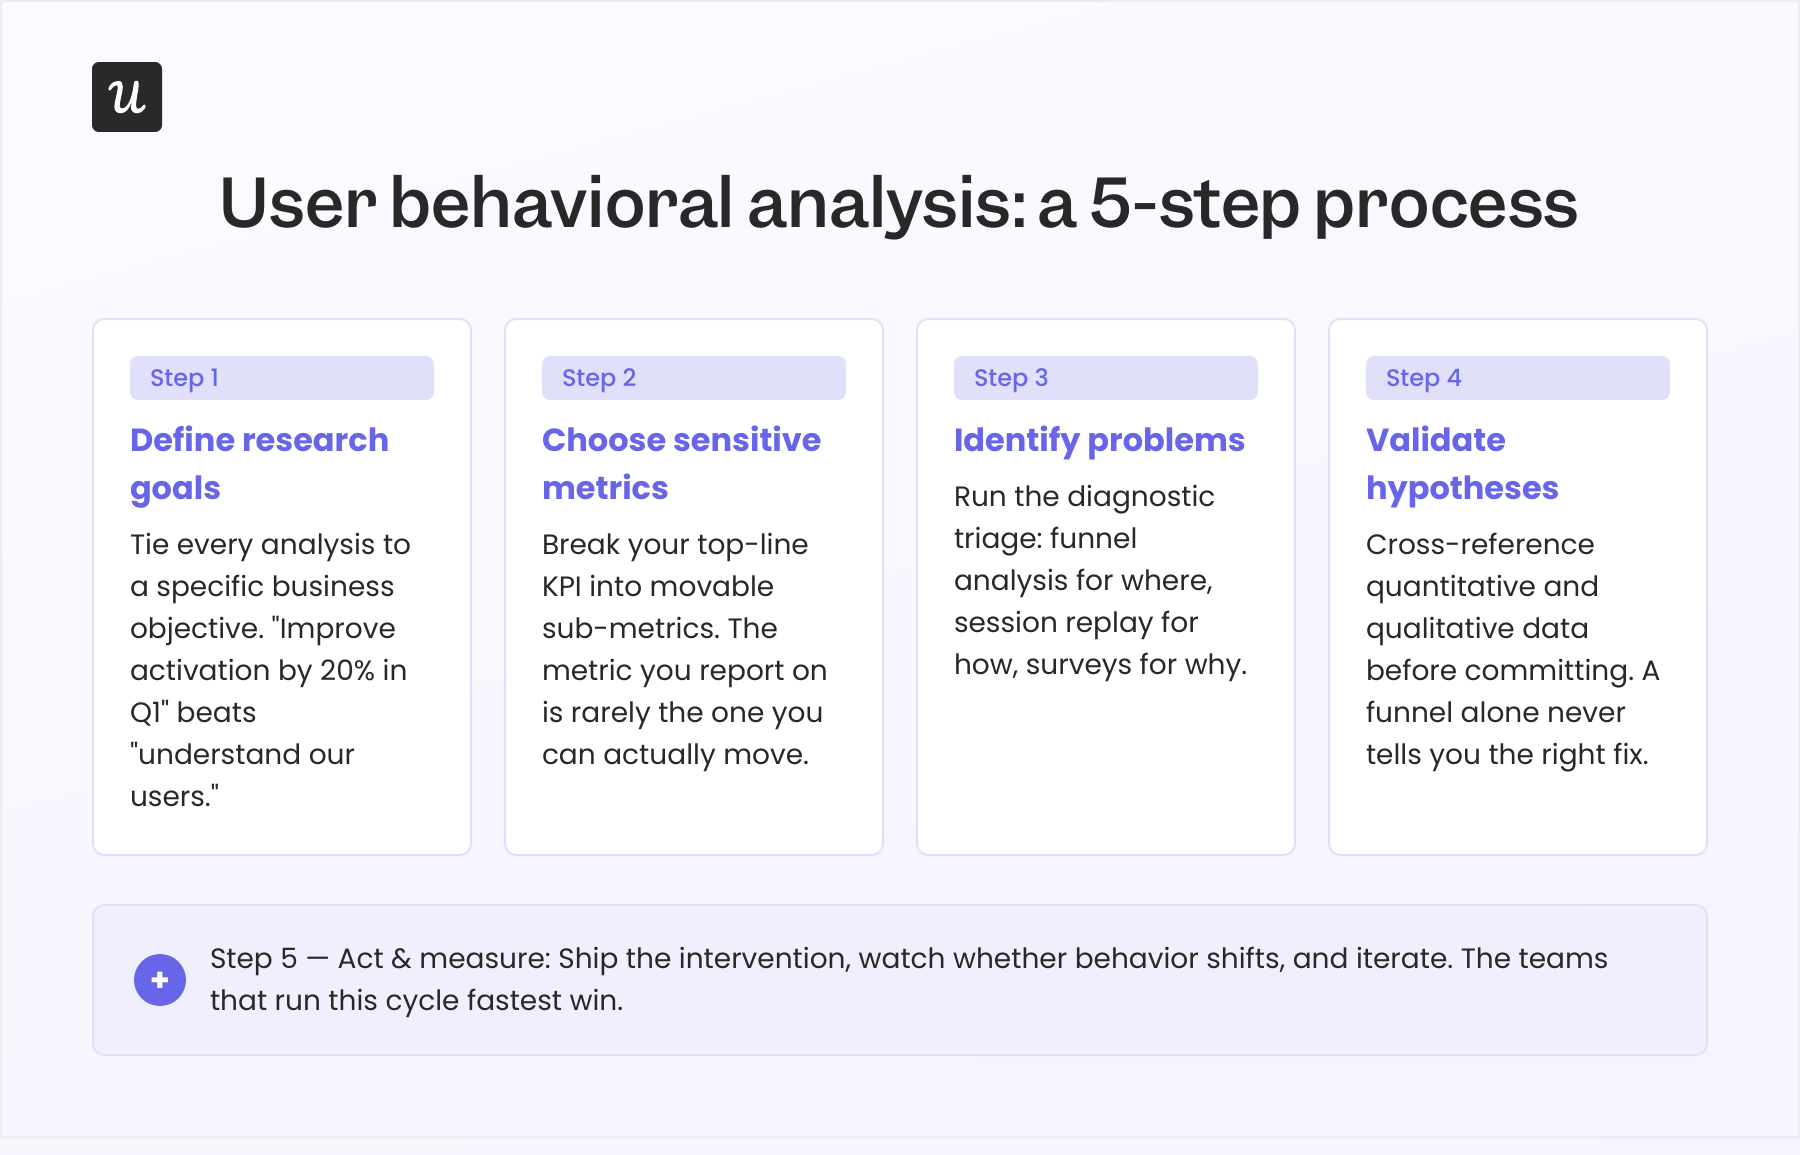
Step 1: Define research goals aligned to your business KPI
The most common mistake in behavioral analysis isn’t picking the wrong method. It’s starting without clear user research questions. “Understand our users better” is not a research goal. “Improve user activation by 47% by the end of Q1, specifically by reducing drop-off between signup and first value moment” is one. The specificity determines what data you need and what counts as a result.
For example, Userpilot’s customer Attention Insight set exactly that kind of goal: improve user activation by 47% in Q1 by implementing interactive onboarding. That goal told the team which metrics to track, which part of the funnel to focus on, and what success looked like before they started. Goal-setting frameworks like OKR and SMART are useful here, not because the framework matters but because making a goal specific and time-bound forces you to clarify what you’re actually trying to learn.
Even if you don’t know what metric to focus on, you can use AI to help you. In Userpilot, for instance, Lia can analyze your most retained users’ behavioral patterns and surface which activation events to use as research proxies. This way, you can set a goal for your analysis with empirical evidence at hand.
Step 2: Break your main KPIs into sub-metrics
Once you have a goal to focus on, instead of trying to increase growth or ARR, try to break down your goal’s KPI into smaller, more granular metrics. These are sensitive to specific interventions, and you can figure out which of those smaller metrics has the highest leverage.
Erin Gustafson, a data scientist at Duolingo, documented exactly this approach. In 2018, Duolingo’s DAU growth had stalled. The team built what they called the Growth Model, a Markov chain statistical model that broke DAU into seven user states (New, Current, Reactivated, Resurrected, At-Risk WAU, At-Risk MAU, and Dormant) and tracked the transition probabilities between them. Running simulations showed that increasing the Current User Retention Rate (CURR) by 2% month-over-month had the largest downstream impact on DAU. They staffed a dedicated team around that one metric. DAUs grew 4x.
Now, you don’t have to build a Markov model. You can simply use AI to break down your main KPI into sub-metrics (agents can do this based on historical data patterns) and set up dashboards in Userpilot to track them, then see how your strategies affect them.
Step 3: Find valuable data points based on behavioral data
With your goal and metrics defined, you’re looking for the specific problems that are preventing users from getting to the ideal outcome.
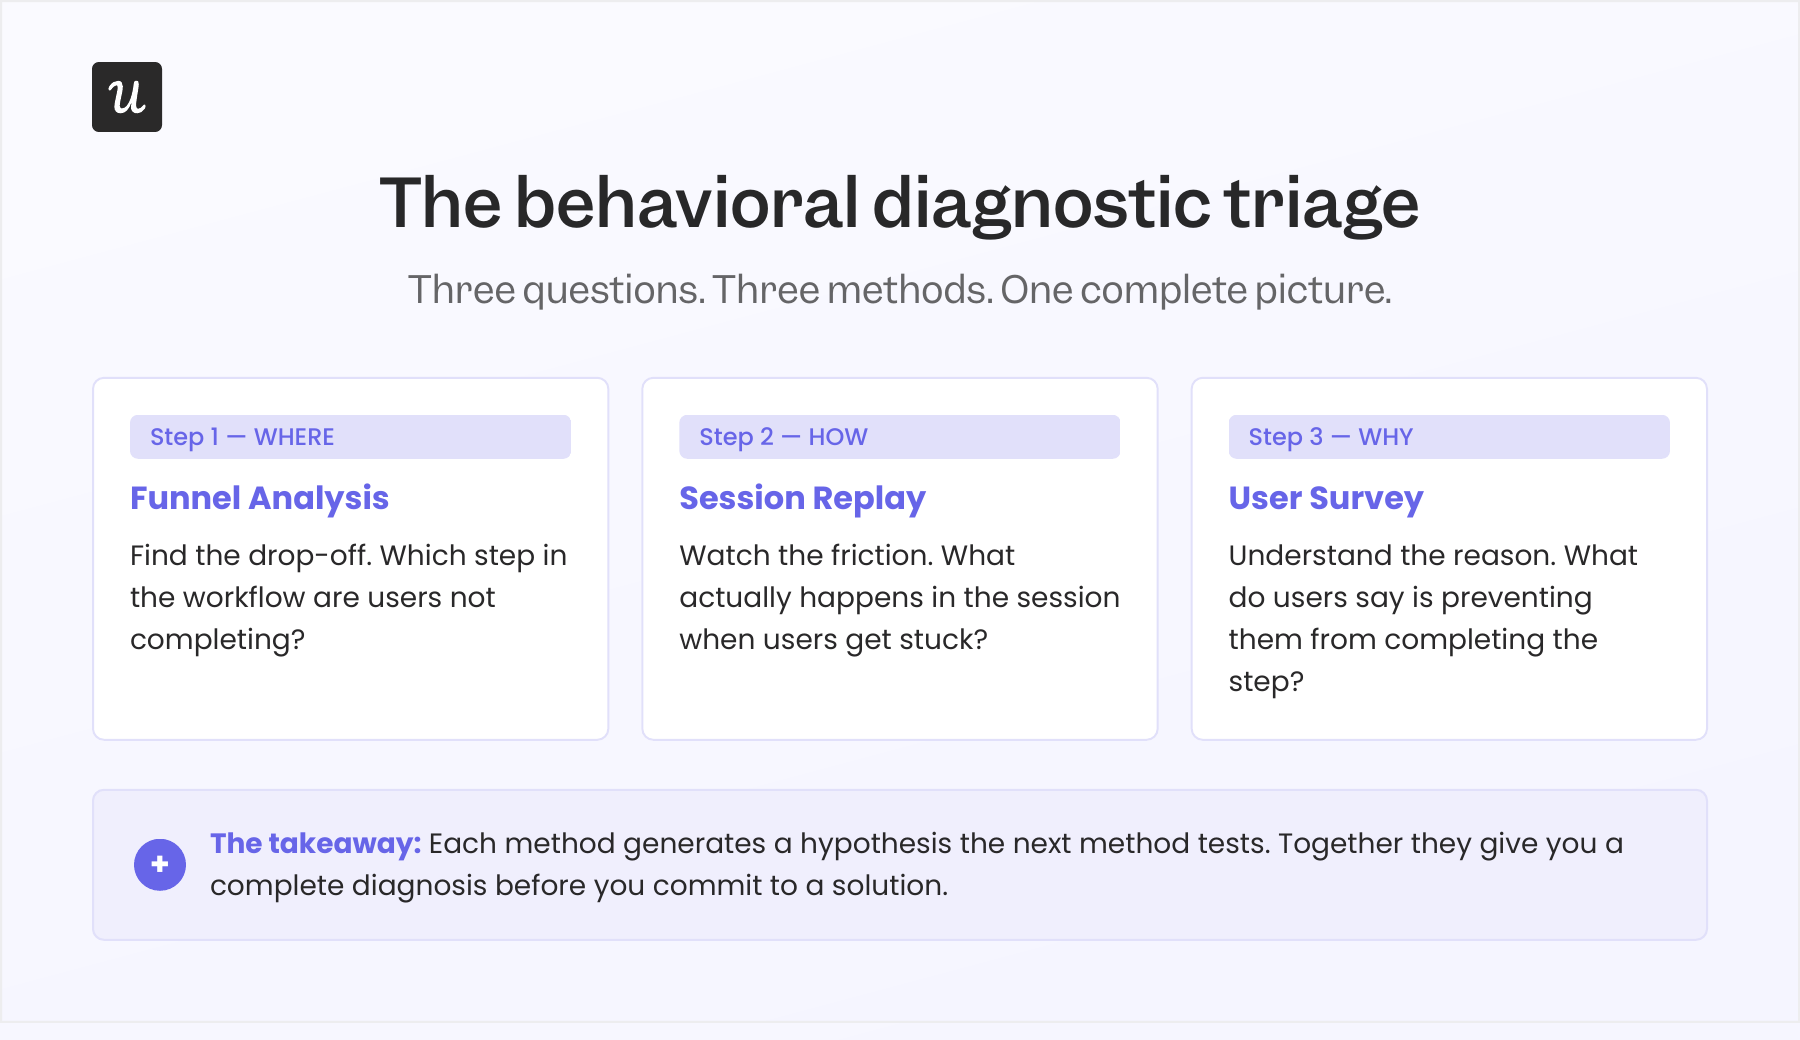
For example, here’s how I investigate feature usage as Userpilot’s PM:
- Check the reports and dashboard related to the feature, looking for where the drop-off is happening, which step users are getting stuck on, etc.
- Watch some sessions, because session replay reveals the real friction points and shows how users actually interacted.
- Send user surveys to understand why users are not interacting after going through multiple things to uncover the main reason.
Funnel analysis shows where the problem is, session replays show how the problem happens, and surveys validate why the problem happens. This process leads to actionable insights and a clear hypothesis for a solution.
Moreover, AI can also help investigate problems in multiple ways:
- Proactive anomaly detection: Instead of waiting for a PM to scan the dashboard, an AI agent flags funnel drop-offs that exceed baseline variance as soon as they appear in the data.
- Behavioral segment analysis at scale: AI can identify accounts or segments that share churn signals across your entire user base simultaneously.
- Cross-source correlation via MCP: An AI agent connected to your analytics platform, CRM, and support ticket system can identify compound signals that no single source reveals. For example, an account with declining feature usage, a recent support ticket about a specific workflow, and no login in eight days is a compound churn signal that many humans could miss.
- Priority ranking: AI can estimate the scale of a behavioral problem before you decide whether to investigate it, ranking drop-off points by volume of affected users and their downstream impact on retention or revenue.
An example of this is how Lia runs proactively in Userpilot: flagging accounts with unusual behavioral patterns, surfacing at-risk segments before they appear on a churn list, and alerting teams about potential churn signals.
Step 4: Validate insights by cross-referencing quantitative and qualitative data
Once you’ve collected valuable data points, validate your hypotheses against multiple data types.
Kevin O’Sullivan described why multiple methods matter: “The best way of conducting any sort of research is not to follow one method only. Try to marry the quantitative with the qualitative. Session replay is the perfect blend: it’s a qualitative method, watching sessions, at a quantitative scale, every single user who’s ever interacted with the feature.”
For the email domain verification drop-off, for example, the funnel showed where the problem was (the domain activation step). Session replay showed how users were getting stuck (they couldn’t find the verification flow inside the settings page). A short survey on users who had dropped off there would have confirmed why (the setup required technical steps that felt outside their job description). Cross-referencing all three makes the hypothesis solid enough to act on with confidence.
Today, although AI can’t fully automate this, it can support you in multiple ways:
- Survey synthesis at scale: Instead of reading every open-text response manually, AI clusters them thematically, surfaces the most common reasons users cite for a behavior, and flags responses that are unusual enough to deserve individual attention.
- Session pattern analysis across large samples: AI can analyze a batch of session replays and identify common patterns: the specific UI element most users hesitate on, the action that precedes most drop-offs in a given flow, the behavioral divergence between sessions that convert and sessions that don’t.
- Alternative hypothesis generation: Running your hypothesis through an AI thinking partner might surface blind spots in your own reasoning before you commit to a solution.
- Natural language behavioral querying: Instead of configuring a custom segment to test a hypothesis, you ask in plain language: “Show me sessions where users dropped off at domain verification and compare them to sessions that completed the step.” The comparison comes back formatted for analysis, without a report-builder session.
- Cross-referencing quantitative and qualitative at the same time: AI agents can match a user’s survey response to their specific session behavior, then flag cases where what they said and what they did contradict.
Lia in Userpilot, for instance, can cross-reference survey responses with behavioral data automatically and generate a synthesized summary of what the combined data suggests about a specific hypothesis.
Step 5: Act, measure, and repeat
The last step is acting on the diagnosis and measuring whether the behavior has changed. This sounds straightforward, but it has a specific failure mode: acting on the right diagnosis with the wrong solution, and then assuming the diagnosis was wrong.
The email domain verification example illustrates this well. I shipped an in-app checklist for domain verification, then tracked it. If domain verification completion rates improved, the intervention worked. If they didn’t, the next question was whether the solution was wrong or whether the problem diagnosis needed revision.
In the end, it helped us understand what’s working, what was missing, and what should move into the roadmap next. I thought that maybe the MVP is not good enough for users, so we opened up phase two for the future.
This process is iterative, so the best approach is to run these cycles quickly. Thankfully, AI can help this iteration in many ways:
- Continuous metric monitoring post-intervention: An AI agent monitors the relevant metrics from the moment the change goes live and alerts you when a meaningful result occurs.
- Behavioral trigger-based interventions: AI agents connected to your analytics platform can close the detection-to-response loop automatically for routine cases. When a user’s behavioral pattern crosses a defined threshold, the agent can trigger a checklist, a tooltip, a proactive outreach flow, and so on.
- Proactive recommendations: when an intervention doesn’t produce the expected behavioral change, AI can analyze the post-intervention data, compare it to the pre-intervention baseline, and generate hypotheses for why the solution didn’t work.
In Userpilot, for instance, Lia alerts you when a meaningful behavioral shift occurs and flags when enough time has passed without movement to suggest the solution isn’t working. She can also detect a drop-off, match it to an existing flow in your Userpilot library, and trigger it for the affected segment automatically via MCP.
Behavioral analysis in 2026: Faster, sharper, still human at the core
The fundamentals of behavioral analysis haven’t changed. You still need a clear research goal, the right methods, and human judgment about what the findings mean for your product and your roadmap. No AI tool changes that.
What has changed is the signal-finding labor. AI can continuously scan every metric, flag anomalies before they reach your churn list, and correlate behavioral patterns across thousands of sessions. Tools like Lia do the monitoring work in the background, surface what’s worth paying attention to, and leave the product decisions to the people who have the context to make them.
If you want to see how Userpilot helps product teams run behavioral analysis with Lia’s proactive pattern detection, book a demo today to start improving the product experience.
FAQ
What is user behavioral analysis?
User behavioral analysis, often called user behavior analytics (UBA), is the practice of collecting, visualizing, and interpreting data about how users interact with your product across their journey. It includes methods like funnel analysis, session replay, path analysis, trend tracking, retention cohort analysis, heatmaps, and user surveys.
How is user behavioral analysis different for AI agents vs. human users?
Human behavioral data has natural variation: non-linear paths, hover and idle time, hesitation before clicks, backtracking, and variable session timing. AI agents produce deterministic paths, near-zero idle time, no hover or scroll signals, consistent inter-event timing, and high task-completion rates.
How do AI tools change the behavioral analysis workflow?
AI agents like Lia handle the pattern-detection and monitoring work that used to require manual dashboard scanning. They use machine learning algorithms to surface anomalies in user activity data, flag at-risk accounts, analyze survey responses at scale, and alert teams when a metric moves unexpectedly. The judgment about what to do with a finding still requires human context, AI is most useful as the layer that surfaces what’s worth paying attention to.
How is user behavior analytics for product teams different from security UBA?
In product management, UBA means analyzing how users interact with your product: tracking user activity, user engagement, feature usage, and the behavioral patterns across user journeys to improve the user experience and drive retention. In cybersecurity, UBA focuses on monitoring user activity within an organization’s network to detect anomalous behavior that may indicate insider threats, compromised accounts, suspicious behavior, or potential data breaches. Security UBA tools create baseline models of normal behavior patterns using machine learning algorithms, then continuously monitor user activity data for deviations that could signal a security incident.
This article covers product behavioral analysis. If you’re researching security UBA for threat detection or incident response, look for tools in the endpoint detection or security operations category.
About the author