What is Behavioral Analytics? Benefits, Examples, and Tools


Here’s my two cents: Most teams don’t have a data problem; they have a behavior problem. They’re only tracking pageviews and clicks when they should also be studying sequences, patterns, and intent.
That’s why behavioral analytics matters. It shifts the conversation from “Where did users click?” to “What were they trying to accomplish, and where did the product get in their way?”
But the part that really resonates with me is how user behavior isn’t linear, predictable, or polite. People rage-click, wander, backtrack, and take shortcuts you never intended. Yet this messy reality is exactly what gives us insight if we’re willing to study it.
In this article, I’ll break down what behavioral analytics is, why it’s becoming a non-negotiable part of modern product design. I’ll also include examples of how teams use it to ship experiences that feel intuitive.
What is behavioral analytics?
Behavioral analytics is the study of how people interact with your digital product.
Behavioral analytics is the tracking and studying process of how people interact with your digital product.
Think of events such as clicks, page views, swipes, form submissions, and even the hesitation before they click a button.
Behavioral analytics focuses on tracking specific user actions, events users take within your application or website.
Examples of meaningful user behavioral data
- Visiting the pricing page multiple times, but not starting a trial.
- Skipping key steps during onboarding or walkthroughs.
- Repeatedly using one feature while ignoring others.
- Dropping off at the final step of a multi-step form.
- Rage clicking or quickly exiting after triggering a modal.
- Completing onboarding but never returning to the product.
These behaviors reflect how users interact with your product and what drives or blocks them.
First-party behavioral data vs. third-party demographics
First-party behavioral data comes directly from your product. How users interact, where they drop off, which features they ignore, and what actions they take. It’s real-time, contextual, and key to analyzing user behavior.
In contrast, third-party demographic data often comes from market research or sold reports. It only covers data like location, age, or job title, which only tells you who the user is, not what they need.
Why do we need behavioral analytics?
You need behavioral analytics because it connects reported numbers to real user actions. You can stare at signups, MRR, and churn all day and still have no idea what people did inside your product before they upgraded, or what started to slip when they eventually left.
When I’m making design or roadmap calls, I care less about “retention is down 3%” and more about “which behaviors disappeared before retention dropped.”
Behavioral analytics enables me to turn those scattered clicks and feature uses into patterns I can actually reason about and act on.
Take what happened with Cleeng, one of our customers, as a more specific example of behavioral analytics in practice. They recently redesigned their UI and watched usage of their customer history page crater by 92%.
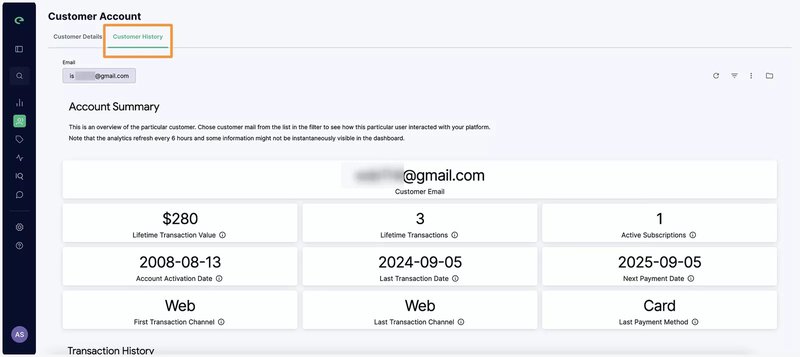
Without behavioral analytics, that would’ve been a complete mystery, just a number dropping with no explanation. But because they had tracking in place, their team caught the issue within days and could investigate what went wrong.
When they pulled up the session replays, everything became clear. Users were searching for the feature where it used to be, but it was completely missing in the new location. The team added a tooltip pointing to the new spot, and usage jumped back up 75%.
So that pretty much sums up why you always need behavioral analytics.
How to start with behavioral analytics
When you’re starting with behavioral analytics, your first move should be getting a solid tracking tool in place. I know it sounds basic, but this is where most implementations fall apart.
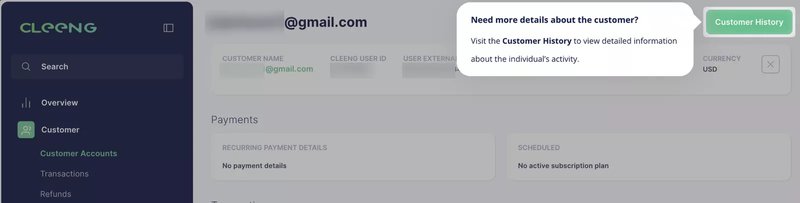
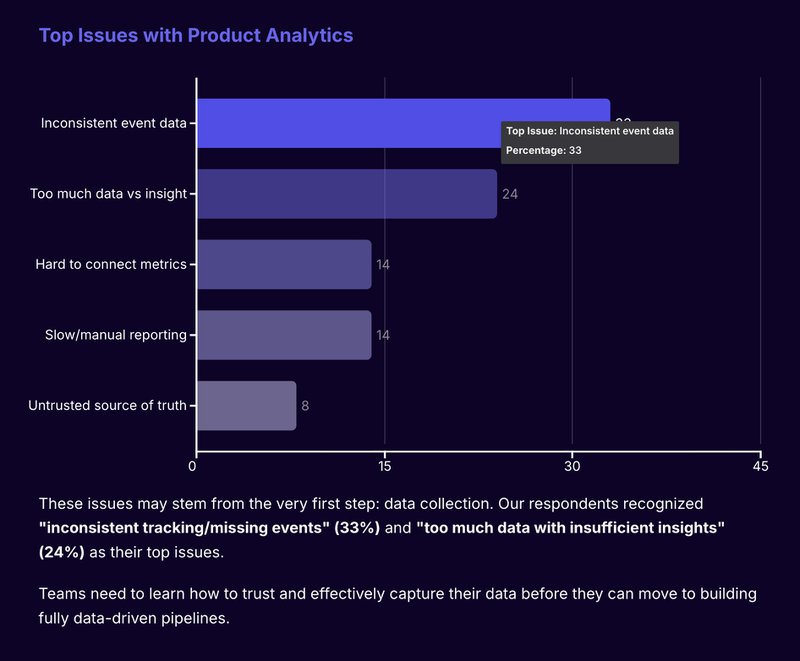
Our recent research backs this up, with 33% of teams citing inconsistent tracking and missing events as their biggest analytics headache.
The common problem is that most teams waste weeks waiting for developers to manually instrument every event. And even then, they still don’t have enough user actions recorded.
This is precisely why I recommend starting with behavior analytics tools like Userpilot that have built-in autocapture. You get usable data flowing from day one instead of sitting around data-blind while your dev team works through the backlog.
Once your tracking is solid, you can focus on the questions that matter for your business. What’s causing drop-offs in your activation flow? Where are premium users spending most of their time compared to free users? You can slice your data by user segments, behavior patterns, and conversion paths to find those answers.
For instance, compare how enterprise users navigate versus free users to spot patterns that drive conversions.
We’re making this entire process even faster with artificial intelligence.
Soon, Lia, our AI agent, will help you automatically surface the insights you need without the manual digging. Want early access? Join our beta!

Common challenges with user behavior analytics
User behavior analytics looks objective on paper, but in practice, it’s easy to draw the wrong conclusions if you rely on a single signal.
I see this come up often when teams debate whether to trust feedback or usage data more. However, the reality is that neither works well in isolation.
- Users may ask for features that already exist but go unused. This doesn’t always mean the feature isn’t needed. It might be hard to find, confusing, or lacking key functionality.
- Product usage data often reflects trends across all users, but feedback usually comes from a small, vocal group. These groups may not overlap.
- Low usage doesn’t always signal low value. Some features are ignored, not because they’re irrelevant, but because users weren’t aware of them or didn’t know how to use them.
To address this, combine behavioral data from session replays, click tracking, surveys, and feature adoption metrics. Use segmentation to separate casual users from power users. This helps you interpret patterns correctly and avoid misjudging users’ needs.
Key behavioral analysis types to collect actionable insights
If you’re only looking at event counts or user drop-offs in Google Analytics, you’re missing the full picture. To extract real value from your collected data, you need the right methods that explain how users engage.
That is exactly why modern behavior analytics tools exist. They’re built to filter raw data, slice it by customer behavior and context, and connect usage patterns to specific business outcomes.
So what does that look like in practice? Let’s break down the core analysis reports you can run with these tools.
Funnel analysis
Funnel analysis is your best starting point for behavioral analytics. It tracks the sequential steps users take toward a specific goal and shows you where they’re dropping off in that journey.
The value here is immediate visibility into your conversion problems.
When you see 70% of users start your signup flow but only 25% complete it, you know there’s friction somewhere in those steps. The behavioral analysis data tells you which stage is causing the biggest drop-off, so you can prioritize what to fix first.
Where funnel analysis gets really powerful is in segmentation.
For example, you can break down your funnels by user attributes like plan type, traffic source, or device. You might find that enterprise trials convert at 45% while freemium users sit at 12%, or that mobile users abandon checkout at twice the rate of desktop users. These insights reflect real customer behavior and help drive specific business outcomes.
Our funnel reports in Userpilot let you set this up without code. You define the conversion steps you want to track, and we automatically calculate conversion rates between each stage.
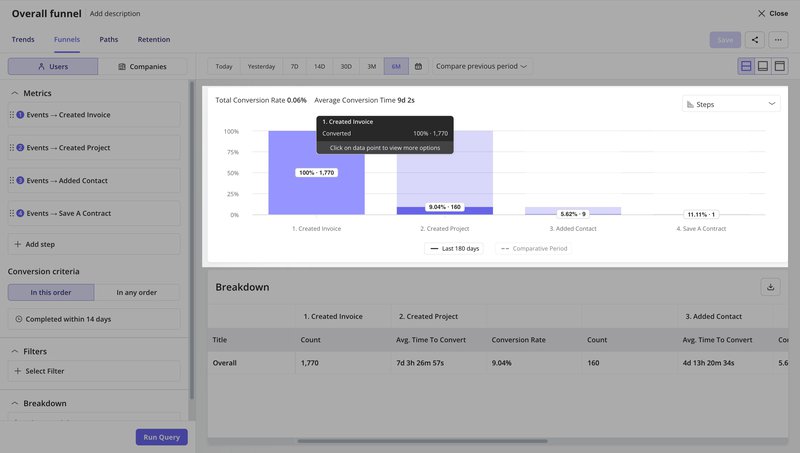
You can also layer on filters to compare how different user segments move through the same funnel, giving you the specifics you need to take action.
Path analysis
While funnel analysis shows you a predefined conversion path, path analysis maps out all the different ways users navigate your product. Think of how they move between features, pages, and actions.
This method helps uncover unexpected behavioral patterns that often explain why some users convert while others drop off.
Say I want to understand what happens after users create their first invoice in your product. Using Userpilot’s path report, I set that as your starting event and look three steps ahead.
The data shows me that 28% immediately hit my demo activation point, 16% add a contact, and 15% create another invoice.
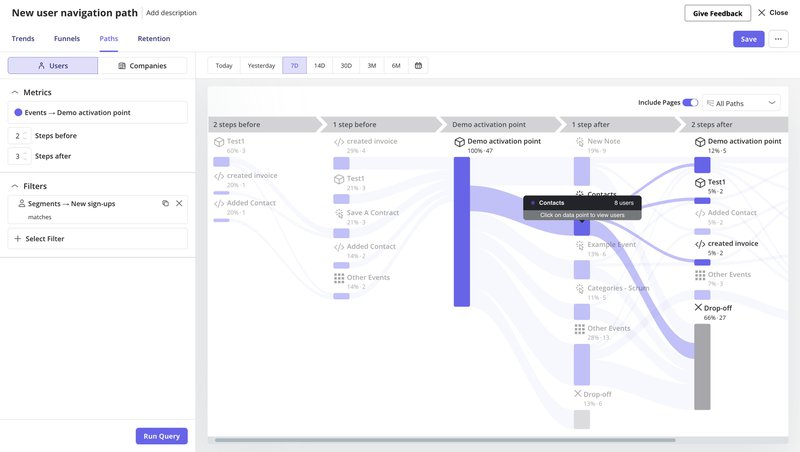
But the interesting part is 27% drop off completely after that first invoice. When I click into those drop-off users, I can see exactly who they are and reach out to understand what went wrong.
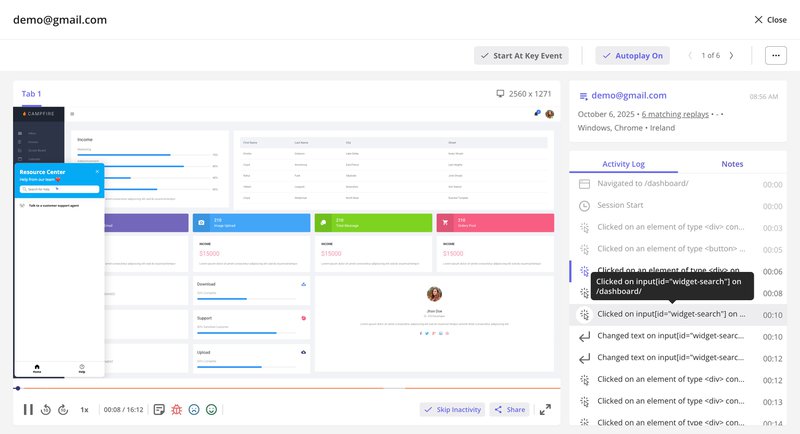
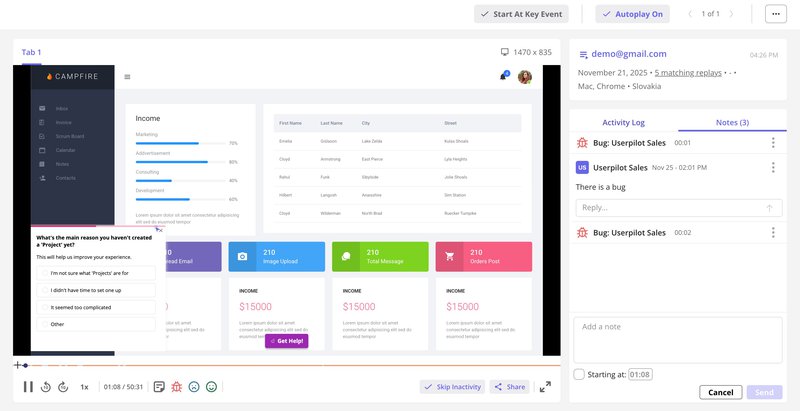
Session replays
This is one of the most effective methods for making sense of behavior analytics data, in my opinion. Rather than showing you event stamps, session replay provides a visual reconstruction of how users use your product.
The value increases when you connect session data with other sources. Say you’re running a path report and notice an unexpected user flow after signup. With replays, you can jump straight into those sessions and watch exactly how user behavior played out.
You can skip idle time, highlight key user interactions, mark bugs, and even share sessions across customer service teams.
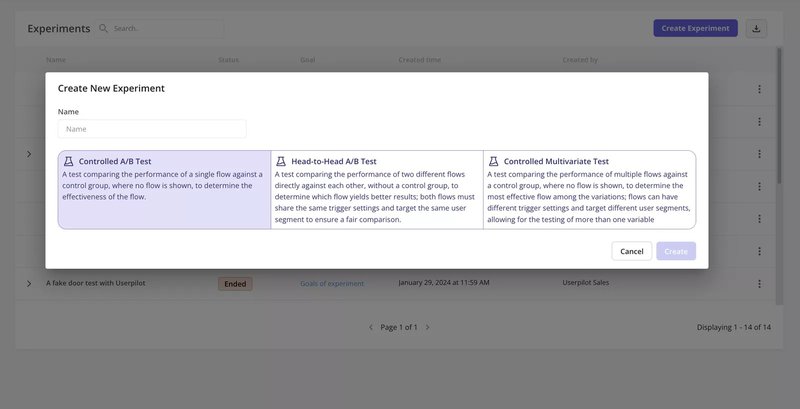
A/B testing
Once you’ve identified friction points, you need to test whether your solution has an impact on the user journey. That’s the entire purpose of A/B testing.
The process is straightforward.
Let me give you an example.
Say your funnel data shows 35% of trial users dropping off before activation. At the same time, path analysis reveals they’re getting stuck in settings instead of completing core actions.
Therefore, you hypothesize that an interactive walkthrough would guide them better than your static welcome screen.
Over time, repeated testing also contributes to better data collection and sharper business objectives. And especially when paired with tools powered by machine learning algorithms that optimize experiments at scale.
How to choose and implement behavioral analytics tools
Your choice of behavioral analytics solution depends on what you’re trying to accomplish.
But if you need a platform that bridges the gap between behavioral insights and action, try Userpilot.
Here’s what I mean by insights to actions.
Let’s take an example. You need to improve trial conversion rates, so you look at user activity after signing up.
It shows new users exploring random features instead of completing activation. You spot the pattern in our analytics. Then, immediately, you can create a targeted onboarding checklist to guide them through the critical steps. All of that without the need to switch tools or wait on developers.
When users complete key actions, you can trigger follow-up experiences across web, mobile, or email to keep momentum going. The entire loop from discovering the insight to fixing the problem happens in one place. Meaning no delays, handoffs, or lost user data.
Implementation is straightforward because everything is visual and no-code.
Your product team can manage data collection, build analytics reports, and create in-app experiences without engineering bottlenecks.
Customer success can launch surveys. Marketing can trigger behavior-based email campaigns. And everyone works from the same source of truth, i.e., clean, usable data tied to the customer journey and your business objectives.
Say one of our customers:
Real-world behavioral analytics examples
You’ve probably heard that behavioral analytics helps you “understand users better,” but what does that look like in real SaaS workflows?
In the following few examples, I’ll show you how teams are using Userpilot to pinpoint user friction, analyze in-app behavior, and act fast.
Amplemarket increases product adoption 10x with session replays
One of our customers, Amplemarket, had a problem you might relate to. They were shipping features every week, but their data analysts couldn’t gain insights from user behavior without jumping through hoops.
Getting basic event tracking required engineering tickets that took 1-2 weeks. They could aggregate data, sure, but they couldn’t detect anomalies or spot unusual behavior when it mattered.
Then we got them set up with session replays, and it changed everything. Now they have a deeper understanding of how each user entity moves through their product.
They watch 10-15 replays after every release to see exactly where people get stuck and make informed decisions about what to fix.
The best part? They can spot anomalous behavior in real-time and validate it with customer feedback.
Combined with our no-code event tracking and in-app guides, Amplemarket now boosts feature adoption by 5-10x for every release.
Their Staff Product Manager, Awni Shamah, put it best:
“Session replays are a huge lifesaver. Whenever a new feature is released, we watch 10-15 session replays to understand how it works. It made our product designers 80-90% more confident in developing new solutions.”
That’s what happens when you can see your user behavior in action.
CYBERBIZ improves user experience with product usage insights
CYBERBIZ, a Taiwan-based e-commerce platform, needed to redesign their admin panel. However, they couldn’t make informed decisions without better user data to understand how customers actually used their features.
Before Userpilot, collecting valuable data meant tedious manual processes. In addition, they couldn’t tell if what they were seeing reflected normal behavior or if those were unusual behavior patterns.
As an e-commerce platform handling sensitive data for stores across Taiwan, CYBERBIZ needed a secure way to track everything in one place.
“In Userpilot, we can connect user data and the feedback together to see the feedback from a specific user.” — Wei-Di Huang, Senior Product Manager at CYBERBIZ
We helped them consolidate their analytics. Now they monitor page views to prioritize features and track session duration to spot friction. Shorter sessions mean users complete tasks faster.
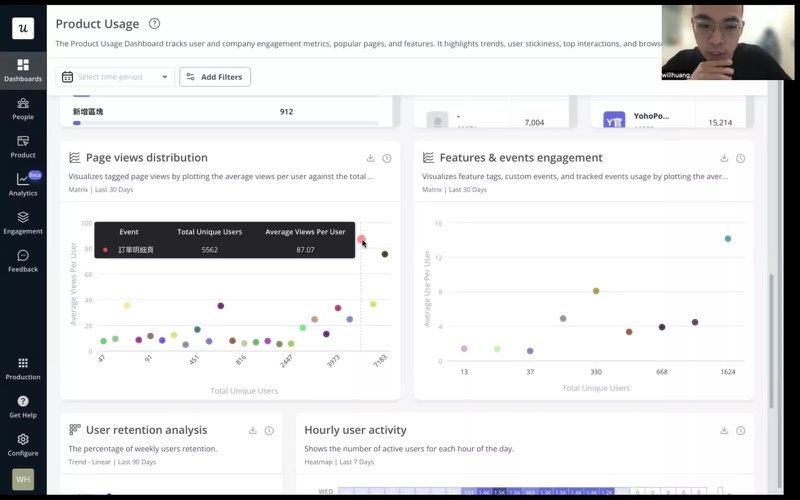
The results? Fewer support tickets after launches and better-informed redesign decisions.
Beable increases content engagement with funnel analysis
Beable, a K-12 e-learning platform, had a problem. They were creating educational content but had no clear way of tracking how students actually engaged with it. Were students watching the videos? Completing the activities? They were flying blind.
Before Userpilot, they tried Google Analytics 4 but found it too complex. Analyzing data required developer help, and the reports were cryptic.
We helped them set up funnel analysis to track the complete student journey, from clicking on content spotlights to watching videos to completing surveys. Now they can see exactly where students drop off and understand user preferences by breaking down results by school site.
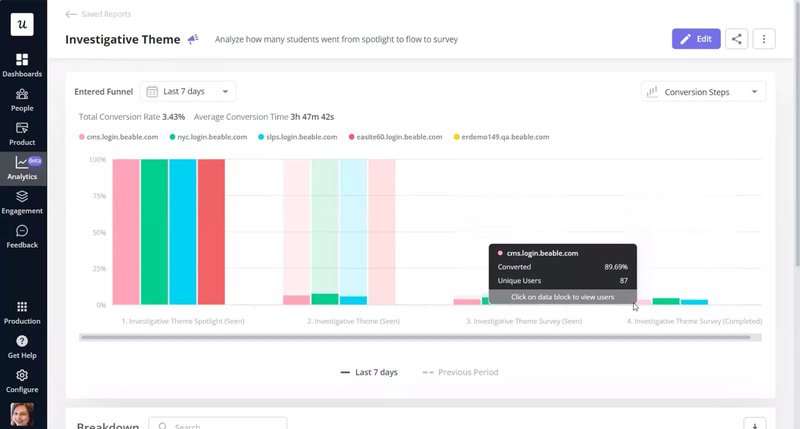
The results? A 77% survey completion rate when they asked students about contest prizes.
Now they also leverage surveys to collect actionable insights for product development.
“We are using surveys now to ask users about possible re-designs of pages. This is informing our product development roadmap and process.” — Ann Marie McNamara, Senior Product Manager at Beable
Accelerate your product growth with behavioral analytics!
You’ve seen how teams use behavioral analytics to move faster from detecting friction to doubling engagement and making smarter product decisions. Now it’s your turn. If you’re tired of flying blind with clicks and charts that don’t explain the “why,” it’s time to go deeper.
Userpilot helps you go beyond surface metrics to spot patterns early, respond faster, and even support use cases like detecting advanced persistent threats alongside product optimization.
Book a demo to see how behavioral analytics can turn your product data into next-step clarity.
FAQ
What does a behavioral data analyst do?
A behavioral data analyst studies user interactions within a product to identify patterns, trends, and issues. They analyze data like clicks, page views, and feature usage to provide insights that help improve user experience and drive product growth.
What is meant by behavioral analysis?
Behavioral analysis is the process of studying how users navigate a product. It involves tracking actions like clicks, navigation paths, and feature usage to understand user behavior, identify challenges, and improve the overall product experience.
About the author