
Not sure how to measure product adoption or what metrics to track?
Product adoption is key to creating loyal users for your SaaS and it’s important to track it regularly.
In this article, we’ll explore how to measure product adoption and twelve key metrics that can provide valuable insights into product adoption.
Try Userpilot Now
See Why 1,000+ Teams Choose Userpilot

Summary of how to measure product adoption
- Product adoption refers to the process by which customers integrate a new product into their daily lives or business operations.
- Feature adoption metrics are important for understanding where users are dropping off, what users find valuable to inform the product roadmap and optimize user personas, and to know where to offer more guidance.
These are the important product adoption metrics to track:
- Product adoption rate
- Customer retention rate
- Customer churn rate
- Activation rate
- Time to Value
- Average session duration
- Usage frequency
- Product stickiness
- Feature adoption rate
- Net Promoter Score
- Customer lifetime value
You can track user adoption metrics by:
- Setting milestones to see how customers progress through activation and achieve their goals.
- Using feature tags to understand how users interact with your core features.
- Experiment with different user journeys to see which ones increase retention rates.
- Observing which user paths activate users the fastest and use them for new signups.
- Tracking these metrics is easiest with a digital adoption and product analytics tool. Why not book a demo to see how Userpilot can help you track these feature adoption metrics?
What is product adoption?
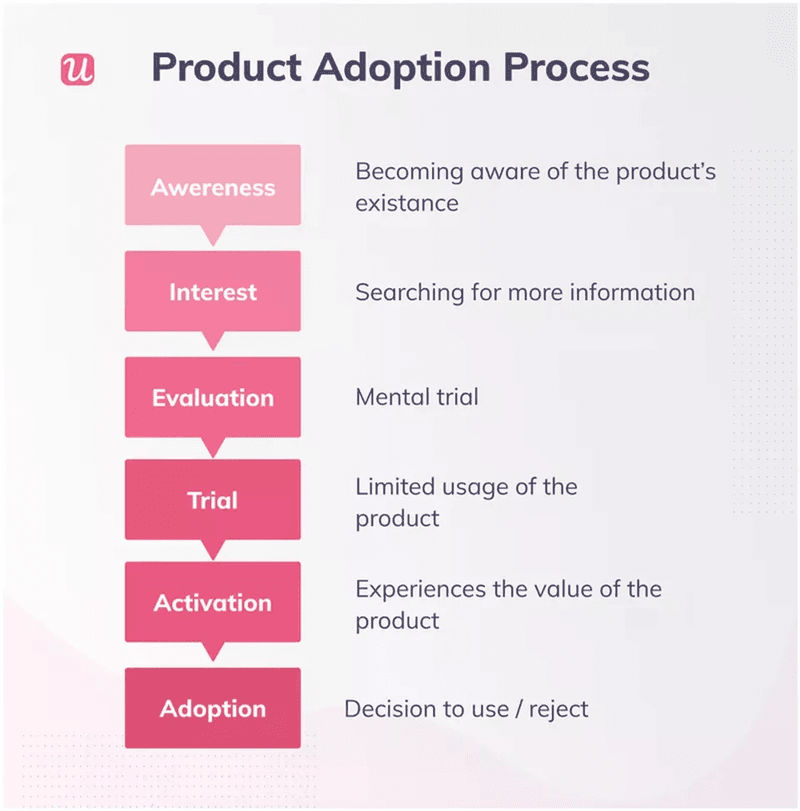
Product adoption refers to the process by which consumers or users accept, integrate, and utilize a new product or service.
It involves the initial awareness and understanding of the product, followed by the decision to try it out and eventually incorporate it into one’s regular routine or workflow.
Product adoption is an important metric for businesses as it indicates the level of acceptance and usage of their offerings among the target market.
Why it’s important to track product adoption metrics?
Product adoption metrics are important as they give insights into how well users adopt your product. They show you what areas are underperforming and need improvement.
You can also see what users find valuable so you can inform your product roadmap for adding new features and use that data to optimize your user personas. It also lets you know what areas users are struggling with so you can provide extra guidance to increase feature adoption.
12 Essential product adoption metrics to track to measure product adoption
There are 12 essential product adoption metrics that can help you monitor and see what needs improving in your product.
Product adoption rate
Product adoption rate is the percentage of users who have adopted your product over time. This metric helps you to see if you are attracting the right audience and if your onboarding process is assisting the users in discovering and getting value from your product.
How to calculate product adoption rate
You can calculate the product adoption rate with the following formula:
Product Adoption Rate = (New Active Users / Total Signups) x 100
New active users are the number of customers that have become active in a specific time frame. They’ve repeatedly performed a set of your key features over a certain duration.
Total signups are the number of users signed up during a specific time frame.
Customer retention rate
Customer retention rate is the number of customers you retain over a specific time frame. It can show you how well your onboarding process is, demonstrating the value your product can offer them and how well it activates them to continue using it.
How to calculate user retention rate
You can calculate the user retention rate with the following formula:
User Retention Rate = ((Number of paying users at the end of the time period – Number of users acquired during the time period)/Total number of users at the beginning of the period) x 100
The number of paying users at the end of the time period refers to those who still get value from your product and continue to pay at the end of the time frame.
The number of users acquired during the time period is the number of new customers captured at the beginning of the time frame.
The total number of users at the beginning of the period is the number of paying customers at the beginning of the time frame.
Customer churn rate
Customer churn rate is the number of customers that stop using your product over a specific time frame.
Initially, it shows you how many users fail to adopt your product so you can investigate why and improve adoption.
How to calculate customer churn rate
You can measure the customer churn rate with the following formula:
Churn Rate = (Total number of users lost during a specific period/Total number of users at the beginning of the period) x 100
The total number of users lost during a specific period is those who have stopped using your product over a specific time frame.
The total number of users at the beginning of the period is the number of active users at the beginning of the specific time frame.
Activation rate
Activation rate is the percentage of users who have completed a specific set of actions or a certain level of engagement that then converts them into active customers.
Measuring the activation rate helps show how successfully you drive the new user to complete activation.
How to calculate the activation rate
You can calculate the activation rate with the following formula:
Activation Rate = (Number of customers who reached the activation milestone/Number of customers who signed up)/100
The number of customers who reached the activation milestone has completed the set of actions or interactions that indicated their activation.
The number of customers who signed up is the total number of users who have signed up for your product.
Time to Value
Time to value measures the timeframe between when users start using your product and when they become paying customers. It helps to inform you how effective your onboarding process is at moving users to experience value from your product in the optimum time.
How to calculate time to value
To calculate the time to value, first, you must make sure customers are getting value from your product.
To find out how your product brings value, track the feature usage of converted customers and run surveys to ask where they derive value from your product.
With this knowledge in mind, you can determine at what point users activate, then track the time to completion.
Average session duration
Average session duration is the average time a user spends engaging with your product. It measures the level of user engagement and how long it takes for a user to get value from one visit.
Average session duration is a key indicator for TTV, helping you determine if you need to adjust the onboarding processes.
It can serve as an early warning sign for potential churn, as shorter session durations may suggest users are spending less time engaged with the product.
How to measure average session duration
You can measure average session duration with the following formula:
Average Session Duration= The total time spent across sessions/ The total number of sessions
The total time spent across sessions is the total duration a user spent on your product over a specific time frame.
The total number of sessions is the number of individual sessions over a specific time frame.
Handy Tip: It’s convenient for SaaS businesses to segment users to find out who your promoters are, analyze repeated usage to see the use of specific features, and focus on the number of sessions and time spent by monthly active users, as this provides more relevant insights than examining all sessions.
Usage frequency
Usage frequency is how many users engage with your product over a specific time frame.
It’s an important feature adoption metric to track because it can show you which features customers use, and how often are the core features used.
How to calculate usage frequency
You can measure usage frequency with the following formula:
Product Usage Frequency = Number of user sessions with a performed key action event within a specific time period.
A user session is when a user engages with your product and typically ends when they become inactive or leave the site.
A key action event depends on your product. Examples could be posting a message, uploading a video, or listening to a podcast.
Product stickiness – Daily/Monthly active users
Product stickiness is how well your product retains and engages users over an extended period. You can measure it with daily or monthly active users.
How to calculate product stickiness
You can measure product stickiness with the following formula:
Product Stickiness = DAUs/MAUs
DAU stands for daily active users and is the number of customers actively engaging with your product within a day.
MAU stands for monthly active users and is the number of customers actively engaging with your product within a month.
Handy tip: Product stickiness can’t let you know which users you’ve retained or which are churning. It’s best to segment users based on their use cases and perform cohort analysis for further insights.
Feature adoption rate
The feature adoption rate is the percentage of users engaged with a specific feature of your product that helps them achieve their goals. It shows you which features users adopt and use and which are relevant to them.
How to calculate feature adoption
You can measure the feature adoption rate with the following formula:
Feature Adoption Rate = (The number of a feature’s monthly active users/The total number of logins or active users during the same duration) x 100
The number of a feature’s monthly active users is the number of unique users using a specific feature of your product.
The total number of logins or active users during the same duration is the total number of times a user logins or is active regardless of whether they use that feature.
Net Promoter Score NPS
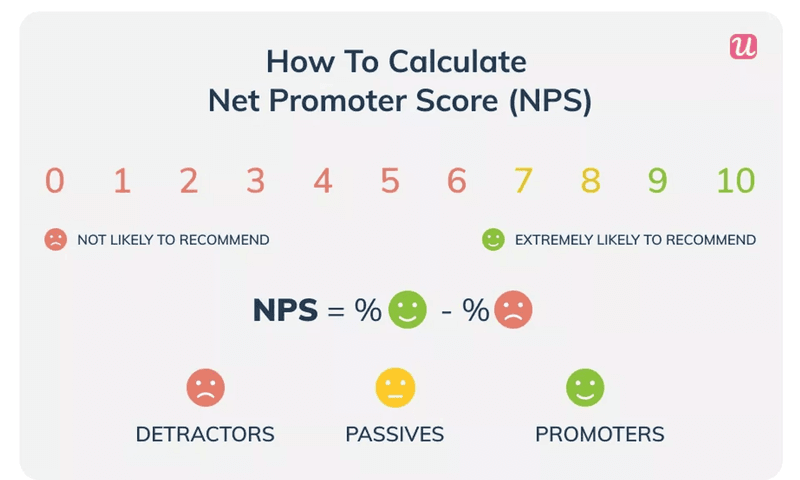
Net Promoter Score (NPS) is a metric that helps to measure customer loyalty and satisfaction towards your product. It is an important metric as a high score means that your user is happy and has successfully adopted your product. In contrast, a low score shows they are dissatisfied and lets you know something needs improving.
How to Calculate NPS
You can measure Net Promoter Score with the following formula:
NPS = Number of promoters – Number of detractors
Promoters are those who choose 9-10. Detractors are those who choose 0-6.
Customer satisfaction score
Customer satisfaction score is the percentage of satisfied customers with your product. And it helps to understand what keeps users using your product and what is causing friction so you can make improvements to increase feature adoption.
How to measure customer satisfaction
You can measure customer satisfaction with the following formula:
CSAT = (Number of satisfied customers/Number of respondents) x 100
The number of satisfied customers is those that complete the CSAT and respond positively.
The number of respondents is the total number of people that completed the CSAT survey.
Customer lifetime value
Customer lifetime value (CLV) measures the financial contribution of a customer during their lifetime as a customer.
A high CLV means that customers are staying loyal and renewing their subscriptions. Whereas a low CLV means that you have a product adoption problem.
How to calculate the customer lifetime value
You can measure customer lifetime value with the following formula:
Customer Lifetime Value = Customer Value* x Average Customer Lifespan
* Customer value = average purchase value x average purchase frequency rate
Average purchase value is the total revenue generated from each customer transaction divided by the total number of purchases.
Average purchase frequency rate is the total number of purchases made by customers divided by the total number of purchases.
Average customer lifespan is the length of time a customer remains an active user divided by the total number of unique customers.
How to track product adoption metrics
Now you know the essential metrics for product adoption, here are four ways to track them.
Track feature usage with feature tags
Tracking feature usage with feature tags helps determine which features customers use most and where they spend most of their time.
If new users aren’t using certain key features, it reduces the chance of product adoption. You can identify underperforming areas of your product with feature tags and contextually prompt users to adopt these features.

Create different funnels to understand which one leads to increased retention
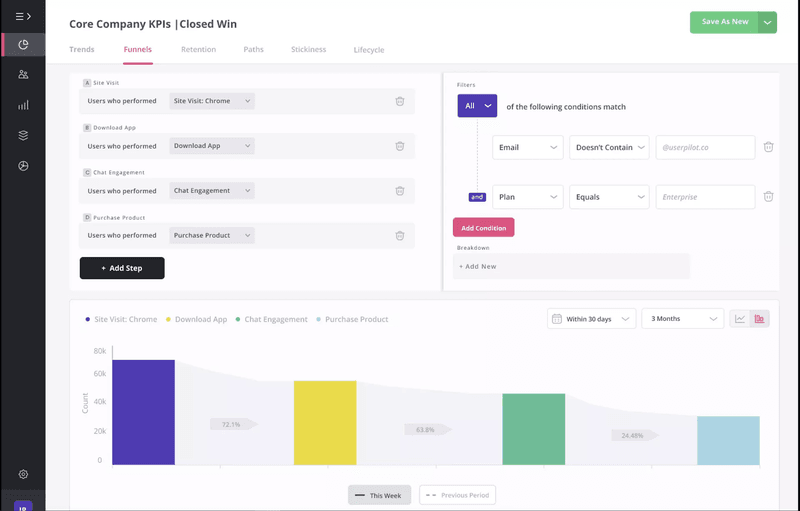
You can create different user journeys representing specific paths you expect new users to take, guided by key events.
By monitoring drop-off rates at each point along these journeys, you can identify the most effective path that minimizes churn and maximizes retention.
With this in mind, you can drive better product adoption, increasing retention and long-term customer success.
Track paths to understand how users get to experience value
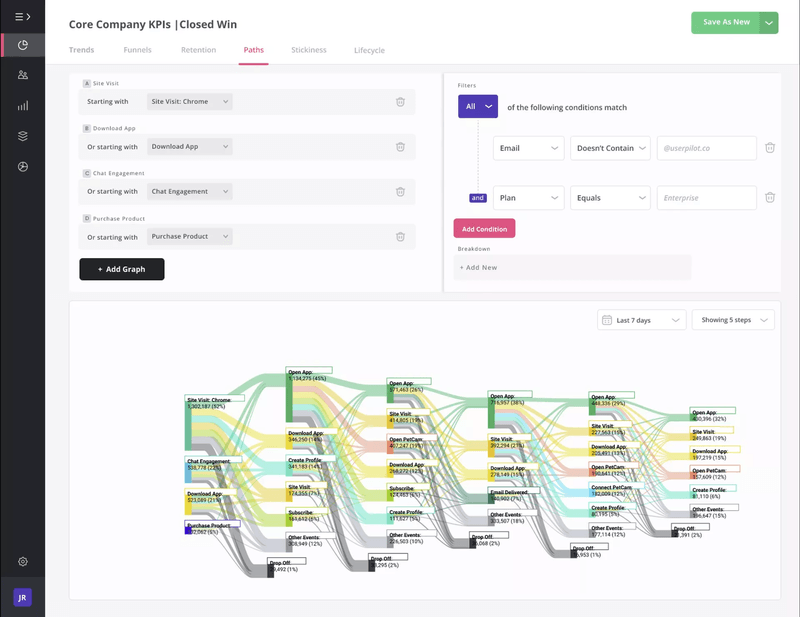
Tracking paths is a vital strategy in tracking product adoption.
Add starting points to the customer journey and observe how users reach the activation point through different paths.
Through analyzing user paths, the one with the shortest Time to Value (TTV) can be determined and utilized for new signups.
Digital adoption platforms to measure and improve product adoption
Tracking multiple metrics manually, especially when monitoring 12 separate metrics, can be time-consuming. However, digital adoption platforms can alleviate this burden.
Here are three leading software options in the market that can assist you in effectively measuring and optimizing your product adoption efforts.
Userpilot – best digital adoption and product analytics tool
Userpilot is an all-in-one product growth platform that combines advanced analytics and in-app engagement capabilities. It enables you to measure and increase adoption by leveraging real-time data. Onboard and engage mobile app users by creating personalized messaging, push notifications, and surveys.
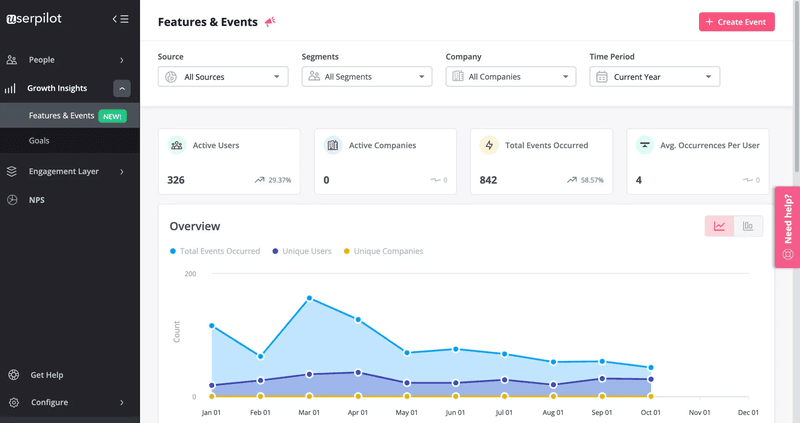
Some of Userpilot’s key functionalities are:
- Goals: You can create goals to determine how users meet their milestones.
- Trends: Identify trends in product usage.
- Funnels: Create paths based on different actions to monitor the dropoff rate at each stage.
- Paths: Observe the different paths users take through your product.
- Surveys: Create NPS and CSAT surveys in your product and on mobile without writing a line of code.
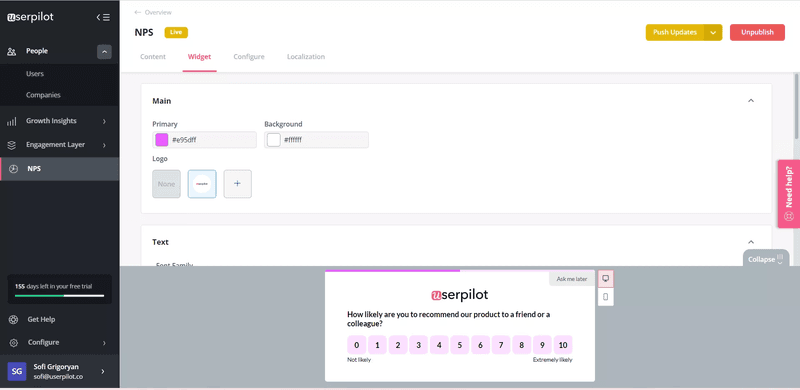

Events: Trigger events in-app to drive engagement and adoption.

Mixpanel – product analytics platform
Mixpanel is a robust product analytics tool used by organizations across various industries. It enables product teams to track and analyze in-app product engagement for web and mobile applications.
Mixpanel empowers you to define and track events, set up reports, and monitor vital metrics.
To leverage data and enhance product adoption metrics, consider using a product adoption tool that seamlessly integrates with Mixpanel, such as Userpilot.

Appcues – for measuring product adoption on mobile
Appcues is a platform designed to support product adoption. It offers basic features such as tracking product usage and user behavior within the application, conducting user surveys, and designing simple in-app onboarding experiences to encourage product engagement and adoption.
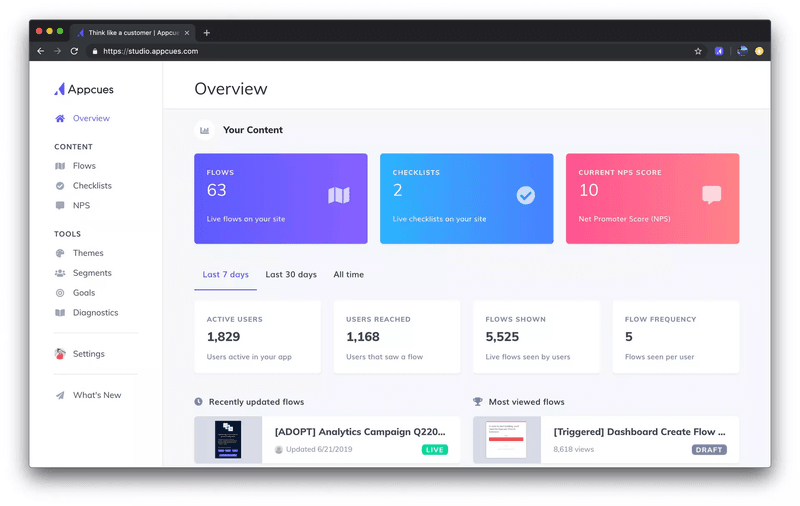
Some of Appcues key functionalities are:
- Interactive product tours: Uses templates that can be customized only via CSS.
- Checklists: Use checklists to highlight key functionalities only available on the premium tier.
- Mobile support: Support product adoption strategy on mobile.
- Events Explorer: Appcues allows you to define events as user interactions with your product’s UI features or flows, requiring just a few clicks to set up.
- NPS surveys: Create NPS surveys and analyze results.
Conclusion
Tracking product adoption is vital for optimizing feature adoption and improving user experiences, allowing you to identify areas of improvement and enhance your product.
By implementing digital adoption and product analytics tools, companies can gather valuable insights, make informed decisions, and establish a strong foundation for growth and competitive advantage in the market.
Want to get started with product adoption? Get a Userpilot Demo and see how you can help to track your product adoption metrics and increase feature adoption.


